It may be revised downward in the two revisions that will be made to last week’s first quarter U.S. GDP growth report but even if not, this was still a low-quality GDP report. Several one-time factors – lower imports, inventory buildup and higher Pentagon spending were key contributors to the surprising (well above consensus estimate) of first quarter GDP growth. Based on the one-offs, current quarter output is poised to slow. Arguably the single most important sub-component of GDP was soft in the 1st quarter and more consistent with 1 to 1.5% GDP growth. As the accompanying chart shows, final sales to private domestic purchasers rose only 1.3% on an annualized basis, the lowest in nearly a decade. Investment by businesses in equipment managed a meager 0.2% growth in QI. For my friends in the construction industry, fixed investment in private non-residential and residential structures each declined on an annualized basis. Despite the political cheering, I still hold to a sub 2% GDP growth in 2019.
Archive for the ‘U,S, Economy’ category
The Worst Best 1st Quarter GDP Report
May 2, 2019Price Pressures are Building in the U.S. Economy
August 10, 2018There is disagreement among economists over how big a threat is rising inflation. A tame consumer price index and modest U.S. wage growth have many economists arguing against further interest rate increases in 2018. But there are signs that higher prices are working their way into the economy. The most obvious example is in goods that are affected by the trade war (skirmish?) between the U.S. and just about every other nation on earth. Steel, aluminum, lumber, and washing machines are examples that have increased the price of building materials for new homes, laundry equipment, beverages in cans, and some other consumer goods. Even if the self-inflicted harm of a trade war disappears, however, consumers are likely to begin feeling price hikes. So much of what consumers purchase is transported via truck that recent increases in transportation costs (see graphic), unless abated, will soon affect consumer prices.
We see this with gasoline price spikes and their resulting impact on grocery prices. Today, strong demand and worker shortages in the trucking industry are dramatically raising the cost of truck transportation services that will eventually work their way into consumer prices.
Not With a Bang But With a Whimper
July 26, 2016The U.S. economy is currently in its 86 month of an economic expansion that began in the summer of 2009 according to the National Bureau of Economic Research, the organization that officially dates U.S. business cycles. If the expansion lasts another seven months (as it will), it will be the third longest economic expansion in our nation’s history, trailing only the 120 month expansion from 1991 to 2001 and the 106 month expansion from 1961 to 1969.
The probability of recession in the next six months is low but the business cycle hasn’t been repealed, another recession will occur and almost certainly sometime before the end of 2019. It’s just that none of the excesses – wage and price growth, high energy prices, inflationary pressures, inflated asset values, etc.- that have preceded past recession are much apparent in today’s economy and there aren’t signs that any are imminent. What will make the next recession unique in the post WWII era is that it may very well occur before the nation has fully recovered from the previous recession, despite how long the current recovery has lasted. “Fully recovered” here means that the actual output of the nation’s economy (GDP) reaches its potential output (for a brief explanation of actual and potential output of the economy see this Congressional Budget Office publication). This is somewhat akin to feeling the effects of a hangover in the morning despite not having enjoyed the celebration the night before. Unlike the last recession, or most recessions, the next one may not begin with a bang but rather with a whimper.
No expansion can last forever; the U.S. and the NH economies are showing signs of slowing so it is difficult for me to believe that the nation can avoid slipping into recession sometime during the first term of our next president. If that President is named Clinton it will most likely mean a one-term presidency as three consecutive terms for an incumbent party (relatively rare in itself) along with a recession in the third term (unless is happens very early in her term allowing sufficient time for growth prior to 2020) would almost certainly result in the nation looking for a change in the party controlling the White House. If the President is named Trump he will no doubt blame the recession on the past administration and that may help give him a pass in 2020, but a recession will challenge his claim as someone who knows how to create jobs, while his penchant for populist and nationalistic themes aren’t generally viewed as monetary and fiscal policies effective in combating a recession. His administration’s and his personal response to the recession might determine his fate (does anyone else remember the images of the first, single-term, President Bush zooming around in his cigarette boat off the coast of Maine while the U.S. was in the middle of the 1990-91 recession?).
The past two months have been marked by one very bad and one very good month for job growth in the nation and in NH. I advocate looking at three months of job growth numbers in discerning employment growth trends and a prudent man would wait for the release of the nation’s July job growth numbers on August 5th before making any proclamations about the direction of the U.S. or NH economy. But a prudent man doesn’t write this blog and I am comfortable knowing that when you right too early it often seems like you are wrong so here are a few of the more accessible indicators that I believe suggest slower economic growth moving forward. There are others but jobs and revenues are what interest policymakers most so they are highlighted here.
- The rate of private sector job growth has slowed.
- The number of industries that are adding jobs versus the number shedding jobs (the employment diffusion index) has declined.
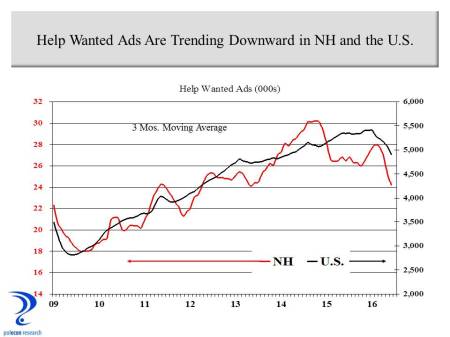
- Help wanted advertising is declining.
- Nationally, state corporate income tax collections appear to have peaked.
Slowing Private Employment Growth
Recognizing that there is always some level of unemployment in the economy, the nation and NH are at or very near “full employment,” making job gains harder to obtain. Full employment in the latter stages of recovery is the most obvious rationale for slower job growth going forward. As the chart below shows, growth in private sector employment nationally is still solid but has been trending downward for some time while growth in NH accelerated in 2015 but appears to have peaked in early 2016.
The Breadth of Job Gains Narrows
I use a 13 industry private employment diffusion index to assess the breadth of job growth across the private sector economy. When more industries are adding jobs than are shedding jobs, the index is below .50 and the greater the number of industries adding jobs compared to those shedding jobs the higher is the index number. The chart below shows that both the national and NH diffusion index have dropped, with NH’s decline of particular concern as it now stands below .50 on a three month moving average basis. NH’s employment numbers are often substantially revised so this index value may not be as bad as it appears here but the U.S. number still points to a slowdown.
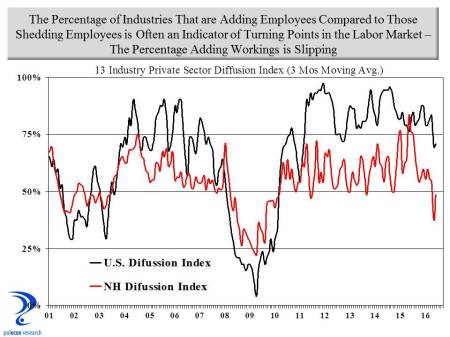
Historically, significant declines in NH’s employment diffusion index have signaled turning points in the state’s labor market. The relationship between NH’s diffusion index value and the rate of year-over-year private sector job growth four months later is strong (a correlation of .82). A simple linear regression of the NH diffusion index on private sector employment growth suggests the last two quarters of 2016 will see private employment growth in NH of about 0.6% on an annualized basis compared to the current rate of growth of about 2.0%. Clearly not in danger of recession but definitely a slowdown.
Fewer Help Wanted Ads
Nationally and in NH the number of help wanted ads has declined in recent months. In NH the relationship between the three month moving average of help wanted ads and job growth in the quarter that follows is strong (R= .80).
Growth in State Corporate Income Tax Collections Has Peaked
Nationally, the rate of growth in state corporate income taxes is declining (chart below).
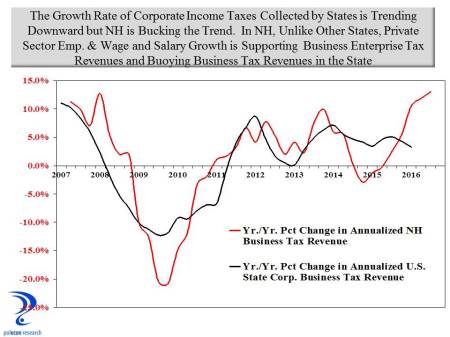
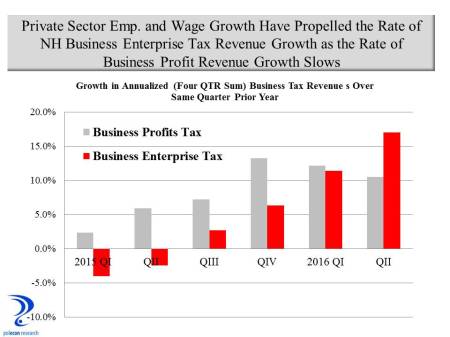
The chart shows that compared to all states combined, the growth in NH’s business tax revenues is increasing as the growth rate nationally declines. This despite the fact that NH’s private sector employment growth has been at about the U.S. average over the past year. What is different in NH is the inclusion of NH’s Business Enterprise Tax revenue along with NH’s tax on corporate profits in the chart above. Both private employment and wage growth have accelerated in NH over the past year. Wages and salaries paid by a business are the largest portion of the Business Enterprise Tax base so even as business profits grow more slowly, business tax revenues can be buoyed by substantial increases in overall wages and salaries. While not a measure of the payroll of NH businesses, wage and salary income increased in NH by 8.6 percent between QI 2015 and QI 2016 compared to 5.3 percent nationally. That increase has helped boost Business Enterprise Tax revenue and overall business tax revenue in NH in a way that it cannot in other states (most other states would see the change in individual income tax revenue). The trend is depicted in the chart below that shows the growth rate of the annualized business profits portion of NH’s business tax revenue has slipped while the growth rate of the portion more dependent on wages and salaries has seen accelerated growth. A slowing growth rate in private employment in NH implies slower growth in wages and salaries and business tax revenues in the state growing more similarly to the pattern among states nationally. This will occur just as a budget surplus and strong overall revenue growth have increased pressures for additional state spending that had been muted by several years of relatively weak business tax and overall revenue growth.
It is impossible to predict monthly payroll employment growth for a small state like NH (or any state for that matter) but I predict employment growth of about 120,000 jobs nationally in July but anything between 100,000 and 150,000 would be in line with the indicators highlighted in this post and consistent with a gradual slowing of economic growth nationally and in NH. Not soon but at some point that slowing will become a recession and that will be the reward for winning the White House and for new and incumbent occupants of statehouses across the nation.
How Much of a Benefit is Low Oil Prices?
March 7, 2016Low oil prices have provided an economic windfall to households in New Hampshire and across the nation. Based on actual 2014 energy consumption and expenditure data for NH, changes in 2015 energy prices, and forecasts of 2015 energy consumption (actual data won’t be released for another year), I estimate that businesses and households saved about $1 billion in 2015 as a result of lower oil prices (Figure 1).
Households saved over $800 million – largely as a result of lower gasoline prices – and businesses saved nearly $200 million. In 2015 households in NH spent about $665 million less on gasoline than they did in 2014 and about $800 million less than they did in 2012 (Figure 2).
Here I am talking about the monetary impacts of lower oil prices, the distribution of impacts among states, between business and households, by different income levels, and how increased U.S. oil production is changing the demand for imported oil. While the overall impact is a net positive on the U.S. economy – especially consumers – the net benefits to our nation’s economy have been smaller than many anticipated. This is not a full accounting, I do not consider any environmental implications (I will write about some of those in future posts on carbon emissions, carbon taxes and climate change that are sure to incite the unstable) or the fact that low oil prices make Vladimir Putin only slightly more scary or any number of petroleum states that much less stable.
There was a time not long ago when low oil prices would have provided a stronger stimulus to the U.S. economy, as every dollar saved by businesses and individuals as a result of lower oil prices translated into nearly a dollar of benefits to the U.S. economy as more of the dollars saved were dollars not being sent overseas. But today many more of the petro dollars saved are dollars that would have gone to U.S. businesses and workers, reducing the overall net benefits that lower oil prices have on the U.S. economy. Figure 3 shows the dramatic increase in U.S. oil production beginning late in the last decade along with a concomitant decline in oil imports.
Regional Impacts
Make no mistake, lower oil prices are a good thing for U.S. economy overall, but the boom in oil and gas production in the U.S. includes states that are relatively new to energy production, spreading the negative impacts of a downturn in energy markets more broadly across the U.S., as well as some states who have gone from very small to more significant energy producers, deepening the negative impacts from low prices in those states. Texas, Oklahoma, Alaska, Louisiana are used to economic disruptions caused by fluctuations in oil prices (although much of Texas is now much more diverse) , North Dakota and other states not so much. Figure 4 shows the volume of oil production in 2014 by state and thus the relative exposure that these state have to fluctuations in oil prices.
The increase in U.S. oil production was spurred by high world oil prices that made it economically viable to extract oil using more costly methods, as well as improved technologies that made it possible to extract oil that could not be obtained through traditional drilling techniques. A few years ago I worked on an energy project in the Permian Basin of West Texas and Eastern New Mexico that involved enhanced oil recovery (EOR) techniques. At that time the price of oil was around $100 bbl while the break-even price of EOR was approximately $67 bbl. In that environment it is not surprising that a boom in production would occur in areas with even difficult to extract oil reserves. Continued improvements in technology have no doubt lowered the break-even price of EOR below the $67 that it was back in 2012, but probably not as low as the $48 per bbl that was the average price for U.S. crude in 2015, and certainly not as low as the $32 bbl average of January 2016. The sharp decline in oil prices since 2014 is affecting the profitability, production, and employment of energy companies and those that service and supply them. Low oil and gas prices don’t help energy producing states the way they help NH and other non-energy producing states because the benefits of lower oil and gas prices to households and businesses are mitigated by the reduction in investment and employment in oil and gas extraction, transportation, and the industries that support them – including financial industries, professional and technical industries (engineering etc.) and many others. Figure 5 shows states at the bottom of private sector job growth in 2015 – all but Vermont and Illinois are significant energy producing states.
Income Support
The benefits of lower energy prices on households nationally have been large. Energy spending dropped from 6.1% of total expenditures of households in 2008 to 4.4% through mid-2015. All households benefit from lower energy prices but the benefits are not evenly distributed. Low-income consumers devote a larger share of their budgets to energy and thus lower energy prices provide a greater relative benefit to households lower on the income scale. Data from the Consumer Expenditure Survey of the U.S. Bureau of Labor Statistics show that consumers in the bottom half of the income distribution devoted 10.7% of their budget to energy expenses, while consumers in the top half of the distribution devoted 8.1% of their budgets to energy (the figures are higher in the Northeast where households spends more on heating and much more on oil heat than the national average). To some extent these differences may overstate the benefits of lower energy prices to lower-income households because the largest difference in the percentage of household expenditures on energy by income level is for electricity; lower oil prices have had little impact on electricity prices, but the benefits to lower income households are still signficant. Figure 6 shows the percentage of total household expenditures in the U.S. that are devoted to energy among households in four different income ranges.
Geopolitics
The most important implication of U.S. oil production may be for U.S. foreign policy. Not only are oil imports on the decline as U.S. production has increased, but the sources of imported oil are also changing. Persian Gulf states are a declining source of oil imported in the U.S., while Canada is a rapidly increasing source (Figure 7).
The historical role that concerns about oil supplies have played in U.S. policies toward Persian Gulf states is debatable but a declining dependence on Persian Gulf oil at least offers the possibility that whatever U.S. involvement continues in the region will be less energy dependent. If current trends in U.S. production and imports continue, it is possible that the only country that the U.S. imports oil from in 10 years is Canada. If I have learned one thing from this presidential primary season it is that not all Canadian imports are a good thing. But, I grew up along the Canadian border and I would be pretty comfortable only relying on the great white north to meet our nation’s demand for imported oil.
What’s Behind the Weak Jobs Report?
April 5, 2013Bad news arrived today with the release of the monthly employment report by the U.S. Bureau of Labor Statistics. Only 88,000 non-farm jobs were added across the country in March. Following two months which saw the U.S. add 148,000 and 268,000 jobs respectively in January and February, the low number raises concerns that the U.S. may again be heading for a “Summer slump” after showing signs of stronger job growth early in the year.
I share that concern but I am most interested in what the job growth numbers may or may not imply about recent U.S. economic and domestic policies. I know sequestration is the hot policy topic and may be blamed or credited for all evil or good that occurs in the U.S, economy this year, but it is really too early for it to register much impact on March’s job growth. Two other policies have the potential to more significantly impact job growth in the near term. The details of the March employment report provide some clues about if and how these policies may affect job growth in the future. The elimination of the temporary reduction in the payroll tax and health care coverage mandates in the Affordable Care Act are policy impacts that we worried about before we started worrying more about the potential impacts of sequestration.
I last posted that gains in home values, stocks and, retirement accounts along with increases in wages and salaries would help the economy overcome the large potential impact on consumer spending from the rise in the payroll tax (elimination of the temporary rate reduction) that took effect in January. I may have been a little too optimistic about those factors ability to help the U.S. economy overcome more than $100 billion in lost consumer spending power (over $600 million in New Hampshire). For me, the most troubling piece of data from the March job growth report was the seasonally adjusted decline of 24 thousand retail trade workers and generally downward trend since January, that has followed several months of solid gains in late 2012 (chart below).
When housing values are recovering, homeowner’s equity is rising, and employment and wages are growing, retail employment should not decline. The elimination of the payroll tax cut (along with higher gasoline prices early in the year) likely provided a greater shock to consumers than anticipated. But another explanation is that implementation of the health care mandates of the ACA could be affecting employment more in some industries. If so, it would likely impact industries that typically are less likely to offer their employees health care coverage and industries that employ more part-time workers. Retail and leisure and hospitality industries meet those criteria but only retail trade lost employment in March. Because the ACA mandates coverage for full-time employees, one way to avoid the mandate would be to increase part-time employment. In that case I would expect the average weekly hours of workers in retail or other industries that may be more affected by the mandate to decline, as more workers were shifted to part-time status but average hours have increased slightly in retail over the past three months. Looking more closely at the data on part-time employment is needed to get a handle on any ACA impacts. Over the next few months I will be looking for evidence of increases in the number of workers working “part-time for economic reasons” – meaning they are working part-time when they want to be working full-time, as well as employment trends in businesses employing between 50 and 499 workers (those most affected by ACA). Trends in these employment data would provide stronger evidence of any ACA effects but for now, it looks like the payroll tax is the culprit in the retail employment data.
Small Business is Not Booming
March 12, 2013The National Federation of Independent Businesses just released its monthly report on the condition of small businesses nationally. The report is based on a national survey and state-level results are not available. However you feel about NFIB or their advocacy positions their monthly report is a valuable source of information about the issues and factors affecting small businesses.
Robust economic growth does not occur unless small businesses are confident, healthy, and hiring. That seems especially true in NH and is one reason NH’s job growth has been slower than the national average. I especially pay attention to the headline portion of the NFIB’s monthly survey, it’s “Small Business Optimism Index”, because it seems to be a pretty good indicator of near-term job growth in the U.S. and NH. The simple correlation between the NFIB Small Business Optimism Index (lagged 3 months because it takes some time for optimism/confidence to affect hiring plans) and U.S. Job Growth is about .68, while the correlation between the NFIB Index and NH employment growth is about .74. Thus the relationship is slightly stronger between the Index and job growth in NH than it is for the U.S. as a whole. The NFIB Index inched-up in February, but overall it remains relatively low, suggesting that small businesses aren’t yet ready to provide the boost to hiring that typically occurs in a strong recovery from recession.
A more troubling indicator of the health of small businesses (and thus hiring plans) comes from the Experian/Moody’s Analytics Small Business Credit Index. This quarterly assessment of the financial health of small businesses suggests the balance sheets of small businesses (in the aggregate) deteriorated in the fourth quarter of 2012. According to the quarterly report:
“Delinquent balances rose, pushing the share of delinquent dollars higher to 9.7 percent from the prior quarter’s 9.4 percent. A slowdown in personal income growth led to sluggish retail sales, hurting small-business revenues. Though small firms have worked to trim their labor costs in recent months, sales have fallen more quickly, forcing many small companies to borrow funds to cover their payroll expenses…..The next six to nine months likely will be lean ones for small businesses as rising taxes strain household budgets and nervous firms of all sizes postpone hiring, thereby stunting the jobs recovery. Consumer sentiment is likely to remain subdued, and spending will be underwhelming, which will keep pressure on small-business balance sheets.”
If We Can Beat the Mayan Apocalypse Why Not the Fiscal Cliff?
December 21, 2012If the Mayan apocalypse can be postponed (I am not sure exactly at which time it is supposed to occur so I may be speaking too soon here) then surely the U.S. Congress can agree to actions to avoid the fiscal cliff. Lawmakers are poised to give us over $500 billion in tax increases and over $100 billion in spending cuts to begin the new year. The fiscal cliff is a pretty big lump of coal as a gift to begin 2013.
What is extraordinary about the cliff’s self-inflicted harm is that it appears almost all sentient beings realize what needs to happen. More importantly, there also appears to be substantial agreement on most of the actions necessary to avoid the economic harm resulting from the fiscal cliff. Spending clearly has to be cut just as surely as revenues have to be raised.
With so much apparent agreement on actions needed to avoid the damage, it is hard to understand the calculus of lawmakers as the lack of an agreement begins to demonstrably affect business and consumer confidence as well as financial markets. Congress always comes up with a temporary fix for the alternative minimum tax and can easily do so again. Almost everyone wants the payroll tax cut to expire (for different reasons – Republicans because they don’t like the temporary nature and believe it has no incentive for work and saving and Democrats because of its impact on the Social Security trust fund). There is little support for extending unemployment benefits. It seems like neither party really wants the spending cuts (Republicans opposed to defense cuts and Democrats to non-defense cuts). There is disagreement over the tax increase for high income individuals included in the Affordable Care Act and Medicare reimbursements for doctors but those are a miniscule portion of the cliff’s effects. Beyond all the posturing, the fight in congress is really about whether to extend tax cut provisions to 98% or 100% of U.S. households.
I know I am simplifying here. Even with many agreed upon temporary fixes, longer-term solutions must be found. But lawmakers could still salvage strong economic benefits by avoiding the worst of the cliff’s impacts in the short-term while resolving longer-term issues in the first-half of 2013. Such a “grand bargain” would both increase business and consumer confidence and set the nation on a more sustainable budgetary and debt path that would quickly overcome any of the short-term negative impacts resulting from necessary spending cuts and revenue increases.
Some Thankfull Job Growth Numbers
November 20, 2012The U.S. Bureau of Labor Statistics released its monthly report on state and local employment today and the good news is that, preliminarily, New Hampshire added 1,000 jobs in October. The bad news is that this is just 1,200 more jobs than the state had one year earlier in October of 2011. For optimists, the most recent trend is likely to be the most important and the monthly report is consistent with the rise in PolEcon’s NH Leading Index.
Nevertheless, the longer-term job growth trend in NH has been weak. Looking at growth in just private sector employment, the situation is no better for NH. As I have noted here, I believe job growth in NH is being underestimated but even if that is true, it is hard to see how the recent past will be revised enough to make NH’s job growth picture look comparable to that of our neighbor to the south or the U.S. as a whole.
State-by-State Economic Outlook for the Next Six Months
October 19, 2012The Philadelphia Region Federal Reserve Bank is producing a leading economic index for each state. The index contains the same economic variables for each state so it is not customized to the specifics of each state’s economy. Some of the index variables are national (similar to my “PolEcon NH Leading Index”) but all of the key economic indicators included yield important information about the likely direction of any state’s economy. The graph below from the Philly Fed suggests that NH, along with VT and CT, will lag the region and much of the country in economic growth over the coming months.
The Philly Fed index isn’t designed to predict just job growth like PolEcon’s (my) NH leading index, but the two indices move in similar ways with changes in the NH economy. I’ve test the ability of both to accurately forecast near-term (6 month) job growth and the PolEcon index does a significantly better job. But the PolEcon Index was modeled and fit specifically to NH data, testing a number of economic variables that have the strongest relationship to NH’s near-term job growth. Doing that for 50 states might be prohibitive, especially for an institution (The Philly Fed.) that primarily serves one economic region of the country. I like the Philly Fed index because and it is great to have a readily available (read free), state-by-state, near-term, economic outlook from a respected and unbiased source. I like it even more when it agrees with the PolEcon Index, as it does now.
What Does the “Misery Index” Say About Election Results?
October 16, 2012I am not a political analyst and this is not a political blog. The polemics of political discourse are as tedious to me as the graphs I use with two Y axes are no doubt tedious to politicos. If you are prone to apoplexy or unable to view any data or information without an ideological lens, stop reading now.
Since Ronald Reagan closed a presidential debate with Jimmy Carter by asking “are you better of today than you were four years ago” that question has been a benchmark in every presidential election and with good reason because the answer to the question is a pretty good predictor of election results. But how do you operationally define “better off”? The sum of the unemployment rate and the inflation rate is referred to as the “misery index”, since a high reading on either one or both of the components would likely have a negative impact on household sentiment. When the misery index is lower in an election year than it was in the previous presidential election, the party in power typically retains the presidency, and when the misery index is higher, the presidency typically changes parties. The chart below highlights the relationship. The chart line shows the value of the “misery index” in the 3rd quarter of each year (just before the election) and each circular marker indicates a presidential election year. The shaded markers indicate a change in control of the party in the White House.
With the exception of the 2000 election of George W. Bush over Al Gore, when the misery index was lower in an election year than it was in the prior presidential election year, the party in power retains the White House and when the misery index is higher, party control of the White House changes. The chart suggests that the 2012 election should be close, but probably leans toward President Obama’s reelection. Looking at the individual misery indices in swing states also gives The President a slight edge.
The misery index doesn’t say much about NH’s gubernatorial election however. The chart below shows that declines in the misery index (compared to 2 years earlier during the prior election for governor) do not appear to be associated with changes in party control of the governorship in the state. The chart does does show that a change is more likely to occur in a year in which the gubernatorial election coincides with the presidential election.
Overall, however, the chart suggests that NH voters do not hold gubernatorial candidates responsible for weaker economic conditions nor are they likely to credit them for good economic performance. Rather, they make their choices based on the perceived qualities of candidates. Isn’t that refreshing?