Archive for the ‘employment’ category

Economic Growth is Solid, Just Not as Strong as You Think

May 7, 2019

In July, the current U.S. economic expansion will become the longest on record and there have been a record 103 consecutive months of uninterrupted job growth.  Not counting the distorting effects of the hiring (and then letting go) of over 411,000 temporary workers on the U.S. Census back in 2009-2010 it would have been 110 consecutive months of job growth.  A similar effect will occur in 2019 and 2020 as the Census Bureau begins hiring temporary Census workers this year and will lay off the workers later in 2020.  You can look forward to a lot of misinterpretation of the job growth numbers in the presidential election year of 2020.

The U.S. economy is strong, but as I argued in my previous post, not as strong as the first estimate of QI GDP growth (3.2%) suggests.  In that post I noted the one-off contributors (inventory builds, lower imports, higher defense spending) to above potential GDP in the first quarter of 2019.  In this post I highlight two employment trends that indicate (to me at least) the U.S. economy is not growing as rapidly as recent reports suggest.

First, growth in aggregate hours worked in the economy is slowing, despite strong gains in job growth.  Aggregate hours worked is a function of both job growth and the number of hours worked each week and the latter has shrunk a bit, offsetting some of the gains in employment.  Aggregate hours worked is related to GDP growth because the more hours worked, the more output the U.S. economy produces.

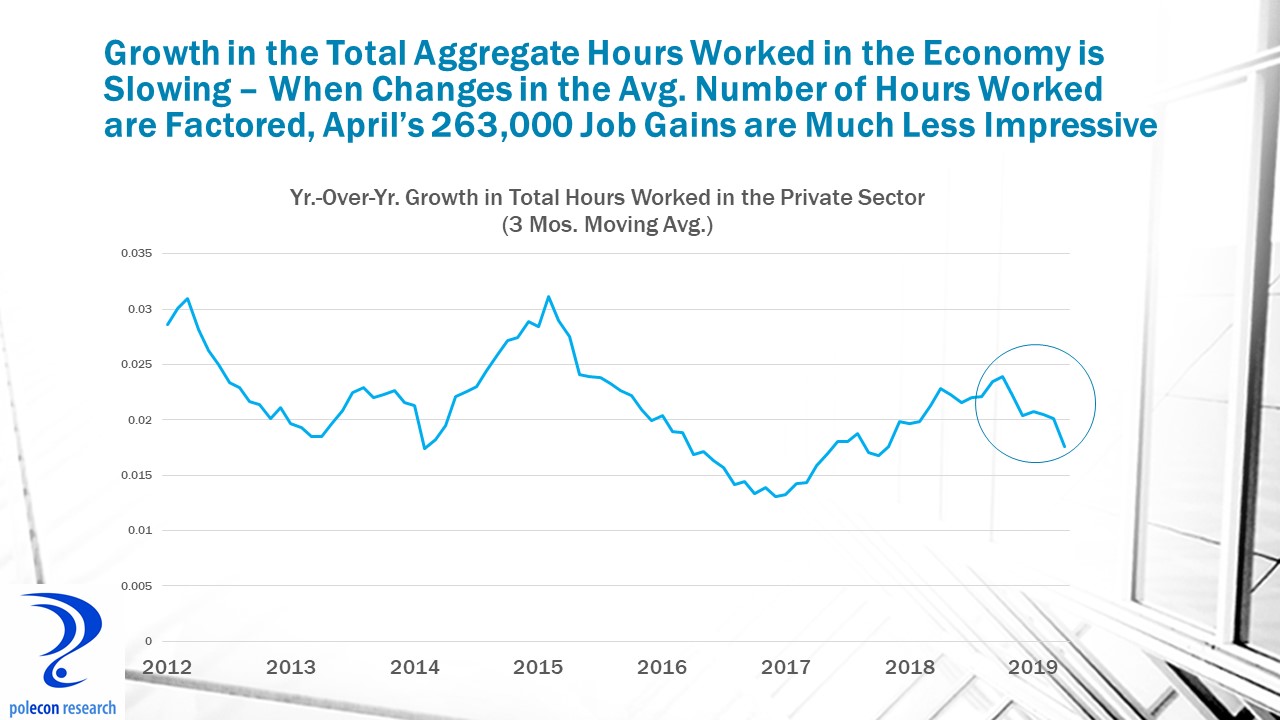
The growth in aggregate hours worked plus productivity growth is a good surrogate measure of trends in GDP growth. Growth in aggregate hours worked plus growth in productivity (how much each worker produces), at a minimum, will tell you whether GDP growth is accelerating or decelerating.  When the average number of hours worked each week is factored into job growth, April job growth looks much more like 100,000 or less, than 263,000.  This makes sense because productivity growth in the first quarter was initially estimated at 3.4%, a remarkably high rate given that annual productivity growth has averaged about 1% for a decade and the combination of 263,000 job growth and 3.4% productivity growth would imply a very high GDP growth (higher than the 3.2% first quarter growth first reported but which I believe will be revised downward).  Productivity growth is notoriously difficult to calculate and count me skeptical of the 3.4% estimate for the first quarter. Still, the first estimate is the one that gets the headlines and later revisions garner less attention.

The rate of job growth is also slowing, not accelerating, as the initial April job growth estimate implies.  Again, the labor market is strong, there are more job openings than workers available to fill them.  Both of the  survey instruments used to measure employment tell a similar story of job growth that is solid but slowing.  Briefly, the payroll survey is a survey of employers in the country, it provides an estimate of the number of non-farm jobs, the average number of hours worked by employees, and the average hourly wages that they are paid.  The payroll survey does not count the self-employed or those not covered by the unemployment insurance program.  It also counts jobs, not people, so one employed person holding two jobs is counted as two jobs by the survey.  The household survey is used to calculate the unemployment rate and labor force participation.  It provides much more information about the characteristics of the employed and of job growth or job loss in a month than does the payroll (employer) survey.  The household survey counts the self-employed and those not covered by unemployment insurance and it counts an individual working more than one job as a single job for total employment purposes.

The household survey tends to be more volatile, as can be seen in the chart above, but the relevant point is that both surveys show employment growth slowing.  That does not necessarily mean a weaker U.S. economy, but rather than the economy is unable to growth because of labor constraints.  The monthly Job Growth and Labor Turnover Survey (JOLTS) highlights this fact.  Looking at the JOLTS data released today shows that the job openings rate continues to rise much faster than the hiring rate, highlighting the growing gap between labor demand and labor supply.  The chart below shows how the gap between openings and hires has grown in just the Northeast region of the country, where labor shortages are among the most acute.

In conclusion, the U.S. economy is solid and labor markets are strong, just not as strong as recent data points suggest, and at a time when there are more downside than upside risks to the outlook.

The Incredible Shrinking Labor Force

January 10, 2014

The employment growth report released today by the U.S. Bureau of Labor Statistics was disappointing for sure (74,000 job growth when 200,000 was the consensus estimate) but December employment numbers are more prone to seasonal adjustment errors because of the large amount of hiring that occurs prior to the holidays and this year presented even more issues because of the shortened time between Thanksgiving and Christmas (Thanksgiving was on the 28th, its latest possible date).  December’s employment growth may still be disappointing but my bet is that December’s numbers will be revised up in future months.  Help wanted ads have been increasing for the past six months and the labor supply/demand ratio has been falling.  Unless there is an even bigger “skills gap” than many think, that implies stronger job growth than was reported in December.

The best thing about the report was that it helps focus more attention on the nation’s incredible shrinking labor force, a problem that significantly lowers the potential economic growth of our nation’s economy.  Too many media reports on the nation’s and NH’s economy focus almost entirely on the unemployment rate.  That is especially true in New Hampshire where, because of our demographics (a lower percentage of harder to employ populations are in our state’s labor force), we always have a lower unemployment rate than the U.S.   No matter how weak job growth is in New Hampshire, many will cite our lower than the U.S. unemployment rate as a sign of economic strength.  Some reporters (hat tip to John Nolan of the Rochester Times) have avoided confusing job growth with the unemployment rate but too many in our state confuse the two.

The problem of smaller or slower growing labor force is an important and vexing one for New Hampshire and the entire U.S. A smaller or slower growing labor force implies slower economic growth because the output of the economy grows when more people are producing, when more capital (equipment and machinery) allows the same number of people to produce more, or when knowledge/technology/skill levels improve and allow greater productivity per worker. So unless productivity is increasing to compensate, a shrinking or slow growth labor force means slower economic growth.

There are several reasons a labor force can shrink or grow more slowly. Some related to economic conditions, some related to demographics, and some (such as the current situation) seem to have an unexplained element. Nationally, population trends have meant slower labor force growth as lower birth rates over the past few decades and as baby boomers reach ages where labor force participation starts to decline. NH benefited from strong population growth in the 70’s and especially 80’s and 90’s. That provided a strong boost to our economy, especially since much of that pop. growth was the result of in-migration from other states by skilled, well-educated individuals (a good characterization of our in-migrants from other states is a two wage earner, married couple family, probably both college educated with children). That migration added tremendous talent to our labor force and made NH an attractive location for many business looking to employ skilled workers.

The labor force grows or shrinks by population growth in the working age population, or by changes in labor force participation (those of working age who choose to be in the labor market or not). NH and the U.S. have seen slower population growth in the working age pop., but more disturbingly, both have seen a decline in the labor force participation rate.  Yes NH still has a relatively higher participation rate but the trend decline is similar to the U.S.  The graph below shows the decline in participation among individuals aged 25-64 (to minimize schooling and retirement decisions as possible causes).

nh us labor force particpation 25-64

If your working age population isn’t growing, having high labor force participation rates is critical for economic growth.   NH has had very high participation rates compared to the U.S. because of our favorable demographics (few people who traditionally have lower levels of participation – minorities, those without a high school diploma etc., and because our population overall has higher levels of educational attainment that is associated with labor force participation).  Women in NH especially tend to have higher participation because of higher levels of education and lower fertility rates (child-bearing lowers labor force participation).  I have written many times on gender and employment (search on gender in this blog) and the “feminization of the workforce” is a theme (non-pejoratively as the father of daughters) I believe is continuing.   As the chart below shows, virtually all of the decline in the labor force participation rate in NH is a result of a reduction in the rate among males.

male female labor force participation

Labor force participation always drops during recessions as workers get discouraged and drop out.  What is especially troubling today is that labor force participation continues to be weaker even as the economy has improved. Some has to do with demographics as more of the working age population ages into groups with lower participation rates although participation among those with higher levels of educational attainment seems to have held-up best. The best explanation of why labor force participation has continued to be lower than in the past is that the skills required by the economy have been changing, making many workers less qualified than before and creating more discouraged workers. I think that is part of the issue but I don’t think the “skills gap” could have so abruptly hit the labor market to cause participation rates to fall so much over the last half-decade. The skills gap has been a more slowly growing phenomenon.  Among older men without a post-secondary degree, participation has been declining for decades.  The skills mismatch between the supply of labor among males and the demand has been ongoing for decades.  Did it peak so suddenly in the past decade to create a permanent decline in the male workforce?  I don’t think so, additional factors are contributing.  I remember in the 70’s when the first real oil crises hit (related to Middle East wars) and a lot of job losses resulted, especially in mill towns like the one I festered in as a youth.  Someone whom I thought was wrong about almost everything said to me at that time “a man should never be ashamed of any job he takes to feed his family.”   I didn’t think much about that back then, but today it seems especially appropriate, even as it appears to be increasingly a relic of an outdated ethic.  Economic conditions today aren’t the result of people not wanting to work and a labor market where many individuals are working at jobs that don’t fully utilize their skills is not desirable.  Changes in and the performance of the economy are  obviously largely responsible for declining labor force participation.   Still, with so many troubling indicators for males  – especially younger males (educational performance and attainment, household formations etc.)  emerging over the past decade or more , I can’t help wonder how much of the decline is the result of a lost ethic among my gender.

More Early Evidence on the Impacts of the Affordable Care Act

May 9, 2013

First, let me start by noting that this is not a post about the merits of the Affordable Care Act (ACA), depending on your political leanings either pejoratively or admiringly labeled “Obamacare,” it is a post  about  policy analysis.  I love public policy analysis and I  tell almost everyone who asks me (there aren’t many) that to understand the full impacts of any  proposal it is far more important to understand the incentives inherent in a policy proposal than it is to understand the goals, objectives or intentions of the proposal. Businesses, just like individuals, will respond to changes in public policies according to their self-interests.  In the case of the ACA, businesses wishing to avoid providing health insurance coverage to some or all employees have an incentive to keep employment levels below the employment threshold at which the ACA applies to a business (50 employees) or reduce the number of full-time employees in order to fall below the threshold.

In a prior post I noted that there was some early evidence of the effects of these incentives on retail employment (an industry with a higher percentage of workers without health insurance coverage) but that I thought more evidence was needed to evaluate any impacts from the ACA.  At that time I suggested that the expiration of the payroll tax cut might be more responsible for declines in retail employment than any impacts from the ACA. I promised to follow the issue so here is some additional evidence and unfortunately it points to some negative employment impacts from the ACA.  Whether this will continue and if it is does whether the negative impacts outweigh any positive impacts from the ACA is fodder for future posts.  For now, the chart below shows how the average hours worked in the leisure and hospitality industry has been declining.  This is an industry with the highest percentage of workers without health care coverage and also with a high percentage of employers near the threshold at which the ACA mandates apply.  It is also an industry that employs large numbers of part-time workers, making it relatively easy for employers to reduce the hours worked by employees in order to have them fall below the criterion that would have them classified as full-time employees for purposes of ACA mandates.   As the  chart shows, the average weekly hours worked in the industry (compared to the same month of the prior year) has declined significantly since the end of 2012.

Avg Hours Worked in Leisure and Hospitality Industries

It is still to0 early to make claims about negative employment impacts from the ACA but the evidence is beginning to point to some troubling impacts.  As we move toward the implementation date for the ACA any employment impacts will become clearer as employers looking to avoid mandates get closer to finalizing the employment level averages that will be used to determine their inclusion or exemption from ACA mandates. Empirically it may be too early to make a definitive call on the ACA’s employment impacts, but based on what I see as the incentives inherent in the ACA, it is just a matter of time before the call gets made.

Even A Broken Clock is Accurate Twice a Day

March 8, 2013

I am frequently in error but rarely in doubt, so when I am right I have to make sure someone notices.  Good news was reported today  on job growth nationally, as an estimated 236,000 jobs were added across the country in February.   I hate to sound jaded but in each of the prior two years job growth looked to be accelerating early in the year only to experience a significant mid-year  slump.  For now, however,  it is a positive sign.  I have been especially and uncharacteristically gloomy in my characterization of NH’s economy but there was some little reported good news on that front released last week.  The annual benchmark employment revisions showed that NH has 9,600 more jobs than originally estimated.  I won’t get into why the revisions are necessary and can result in some significant changes in the numbers  but in my very first post in this blog back in October I highlighted the disconnect between the volume of  help-wanted advertising in NH and estimates of job growth in the state.

“In the first ever Trend Lines blog post I begin by asking a basic question:  Could the most recent job growth picture in NH be distorted by numbers that will later be revised?”

I also suggested that growth trends in reported wages and salaries  in the state were also inconsistent with estimated job growth trends. In that post and in subsequent  posts (here and here) and others as well, I talked about a potential “skills gap” as a contributor to the disconnect between help-wanted ads and NH’s reported job growth.  I think a “skills gap” is a contributing factor  but as I argued in my first and subsequent  posts –  my money is on job growth being revised upward.  It is nice to be right but it really doesn’t change the overall theme of NH’s economy- that it continues to under perform relative to states it typically outperforms.  That was also predictable:

“…that the jobs data is wrong and will be revised upward early next year, is real,  but that doesn’t mean the revisions will show NH is again outperforming its neighbors or the nation.  It just means we will look less bad over the past year or so than we do right now.”

Five months later I think that still  sums-up my feelings about the revisions, its good to know we have more jobs but we are still in a growth mode that is too slow.  With the revised job numbers for NH the relationship between help-wanted advertising and reported job growth looks more appropriate.

NH Revised Emp

The revised job numbers also are more consistent with PolEcon’s NH Leading Index which had been signalling stronger employment growth in NH than was first reported.  The revised job numbers are more consistent with the signals provided by the Leading Index.   That may not mean much to anyone but to me it means I won’t have to spend a lot of time re-calibrating the Index and that means a more enjoyable weekend.  Enjoy yours.

Leading index and revised emp

The Lastest 50 State Economic Outlook

February 7, 2013

Back in October I posted about the Federal Reserve Bank of Philadelphia’s leading index for each of the 50 states.  The Fed’s leading index for each state contains the same, six, state and national variables so I think they miss some of key indicators that can affect individual states but they are a great way to quickly compare the trends across states.  It is  also good to get a dispassionate, “outsider’s” view of the direction of every state’s (including your own)  economy.  Below is the latest summary of what each state’s  leading index is saying about the growth prospects over the next six months.

LeadingIndexes1212

Unfortunately, NH is again showing up in the group of states that is expected to lag in economic growth over the short-term.  PolEcon’s NH Leading index contains more NH specific economic indicators than does the Philly Fed’s NH Leading Index but the two indices generally agree on the short-term direction of the NH economy.  Not this time.  PolEcon’s NH leading Index is signalling an uptick in the rate of NH’s employment growth.  As I noted back in October, statistical tests show a stronger relationship between PolEcon’s Leading Index and the rate of NH’s employment growth than the relationship between the Philly Fed NH Index and NH’s employment growth.  I wish I could say I was confident my index was going to be more accurate this time but I can’t.  I do take some comfort in knowing  that whenever I have had the most doubts about the predictive ability of the NH Leading Index it always seems to do the most to confirm its value.

NH Leading Index

Entrepreneurship and Gender Equity

January 16, 2013

I’ve written a couple of times (here and here) about gender equity issues in employment and unemployment.  I have an interest in almost all labor market issues but on this one I have three terrific and personal reasons for my interest.  One of them is a scientist in training and in a few years will be confronting the labor market issues I  examine  here.

My initial hypothesis was that larger businesses in NH would likely have more extensive policies and recruiting  efforts that would result in a higher percentage of women being employed in larger businesses in professional, scientific and technical industries in the state.  These industries include things like legal, architectural, engineering, laboratory, computer programming, accounting and scientific firms as well as veterinary services but not human medical services). As the chart below shows, that is not the case, as the smallest firms have a higher percentage of their employees who are women.   These industries also have the highest percentages of employees (male or female) with at least a BA degree.  Again, as the chart shows, smaller firms had the highest percentage of women among the employees with the highest levels of educational attainment.

Female Emp in Prof and Tech Industries

My new hypothesis is this – I don’t think (or at least I hope) that larger firms have any preference for hiring men over women.  Rather, it is that a higher percentage of the smaller firms in these industries are likely to be women owned and newer businesses started, owned, or managed by women.  I think the fact that the percentage of all women employees at larger firms, who have at least a BA degree or higher is greater than it is at smaller firms suggests that larger firms don’t just hire females predominately for lower-skilled occupations.  Women still represent a smaller percentage of graduates from many professional, scientific and technical programs (although that is changing) and thus present a smaller percentage of the potential workforce for many industries.  For smaller prof./scientific and tech. firms that are started, owned or operated by women,  female employment with the highest levels of educational attainment could, however,  be expected to be higher than at larger firms.

Anyway, that’s my story and until I get more evidence, I’m sticking to it.  More than just my interest as a parent, I think the issue has larger implications for policies to support gender equity and to increase the supply of highly skilled workers.   It may be that promoting entrepreneurship among women is among the best approaches to both.

It Seems You Can’t Turn White Collars Blue

January 8, 2013

Two contradictory trends are occurring in NH’s labor market and as Ricky Ricardo would say “somebody’s got some splaining to do”.   I see no other hands up in the room so I will take a brief stab at it.  The chart below shows that help wanted ads in NH rose modestly this year but the rate of employment growth in the state has been declining.

Help wanted and Emp Growth iin NH

It is easy to rest things on, and to take things off, the top of a flat head so here are a few off the top of mine that could be influencing these trends: 1) It could be that more jobs are being advertised in NH but are for companies with multiple locations – including NH and nearby states (I think this is not likely to be having much affect), 2) advertised jobs are not being filled because there are not enough applicants companies want to hire – “the skills gap” again (I think this is significant based on conversations I’ve had with companies), 3) the job growth numbers in NH could be revised upward with the upcoming benchmark revisions (I think this is likely but it may not be as significant as I thought a few months ago).

Regular readers know I write too often about the skills gap.  I like the issue because it gets at so many issues of fundamental importance to the future of NH’s and the nation’s economy – education and training, k-12 and post-secondary education, young people and their guidance and direction etc.  The skills gap is most often associated with very skilled scientific and technical occupations but in NH at least, any skills gap may be more pronounced in production and skilled “blue collar” occupations.  Based on the volume of  help wanted advertising in the state since the recession, the demand for those occupations has increased significantly compared to management, financial, business, technical and scientific occupations.

Help Wanted by Occup Since Recession

Despite the large percentage increase in help wanted ads in production and skilled blue collar occupations, employment in industries that employ those occupations has grown little.  It may be that there is a lot of ‘churning” in those industries (some businesses hiring and some contracting) resulting in little net employment gain but the anecdotal evidence (I am reluctant to rely on such evidence but it is the best we have at the moment) is that many businesses who would hire production and skilled, blue collar workers are unable to find individuals to fill their positions.

It has been a relatively recent (over the last several decades) transition for NH to a more technology intensive economy that relies less on production and skilled, blue collar labor.  Once the core of the NH economy it has been a long while since NH was seen a a land of opportunity for those who worked with machines and tools (other than just  computers) and once you have moved on  it can be very hard to go back – even when there is a reward for doing so.

The Sun Will Come Out Tommorow

January 3, 2013

I have been uncharacteristically and uncomfortably gloomy in my assessment of the NH economy lately, but I still hold out hope that New Hampshire’s job growth numbers for 2012 will be revised upward early in 2013 based on the volume of help-wanted advertising in the state and reported growth in aggregate wage and salary income in the state.  Even if that doesn’t happen there are encouraging signs that job growth will accelerate.   PolEcon’s NH Leading Index increased this month to a value of 13.0, down slightly from 16.7 the prior month, but it has registered its highest three-month reading since early in 2010.    At least some uncertainty around the  “fiscal cliff” that caused many firms to postpone hiring has been removed.   The U.S. Treasury debt ceiling still needs to be raised this month and a repeat of the last debt ceiling antics could produce another big drop in business and financial market confidence, but overall, the national and NH economies appear poised to see accelerating job growth as 2013 progresses.

Polecon NH  Leading Index

PolEcon’s NH Index of Leading Indicators is a diffusion index consisting of nine state and national indicators of economic activity designed to predict changes in the rate of employment growth in NH.  When index scores are above zero, more of the leading indicators are moving in a positive direction and the NH economy is expanding. The Index has a strong statistical relationship with changes in NH employment, Index scores lead changes in the rate of NH employment growth by 3-6 months.  Using statistical techniques, Index scores can also be converted into a probability that NH will be in  a recession sometime within the subsequent six months.

Leadin Index Components

The Most Important Ideological Debate of 2013

January 2, 2013

It is hard to fix a problem that you don’t  know you have.  That seems to be the case in NH where I still hear “NH has fared better than most states since the recession.”  I disagree and the U.S. Bureau of Labor Statistics is on my side.   Just before Christmas the Bureau of Labor Statistics issued its  monthly report on November employment and unemployment in  the 50 states.  Once again the news was not good for New Hampshire.  Most media reports chose to report that NH’s unemployment rate dropped slightly during the month without noting that the number of jobs located in the state declined in November (John Nolan of the Foster’s Daily Democrat and Rochester Times was a notable exception).

Nov 2011 to Nov 2012 Job Growth

Compared to employment in November 0f 2011,  November 2012 employment in NH was lower by1,700 on a seasonally adjusted basis and lower by 2,500 on a not seasonally adjusted basis.  Only five states have fewer jobs located in their state in November of 2012 than they had in November of 2011.  As I have suggested before, NH’s job growth goes a long way toward explaining why the state’s housing market isn’t seeing the same recovery in prices that appears to be occurring in many other states.

50 state Job Growth Nov 11 to Nov 12

I am hoping that in 2013 policymakers focus much of their debates (ideological or otherwise) on policies that strengthen the NH economy.  I hope that most of those debates encourage the introduction of solid empirical evidence in support or opposition to any proposals (I tried last year but could not find any data or methodology to determine the impact that allowing pistol duels in the statehouse would have on job growth) and are absent the vitriol and ad hominems that characterized so many debates last year.  Policies that can influence job growth can easily accommodate the needs of the two-party system to make the  sort of ideological arguments and distinctions that they feel are needed to influence elections.

Whether job growth is slower now than in the past because employers are not willing to add additional workers (supply side arguments) or because they are not able to find enough or enough qualified workers  (the human capital and “skills gap” argument) is among the most important issues to understand in setting both national and state-level economic policies.  If employers are unwilling to add employees that are readily available,  then the efforts to spur job growth focus more on factors affecting businesses (tax rates, regulations, costs etc.).  If job growth is constrained because employers are unable to find enough or enough qualified workers to fill open positions, then the focus of efforts to spur job growth will be more effective if they look to influence demographic trends, increase the skills of the labor force, and/or better match the skills of workers  to the needs of employers.  In reality this is not an either or question because inadequate attention to the needs of either employers or the workforce will produce sub-optimal economic growth. I’ve tried in this blog to introduce some evidence related to the human capital argument for job growth trends and I will bring some supply side evidence in the future as well.
Ideological or not, respectful and civil or not, recent trends in NH’s job growth and the implications for future growth have to be the first and most important policy debate of 2013.

Hiring by Age: More Evidence of a Skills Gap?

December 10, 2012

I know its a tough labor market for young people and recent college grads, but they still represented a larger portion of new hires in NH in 2011 than would be expected based on the percentage of employment by age in the state.  The chart below shows the age distribution of  employment in NH in 2011 along with the percentage of new hires in the state by age group.   Although job growth has been slow this recovery, the chart still shows that among those who have been hired for a new job (that is the hiring that is not a “call back” of a previously laid-off worker), younger workers make up a disproportionate number of the new hires.

Emp by age

This could be more evidence of, as well as a subset of,  the “skills gap” debate.  Many employers complain that the skills that young workers and recent grads posses don’t match their needs, and this is true for many occupations, but what this data also seems to suggest is that the mismatch between the demands of employers and those seeking work among the existing workforce is even greater than that for younger workers and new entrants to the labor force.  It suggests a bigger problem than just getting kids into the right majors and training programs (although that is a big part of it).  It points to a larger problem of a fundamental change in the types of occupations in demand (or the skills required of the same occupations) as well as a “twist” in the labor market that results in differences in the occupational make-up of industries.  It is a much more difficult , slower, and likely painful process to have the existing workforce adapt to these changes in order to increase their employment prospects than it is to begin with the next generation of workers, although both will challenge future employment and economic growth for some time.

Of course it is possible that employers just prefer younger and perhaps less expensive workers and that is what accounts for their outsized share of recent new hires.  Or it could be a function of the type of industries that were hiring in 2011 (I will be examining this hypothesis).  It may be more comforting to view labor market trends from those perspectives but it won’t get us any closer to taking the personal and policy actions necessary to create greater alignment between the skills of our workforce and the skills needed for a more prosperous economy.


%d bloggers like this: