Archive for the ‘consumers’ category

Price Pressures are Building in the U.S. Economy

August 10, 2018

There is disagreement among economists over how big a threat is rising inflation. A tame consumer price index and modest U.S. wage growth have many economists arguing against further interest rate increases in 2018. But there are signs that higher prices are working their way into the economy. The most obvious example is in goods that are affected by the trade war (skirmish?) between the U.S. and just about every other nation on earth.  Steel, aluminum, lumber, and washing machines are examples that have increased the price of building materials for new homes, laundry equipment, beverages in cans, and some other consumer goods. Even if the self-inflicted harm of a trade war disappears, however, consumers are likely to begin feeling price hikes. So much of what consumers purchase is transported via truck that recent increases in transportation costs (see graphic), unless abated, will soon affect consumer prices.

Truck Transportation Prices

We see this with gasoline price spikes and their resulting impact on grocery prices. Today, strong demand and worker shortages in the trucking industry are dramatically raising the cost of truck transportation services that will eventually work their way into consumer prices.

How Much of a Benefit is Low Oil Prices?

March 7, 2016

Low oil prices have provided an economic windfall to households in New Hampshire and across the nation. Based on actual 2014 energy consumption and expenditure data for NH, changes in 2015 energy prices, and forecasts of 2015 energy consumption (actual data won’t be released for another year), I estimate that businesses and households saved about $1 billion in 2015 as a result of lower oil prices (Figure 1).

NH savings

Households saved over $800 million – largely as a result of lower gasoline prices – and businesses saved nearly $200 million. In 2015 households in NH spent about $665 million less on gasoline than they did in 2014 and about $800 million less than they did in 2012 (Figure 2).
gasoline savings

Here I am talking about the monetary impacts of lower oil prices, the distribution of impacts among states, between business and households, by different income levels, and how increased U.S. oil production is changing the demand for imported oil. While the overall impact is a net positive on the U.S. economy – especially consumers – the net benefits to our nation’s economy have been smaller than many anticipated. This is not a full accounting, I do not consider any environmental implications (I will write about some of those in future posts on carbon emissions, carbon taxes and climate change that are sure to incite the unstable) or the fact that low oil prices make Vladimir Putin only slightly more scary or any number of petroleum states that much less stable.

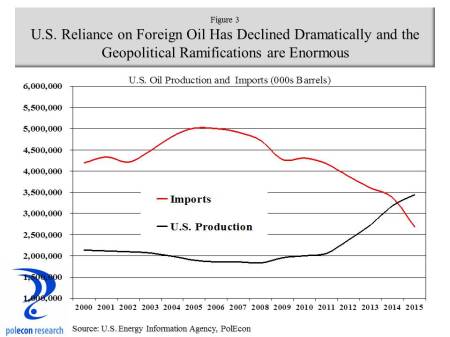
There was a time not long ago when low oil prices would have provided a stronger stimulus to the U.S. economy, as every dollar saved by businesses and individuals as a result of lower oil prices translated into nearly a dollar of benefits to the U.S. economy as more of the dollars saved were dollars not being sent overseas. But today many more of the petro dollars saved are dollars that would have gone to U.S. businesses and workers, reducing the overall net benefits that lower oil prices have on the U.S. economy. Figure 3 shows the dramatic increase in U.S. oil production beginning late in the last decade along with a concomitant decline in oil imports.
production and imports

Regional Impacts

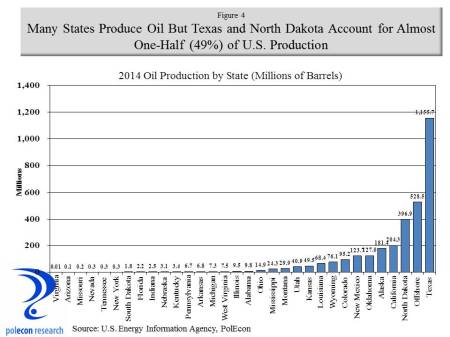
Make no mistake, lower oil prices are a good thing for U.S. economy overall, but the boom in oil and gas production in the U.S. includes states that are relatively new to energy production, spreading the negative impacts of a downturn in energy markets more broadly across the U.S., as well as some states who have gone from very small to more significant energy producers, deepening the negative impacts from low prices in those states. Texas, Oklahoma, Alaska, Louisiana are used to economic disruptions caused by fluctuations in oil prices (although much of Texas is now much more diverse) , North Dakota and other states not so much. Figure 4 shows the volume of oil production in 2014 by state and thus the relative exposure that these state have to fluctuations in oil prices.

state production

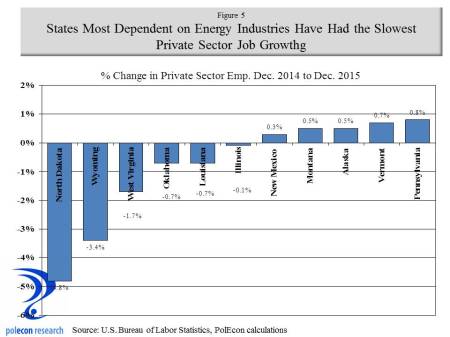
The increase in U.S. oil production was spurred by high world oil prices that made it economically viable to extract oil using more costly methods, as well as improved technologies that made it possible to extract oil that could not be obtained through traditional drilling techniques. A few years ago I worked on an energy project in the Permian Basin of West Texas and Eastern New Mexico that involved enhanced oil recovery (EOR) techniques. At that time the price of oil was around $100 bbl while the break-even price of EOR was approximately $67 bbl. In that environment it is not surprising that a boom in production would occur in areas with even difficult to extract oil reserves. Continued improvements in technology have no doubt lowered the break-even price of EOR below the $67 that it was back in 2012, but probably not as low as the $48 per bbl that was the average price for U.S. crude in 2015, and certainly not as low as the $32 bbl average of January 2016. The sharp decline in oil prices since 2014 is affecting the profitability, production, and employment of energy companies and those that service and supply them. Low oil and gas prices don’t help energy producing states the way they help NH and other non-energy producing states because the benefits of lower oil and gas prices to households and businesses are mitigated by the reduction in investment and employment in oil and gas extraction, transportation, and the industries that support them – including financial industries, professional and technical industries (engineering etc.) and many others. Figure 5 shows states at the bottom of private sector job growth in 2015 – all but Vermont and Illinois are significant energy producing states.
state emp  change

Income Support

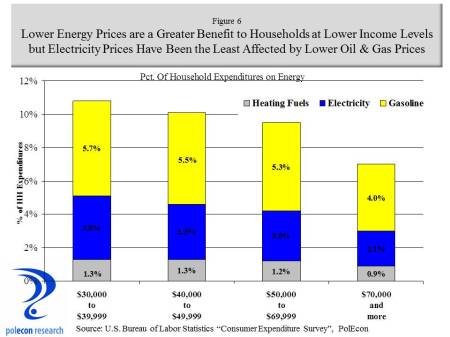
The benefits of lower energy prices on households nationally have been large. Energy spending dropped from 6.1% of total expenditures of households in 2008 to 4.4% through mid-2015. All households benefit from lower energy prices but the benefits are not evenly distributed. Low-income consumers devote a larger share of their budgets to energy and thus lower energy prices provide a greater relative benefit to households lower on the income scale. Data from the Consumer Expenditure Survey of the U.S. Bureau of Labor Statistics show that consumers in the bottom half of the income distribution devoted 10.7% of their budget to energy expenses, while consumers in the top half of the distribution devoted 8.1% of their budgets to energy (the figures are higher in the Northeast where households spends more on heating and much more on oil heat than the national average). To some extent these differences may overstate the benefits of lower energy prices to lower-income households because the largest difference in the percentage of household expenditures on energy by income level is for electricity; lower oil prices have had little impact on electricity prices, but the benefits to lower income households are still signficant. Figure 6 shows the percentage of total household expenditures in the U.S. that are devoted to energy among households in four different income ranges.

exp by income level

Geopolitics

The most important implication of U.S. oil production may be for U.S. foreign policy. Not only are oil imports on the decline as U.S. production has increased, but the sources of imported oil are also changing. Persian Gulf states are a declining source of oil imported in the U.S., while Canada is a rapidly increasing source (Figure 7).

imports by region

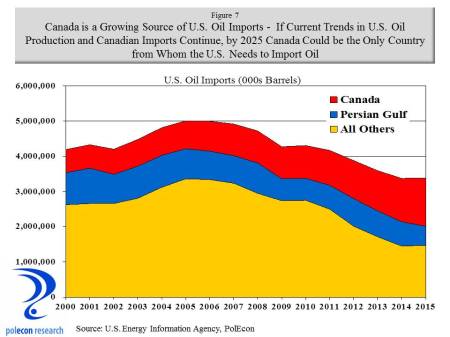
The historical role that concerns about oil supplies have played in U.S. policies toward Persian Gulf states is debatable but a declining dependence on Persian Gulf oil at least offers the possibility that whatever U.S. involvement continues in the region will be less energy dependent. If current trends in U.S. production and imports continue, it is possible that the only country that the U.S. imports oil from in 10 years is Canada. If I have learned one thing from this presidential primary season it is that not all Canadian imports are a good thing. But, I grew up along the Canadian border and I would be pretty comfortable only relying on the great white north to meet our nation’s demand for imported oil.

Improving Household Net Worth and Cash Flow Bode Well for Spending

April 1, 2013

Improvements in the balance sheets and cash flow of households along with continued if not robust improvement in the labor market bode well for consumer spending  as the year progresses, helping the economy overcome the negative impacts of  payroll and other tax increases.

Home equity is a strong driver of the buying power and spending decisions of households.  Home prices are rebounding across the country and even New Hampshire is beginning to show some strengthening according to Core Logic’s Home Price Appreciation Index.  Appreciation in NH remains below a majority of states and well below the 15% suggested by the industry in the state.

January HPI

While home prices are still off from their 2006 peak, the rise in home prices has raised homeowners’ equity $1.6 trillion over the past year. This is the second largest nominal gain on record since 2005 when homeowners’ equity was up $2.0 trillion. In percentage terms, owners’ equity as a share of household real estate rose to 46.6% last year compared to 40.5% in 2011—the previous cyclical peak was 59.6% in 2005—and an all-time record low of 37.3% in 2009.

Private retirement and pension accounts represent a much smaller component of the net worth of households but they are key contributor to households’ sense of  financial “well-being” and a contributor to the “wealth effect” that impacts household confidence and their willingness to spend.

Private Pensions

The equity of homeowners is the largest contributor to the improvement in household net worth but the value of  the private pension accounts of households along with the rise in the value of the stock market are adding to consumer’s willingness to spend.  Lower interest rates, lower levels of debt, and improvements in wage and salary income are also improving the cash flow of households.  In combination, the outlook for consumer buying power and spending in 2013 looks like it could be stronger than the growth in the underlying economy would suggest.

Household Net Worth

E-Commerce’s Small % of Sales Has Big Implications

March 21, 2013

Total retail sales increased modestly last Christmas season (4.0% higher in QIV than in QIV  2011) while e-commerce (Internet) retail sales  increased 15.6% during the same time period.   E-commerce sales are still a relatively small percentage of total retail sales but some of that is a function of the percentage of consumer goods that will never be sold over the Internet (don’t look for free shipping and returns on gasoline or boneless chicken soon).  E-commerce now accounts for about 5.4% of retail sales, a new record.

e commerce sales

E-commerce sales are an interesting issue for a lot of reasons. It portends heavyweight policy battles over the taxation of e-commerce and brick and mortar sales as well as policy debates over taxing the source or destination of sales.  It also has longer-term implications for the demand for commercial real-estate, the usage, mix and look of downtowns, malls, and probably the nature of a good percentage of our socialization and interactions, but that won’t be apparent for some time.   For someone who doesn’t like to shop (and even for those who do), e-commerce essentially reduces the cost (time and travel etc.) of shopping and comparison shopping to near zero, so it has the potential to increase the time available for other activities.   That could be a good thing, but if it reduces the time we spend walking through our downtown or otherwise interacting with our communities so that we can get to know a thousand more people infinitely less well on-line, I ‘m not sure it makes that much of a contribution.   To the upside, e-commerce has given a lot of us yet another  reason not to try-on the clothes or shoes we buy.

The data in the chart above shows that while e-commerce sales dipped during the recession, they continued to increase their percentage of total retail sales.  That means they dipped less than overall retail sales.  There are tremendous long-term implications for the growth in e-commerce and that  prompts more than a few questions in my mind:

  • Are consumers especially motivated to comparison and price shop on-line during recessions or in weaker economic times?  Does a weaker economy convert more sales to e-commerce?  I look at state level data and use quarterly industry earnings data to estimate state-level retail sales in some states and noted that NH’s retail sales fell less than neighboring states during the recession.  A result I attribute, in part, to the 5% or greater savings due to NH’s lack of a retail sales tax, that consumers may be even more motivated to realize during a recession.
  • Can the most attractive elements of e-commerce be combined with brick and mortar retailing to “double the pleasure”.  Which retailer or type is most likely to find the formula?
  • How much different are the demographics of on-line buyers than are those of traditional retailers?  I assume for the most part e-commerce buyers have somewhat higher incomes and are likely to be younger.  If income were the primary difference I would expect that e-commerce sales would probably decline less than total retail sales.  If age is a significant contributor, how much will demographic trends matter?  Its been a while since I’ve been in a mall, have  teenagers forsaken them for on-line social gatherings?
  • How are sales trends affected by differences in the percentage mix  of products sold on-line and at bricks and mortar stores. As an example, furniture stores and home furnishings sales were pummeled during housing market drop and recession and I have to think those items are less representative of e-commerce sales.  Will shopping downtown now mean going to an internet cafe?
  • Is there an e-commerce substitute for “recreational shoppers”?

These are just a few of the questions I will never have time to investigate.  Recent trends are  probably a combination of these factors and more and  no doubt someone who looks and writes about  these trends more thoroughly has answers where I have only questions.  The comment lines are now open.

We Need Better Incentives for Households to Reduce Electricty Consumption

January 14, 2013

Just like the NH and US economies are producing more goods and services with less and less energy content (as measured in BTUs per dollar of gross domestic product), so too is the NH economy producing more goods and services with the same or less electricity content.  As the chart below shows,  over the previous decade the total electricity consumed in NH (in kwhs) increased by just over 7%  while real gross state product increased over 36%.  The result is that electricity content (in terms of khws) per dollar of real NH GDP declined during the decade.

Electricity Consumption and Expenditures in NHl

Conservation and a changing industry mix have gone a long way toward restraining electricity consumption but a steep recession also contributed.  High electricity prices play a role in creating incentives for conservation but as the chart also shows, despite only a 7% increase in electricity consumption during the decade, total expenditures on electricity in NH increased by over 40% while expenditures by residential customers increased by over 50% during the decade.  Unfortunately, in a regulated market that guarantees a rate of return for some producers of electricity and which depends on variable  fuel costs, consumption of electricity and expenditures on electricity do not (for long) show the negative relationship that they do in many markets.  I think this tends to discourages household conservation efforts because they see less evidence of the payback from their efforts, even less so than say in oil and gasoline markets.  With gasoline or heating oil markets an individual or household can take steps to reduce consumption that yield tangible results in terms of reducing energy expenditures.  Reducing oil or gasoline consumption won’t always reduce absolute expenditures, as in the case of very dramatic price spikes seen in the recent past, but consumers at least see (and feel) a direct impact on their cash outlays as a result of their conservation or consumption behaviors.  But how do financial incentives for conservation affect  consumers of electricity when guaranteed rates of return allow for electricity prices that offset the impact on expenditures of their conservation efforts?   I think they produce what appears to be happening now in NH, the conservation efforts transform into just a  quest for lower prices.   Electricity consumers seek lower-cost providers of electricity who may not offer ceilings on future prices but who also don’t set a floor on prices because of guaranteed returns or because a shrinking base of customers requires guaranteed returns be paid for by fewer customers.  I am all for lower electricity prices but I get to call myself an environmentalist when I support incentives for conservation.  Such incentives will work best when they don’t yield only intermittent or temporary benefits

I don’t know whether the proposed Northern Pass Transmission Project (NPT) will actually result in lower prices for wholesale electricity or not.  I’ve seen conflicting studies from proponents and opponents (by way of disclosure I conducted a study of the NPT employment impacts for competitors of the companies planning NPT but I did not examine impacts on electricity prices nor do I have any contracts or agreements with anyone opposing or competing with NPT).  I do know that NH spent an estimated $1.616 billion on electricity in 2010 (the last year for which data is available from the U.S. Energy Information Agency).

NH Electricity Expenditures

That means if proponents of NPT are correct, and wholesale electricity prices in NH are reduced by about $25 million, and that wholesale price results in a similar reduction in retail electricity prices (?), then electricity expenditures in NH would be about 1.5% lower then they otherwise would be.  Whether illusory or not, given the consumption and expenditure trends lines above, it is hard to see that this impact on wholesale electricity prices will have much of an impact on the high cost of electricity in NH.

Purchasing Power of Households Should Boost Consumer Spending

November 30, 2012

Households are arguably better positioned to increase their spending than at any time over the past decade. I define household purchasing power, in the aggregate,  as a combination of income and household financial obligations.  Household financial obligations include all debt obligations as well as things like housing rental costs, auto leases, insurance and property tax payments.   A combination of low interest rates that reduce the cost of debt for households as well as reductions in the use of credit and households paying down debt since the recession, have all combined to lower the financial obligations of households (in the aggregate) as a percentage of household disposable income.  Real wage and salary income is also increasing (even if not for all individual households).  In combination, the reduction in financial obligations and rising aggregate income should result in increasing consumer expenditures.  A  lack of conviction in the economic recovery, a decline in home values that affect consumer’s sense of financial well-being, and higher energy prices over the past year have all helped restrain consumer confidence and spending.  But energy prices are falling and home prices (in most areas) are rising.  As hiring (and thus wage and salary growth) accelerates, the stage is set for a long-awaited burst of consumer spending.

Consumer Health

Measuring Consumer Financial Distress, are We Really Better Off Today?

November 15, 2012

The Consumer Distress Index is a quarterly comprehensive picture of the average American household’s financial condition.  The index is calculated for the nation and each of the 50 states.  The index measures 5 categories of personal finance that reflect or lead to a secure, stable financial life—Employment, Housing, Credit, Household Budget and Net Worth.   It is calculated by CredAbility,  a  nonprofit credit counseling service, uses 65 data points using public and private data to measure consumer financial distress.  According to their Consumer Distress Index, only 12 states have lower levels of financial distress among households than does New Hampshire.    Lower scores indicate higher levels of financial distress.  The chart below compares NH with the U.S. average.    It shows that, by this measure, NH households are about as financially well-off as they were just prior to the recession, but that the financial health of households has generally deteriorated since the second-half of the last decade.  Not surprising given the increases in employment insecurity and decreases in the value of most households largest asset, their home.

 CredAbility categorizes distress scores using the following:

Less than 60 Emergency / Crisis
60 – 69 Distressed / Unstable
70 – 79 Weakening / At-Risk
80 – 89 Good / Stable
90 and Above Excellent / Secure

By that scale NH, with a score of 75.68 is “At-Risk”, while the U.S. average household is bordering on “unstable/distressed” with a score of 70.48.   According to this measure, NH households are about or just slightly below where they were prior to the recession in terms of financial distress, while the average U.S. household is in more financial distress than they were prior to the recession.  I don’t know how much concurrent validity this measure has but I do know that if I had used it, instead of a state-level “misery index” (the sum of unemployment and inflation) to predict the outcome of the election it would have been a less  accurate predictor of election results.


%d bloggers like this: