Archive for the ‘Energy’ category

Natural Gas Prices Can’t Rise Soon Enough

June 29, 2016

Natural gas prices have dropped sharply over the past two years and while the prospect of paying higher prices for energy is not appealing, unless prices rise soon, the prices we pay later are likely to be much higher and for much longer than currently forecast.  The chart below shows the decline in natural gas prices over the past two years.  In response,  a steady rise in production of U.S. natural gas stagnated and began declining over the past year.             1

One impact of very low energy prices is a U.S. energy industry that is in financial shambles, devastating industries that support oil and gas extraction and threatening the financial institutions that lend to energy-related industries along the way.    In the first quarter of 2016 the largest shale gas producer in the world had negative cash from operations.  Most other large producers similarly had revenues from the sale of oil and gas that didn’t cover operating costs much less capital expenditures like drilling and completion. Sympathy for energy companies isn’t expected and won’t be forthcoming but the result of consistently low energy prices is predictable, lower U.S. oil and gas production.  The longer prices for natural gas remain very low, and the smaller and financially weaker the industry gets, the less likely production will be able to ramp-up as prices rise (as they most surely will) and that means even higher prices in the future and for a longer period of time.

The Importance of Shale Gas

The U.S. is increasingly dependent on shale gas. Conventional natural gas production appears to be in terminal decline as fewer producers are drilling those wells.  Shale gas now represents more than half of all natural gas produced in the U.S. (and rising).  Production of shale gas will have to continue to increase just to compensate for the decline in the production of conventional natural gas but recently shale gas production has also begun to decline.  2

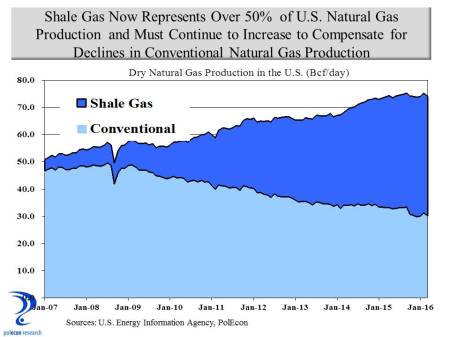
The Marcellus and Utica shale gas regions (closest to NH) are relatively new sources of shale gas (production began in the mid-2000s).  They, Marcellus in particular, are the  kings of shale gas in the U.S..  Not surprisingly they have, on average, the lowest cost-of- production of any shale gas region in the country.  As a result, production in those regions has been maximized and the percentage of U.S. shale gas that comes from the Marcellus and Utica shales is now almost 50 percent.  That percentage probably would be even higher except for pipeline capacity that limits movement of gas from the region.

3

But even in these lower cost-of-production regions the lowest cost producers have a breakeven price of about $3.50-$4.00/MMBTU (the average of all producers in the regions is higher).  Meanwhile natural gas prices in the U.S. have been below $3.00 since 2015 and below $2.00 in 2016.  The average production costs in shale regions that have been producing longer is considerably higher (from about $5.00/MMBTU to more than $6.50).  The impact of natural gas prices on the production of increasingly important shale gas is best understood by looking at the impact that prices have had on different shale gas producing regions across the country.  The chart below shows changes in production from each shale play’s peak production to May of 2016, when spot natural gas prices were at $1.92/MMBTU.  As economics would predict, the chart shows that production declines were greatest in the highest production cost regions and smallest in the lowest cost Marcellus and Utica Shale regions. On a percentage basis declines in production appear even more dramatic.  Production has declined 50 percent  in the Haynesville shale region of Louisiana and Texas since peak production occurred there in 2012.  The Barnett (Texas) and Fayetteville (Arkansas) shale regions experienced production declines of 39 and 26 percent respectively since 2012.  In contrast the lower cost Marcellus (0.4%) and Utica (2.0%) experienced minimal declines in production and only in 2016 when spot prices were under $2.00/MMBTU.

4

But here is the thing, like all gas and oil producing regions, the longer the Marcellus and Utica shales produce gas the more likely production cost will rise as increased withdrawals require production to move from core areas of the shale play to more marginal areas of production.

Prices and Costs Matter

Only in a fantasy world will U.S. production of natural gas continue to increase for decades with prices remaining near or below breakeven costs.  In the real world prices and costs matter.  I am a fan of natural gas and believe increasing availability in New England will benefit consumers and businesses but thinking that natural gas can be simultaneously cheap, abundant, and profitable defies the rules economics.

Unfortunately I think the U.S. Energy Information Agency is contributing to a fantasy by suggesting an almost unlimited supply of natural gas at low prices in their forecast of natural gas production and prices contained in the EIA’s  2016 Annual Energy Outlook (released in May).  I respect the work of the EIA and regularly rely on the data they produce but this forecast seems to lack a fundamental grounding in economics.

5

At $6.00/MMBTU (in 2015 dollars)the U.S. will have an ample supply of natural gas for decades.  At $5.00 (not reached until 2024 in the EIA forecast scenario) production is unlikely to increase by 50 percent as the EIA forecast suggest. At prices below $3.00 for long, as is the current case, production will decline significantly and supply shortfalls will require supplementing U.S. production with ever larger withdrawals from storage, increasing imports (questionable if that is possible) and/or  a reconsideration of the exporting of natural gas.  It is important to note that shortfalls in production don’t mean there won’t be enough natural gas, there is ample gas in storage to cover shortfalls for a while but prices will rise quickly as more gas is withdrawn from storage.  Rising prices should prompt increases in production but things may be different this time, depending on how soon prices rise.  The industry is smaller, financially weakened,  and unlike a few years ago capital, as well as workers who were forced to leave the industry as it shrank, may not be as readily available to ramp up production as prices rise.

As we know too well from experience, natural gas supply shortfalls have more dramatic and especially harmful impacts on New England.  New Hampshire and the rest of the country would be better off with a modest rise in natural gas prices now rather than face supply shortfalls and much higher prices in future years.

A Pyrrhic Victory for Pipeline Opponents

June 2, 2016

Another energy project has been scuttled that could have provided some relief to New Hampshire and New England households and businesses who are paying among the highest prices for energy of any state in the nation. I believe the project would also have contributed to the important goal of reducing carbon emissions in NH and New England (more about my support for reducing carbon emissions and some controversial policies to accomplish that in a future post).  No doubt any proposed energy project is better when forged and tempered through a process of public review and debate.  But the withdrawal of proposed wind energy projects, and more recently the Northeast Energy Direct (NED) natural gas pipeline project, as well as the difficulties encountered by some solar projects in the state, question how committed many residents and some policymakers in NH are to finding solutions to an energy climate that is widely recognized as detrimental to households, businesses, and the NH economy.  As opponents of  pipeline, wind, and solar projects claim another “victory” in NH, an admonition given to Pyrrhus, a Greek general and ruler of Epirus comes to mind.  After a costly victory over his Roman enemies by Pyrrhus, the Greek philosopher Plutarch reportedly told Pyrrhus that another, similar “victory” would ruin him.  If the “ruin” that could occur only affected the combatants in NH’s  energy infrastructure battles, instead of the 1.4 million non-combatant “energy civilians” in the state, Plutarch’s warning might be useful.  But there are no “generals” and no real leaders or statesmen and stateswomen battling NH’s energy constraints and so the casualties of our state’s inability to take control and direct its energy future will be most broadly spread across the state’s population.

This post highlights some of my calculations of the costs to NH of the defeat (or victory as opponents would argue) over the Northeast Energy Direct natural gas pipeline proposal.  To begin, let’s reiterate the cost disadvantages faced by consumers of electricity in NH.  The chart below shows that through 2014, residential and commercial electricity customers paid, on average, about 35 percent higher rates than the national average, while industrial customers paid a whopping 70 percent higher rates than the national average.

energy prices

The NED Project’s Impact on Natural Gas and Electricity Prices

Natural gas prices have been lower in recent years as a result of increased U.S. production, largely from the Marcellus and Utica shale formations in  Ohio and Pennsylvania.  But as I noted in this post, a lack of pipeline capacity precludes NH and New England from realizing the full benefits from declining natural gas prices.  The increased supply of natural gas from nearby sources enabled by the Northeast Energy Direct project would impact natural gas prices in NH and New England.  Price reductions would result in direct savings to residential, commercial, and industrial consumers of natural gas and would also result in electricity prices that are lower in NH than without the Northeast Energy Direct project. New England’s wholesale power prices are closely related to natural gas prices because of the region’s dependence on gas-fired power generation capacity. By reducing spot prices for natural gas in New England, the NED Project will have a direct impact on New England’s wholesale power prices.

At least eight separate studies have forecast lower natural gas prices in New England resulting from an increase in pipeline capacity into the region.  Even one study from the Massachusetts Attorney General’s Office, while suggesting an increase in pipeline capacity to New England isn’t needed to assure reliability of electricity supplies in the region (inaccurately I believe and contrary to reports by others, including the operator of the New England Energy grid), recognizes that increased pipeline capacity would result in lower regional natural gas prices.

 There is a range of estimates of the price impacts from an increase in natural gas supply to the region. My estimates of energy cost savings in NH use one of the more conservative estimates of the price impacts of increased supplies to the region as documented in a study  by ICF International. I used historical data on both natural gas and electricity consumption by sector (residential, commercial, industrial)  in NH from the U.S. Energy Information Agency (EIA) as well as forecasts of future consumption based on the EIA’s regional forecast for growth in natural gas and electricity consumption and applied ICF natural gas and electricity price reduction estimates to consumption forecasts in NH to estimate savings to customers in the state that would result from the operation of the NED pipeline.  In the initial full-year of pipeline operation I estimated the savings to natural gas and electricity consumers in NH to be $165.5 million.  The breakdown of saving by source and sector is presented below.  Savings represent about 3.4 % of the 2014 energy expenditures of NH residential consumers, 6.5% of commercial sector energy expenditures, and 8.9% of the energy expenditures of industrial consumers.

savings by sector

 Using the same sources and methods, I estimate the 10 year energy cost savings to NH natural gas and electricity consumers  would be just under  $2.2 billion in nominal dollars as a result of the Northeast Energy Direct project.

10 years savings

Additional Benefits of Increased Regional Access to Natural Gas

There are other potential benefits from NED that have been less talked about.  Much of NH has limited or no access to pipeline natural gas from local distribution companies.  The lack of access to natural gas increases energy costs for households and businesses in many regions the state.  In particular, lack of access increases the economic disadvantages currently faced by most rural regions in the state.   Natural gas is most available in the populated regions of Southern NH closest to regional pipelines and the lateral pipelines operated by local utilities who purchase natural gas from the regional pipeline operators.  The proposed NED pipeline would have passed through a portion of the state where the economy has lagged for some time and regions that could most benefit from access to pipeline natural gas.  The NED would increase capacity but local utilities would have to add lateral pipelines to serve communities, households and business in places like Keene, Claremont, Cheshire, Sullivan and Grafton Counties.

Along with extremely high electricity prices for industrial consumers relative to the U.S. average, the lack of access to natural gas is a significant disincentive to operating a manufacturing facility in much of New Hampshire, as nationally, natural gas accounts for 40 percent of the purchased energy of manufacturers on a BTU basis.  There is anecdotal evidence that manufacturers nationally are starting to react to lower natural gas prices by planning to open new facilities in the United States. There are other influential factors, including rising employment costs overseas, but those industries for which natural gas is an important input are anticipating an advantage of locating their operations in the U.S..  Cheshire and Sullivan Counties are among the most manufacturing dependent regions in the state and access to utility natural gas would especially benefit communities in those regions.  The chart below presents location quotients which represent the concentration of manufacturing employment in each NH county relative to the concentration of manufacturing employment in the U.S. overall. A location quotient of 1.00 indicates a region where the concentration of manufacturing employment is identical to the concentration of manufacturing in the the U.S. economy overall.  Location quotients above about 1.20 suggest counties where manufacturing is especially important to the regional economy.  Shaded bars represent counties through which the NED project would pass. The NED would not pass through Sullivan County but its proximity would make lateral access to gas from the pipeline feasible.

manufacturing LQ

Increased natural gas supplies and lower prices will be especially helpful to smaller manufacturing firms which face higher prices in New England but also face larger natural gas price differentials relative to larger manufacturers than anywhere in the country.  High prices and larger price differentials create a strong disincentive for new and emerging manufacturing firms to operate in New Hampshire and may be contributing to an “aging” in the manufacturing sector in the state.

gas prices to manufactures

Access to natural gas would also benefit households. Just under 20 percent of households in New Hampshire use pipeline natural gas for heating and another 13 percent use bottled gas but there are large regional variations in the availability of natural gas for heating.  Again, regions of the state that are considered economically disadvantaged, in most cases, have the least access to pipeline natural gas.  Access to pipeline gas won’t guarantee a reduction in disparities in the economic performance of various regions of NH but it would help households and manufacturers in regions where the economic performance has lagged.

home heating in NH by source

The savings for households heating with pipeline natural gas is substantial. The table below shows the average cost differential in annual heating costs between housing units heated with pipeline natural gas and other sources.  The difference between pipeline natural gas heating and fuel oil – the largest source of home heating fuel in NH – averaged over $890 annually between 2010 and 2014. By lowering natural gas prices the differential between homes heated with natural gas and other sources (other than solar) are likely to widen.  The NED would  increase opportunities for more communities, regions and more homes to be heated with natural gas in New Hampshire, amplifying the potential savings estimated here for NH households and the NH economy associated with lower natural gas prices.

Table copy

Factoring the impacts of the NED project on natural gas prices and disposable income for  residential consumers (and not including the impacts on commercial and industrial consumers)  I estimate that an additional 5,300 jobs would have been created in the first 10 years in response to the energy cost savings to households from the NED project.  When the impacts on industrial and commercial consumers are considered the potential benefits of the project become even clearer.

Disclosure

I originally prepared more detailed estimates (than in this post) in a report I did for the proposed NED project.  I write this blog (when I have time) because I enjoy researching and writing about topics that interest me, not to advance client interests. I think the report contained some good analyses and now that the NED proposal has been withdrawn and the company is no longer a client, I don’t feel conflicted writing about it here.  The success or failure of the NED project had no impact on the compensation I received. The report addresses energy issues in NH that I have been writing about since long before my work for the NED project. It examines the usual economic impacts from the construction phase of the project but more importantly potential longer-term impacts of the project.  The report also examines controversial topics such as potential impacts on tourism activities as well as fiscal impacts of the project.  The report can be viewed here. Because the report was paid for by the NED project owners, critics will dismiss some or all of the findings.  But a report that is paid for only means that its author(s) has some “skin in the game.” In a small state, and especially in NH, anyone who produces work that distorts findings or misleads policymakers won’t be offering services of  value and won’t be working in the state for long.  On the other hand, anyone without “skin in the game” or some compensated interest is pretty much free to make any claim without evidence, present any data, or any “analysis” regardless of its accuracy, without concern for the impact that it has on their business or professional reputation. I am not arguing that any information brought to policy debates that isn’t paid for has no value or is necessarily inaccurate or misleading, just that information that is not paid for by some interests is not is inherently or by definition more accurate or relevant than work that is paid for – there should be no “halo effect” for information entered into important policy debates simply on the basis of whether or not compensation was involved – compensated or not, information entered into the debate is provided by a party with a particular interest in the issue.  The quality and accuracy of the analysis should determine its merits.  I like to think that the ultimate test of the quality of an analysis is whether those who produced it will be around and willing to answer for its accuracy or inaccuracy when the time comes when that can be determined.  I don’t think my analyses (or forecasts) are wrong that often but when they are I am available to answer to policymakers and others for it.  I don’t think I would have had to answer for my my analysis of the impacts of the NED.

How Much of a Benefit is Low Oil Prices?

March 7, 2016

Low oil prices have provided an economic windfall to households in New Hampshire and across the nation. Based on actual 2014 energy consumption and expenditure data for NH, changes in 2015 energy prices, and forecasts of 2015 energy consumption (actual data won’t be released for another year), I estimate that businesses and households saved about $1 billion in 2015 as a result of lower oil prices (Figure 1).

NH savings

Households saved over $800 million – largely as a result of lower gasoline prices – and businesses saved nearly $200 million. In 2015 households in NH spent about $665 million less on gasoline than they did in 2014 and about $800 million less than they did in 2012 (Figure 2).
gasoline savings

Here I am talking about the monetary impacts of lower oil prices, the distribution of impacts among states, between business and households, by different income levels, and how increased U.S. oil production is changing the demand for imported oil. While the overall impact is a net positive on the U.S. economy – especially consumers – the net benefits to our nation’s economy have been smaller than many anticipated. This is not a full accounting, I do not consider any environmental implications (I will write about some of those in future posts on carbon emissions, carbon taxes and climate change that are sure to incite the unstable) or the fact that low oil prices make Vladimir Putin only slightly more scary or any number of petroleum states that much less stable.

There was a time not long ago when low oil prices would have provided a stronger stimulus to the U.S. economy, as every dollar saved by businesses and individuals as a result of lower oil prices translated into nearly a dollar of benefits to the U.S. economy as more of the dollars saved were dollars not being sent overseas. But today many more of the petro dollars saved are dollars that would have gone to U.S. businesses and workers, reducing the overall net benefits that lower oil prices have on the U.S. economy. Figure 3 shows the dramatic increase in U.S. oil production beginning late in the last decade along with a concomitant decline in oil imports.
production and imports

Regional Impacts

Make no mistake, lower oil prices are a good thing for U.S. economy overall, but the boom in oil and gas production in the U.S. includes states that are relatively new to energy production, spreading the negative impacts of a downturn in energy markets more broadly across the U.S., as well as some states who have gone from very small to more significant energy producers, deepening the negative impacts from low prices in those states. Texas, Oklahoma, Alaska, Louisiana are used to economic disruptions caused by fluctuations in oil prices (although much of Texas is now much more diverse) , North Dakota and other states not so much. Figure 4 shows the volume of oil production in 2014 by state and thus the relative exposure that these state have to fluctuations in oil prices.

state production

The increase in U.S. oil production was spurred by high world oil prices that made it economically viable to extract oil using more costly methods, as well as improved technologies that made it possible to extract oil that could not be obtained through traditional drilling techniques. A few years ago I worked on an energy project in the Permian Basin of West Texas and Eastern New Mexico that involved enhanced oil recovery (EOR) techniques. At that time the price of oil was around $100 bbl while the break-even price of EOR was approximately $67 bbl. In that environment it is not surprising that a boom in production would occur in areas with even difficult to extract oil reserves. Continued improvements in technology have no doubt lowered the break-even price of EOR below the $67 that it was back in 2012, but probably not as low as the $48 per bbl that was the average price for U.S. crude in 2015, and certainly not as low as the $32 bbl average of January 2016. The sharp decline in oil prices since 2014 is affecting the profitability, production, and employment of energy companies and those that service and supply them. Low oil and gas prices don’t help energy producing states the way they help NH and other non-energy producing states because the benefits of lower oil and gas prices to households and businesses are mitigated by the reduction in investment and employment in oil and gas extraction, transportation, and the industries that support them – including financial industries, professional and technical industries (engineering etc.) and many others. Figure 5 shows states at the bottom of private sector job growth in 2015 – all but Vermont and Illinois are significant energy producing states.
state emp  change

Income Support

The benefits of lower energy prices on households nationally have been large. Energy spending dropped from 6.1% of total expenditures of households in 2008 to 4.4% through mid-2015. All households benefit from lower energy prices but the benefits are not evenly distributed. Low-income consumers devote a larger share of their budgets to energy and thus lower energy prices provide a greater relative benefit to households lower on the income scale. Data from the Consumer Expenditure Survey of the U.S. Bureau of Labor Statistics show that consumers in the bottom half of the income distribution devoted 10.7% of their budget to energy expenses, while consumers in the top half of the distribution devoted 8.1% of their budgets to energy (the figures are higher in the Northeast where households spends more on heating and much more on oil heat than the national average). To some extent these differences may overstate the benefits of lower energy prices to lower-income households because the largest difference in the percentage of household expenditures on energy by income level is for electricity; lower oil prices have had little impact on electricity prices, but the benefits to lower income households are still signficant. Figure 6 shows the percentage of total household expenditures in the U.S. that are devoted to energy among households in four different income ranges.

exp by income level

Geopolitics

The most important implication of U.S. oil production may be for U.S. foreign policy. Not only are oil imports on the decline as U.S. production has increased, but the sources of imported oil are also changing. Persian Gulf states are a declining source of oil imported in the U.S., while Canada is a rapidly increasing source (Figure 7).

imports by region

The historical role that concerns about oil supplies have played in U.S. policies toward Persian Gulf states is debatable but a declining dependence on Persian Gulf oil at least offers the possibility that whatever U.S. involvement continues in the region will be less energy dependent. If current trends in U.S. production and imports continue, it is possible that the only country that the U.S. imports oil from in 10 years is Canada. If I have learned one thing from this presidential primary season it is that not all Canadian imports are a good thing. But, I grew up along the Canadian border and I would be pretty comfortable only relying on the great white north to meet our nation’s demand for imported oil.

A Crisis of Our Own Making

December 29, 2014

Increased shale gas production as well as a December that is on pace to be the ninth warmest nationally since 1950 has natural gas prices in the U.S. plummeting by 18% in the last three months. Natural gas futures for January delivery fell to $3.144 per million BTU on the New York Mercantile Exchange. These all suggest that a crisis in the New England energy market caused by natural gas price spikes will be less than many predicted this winter.

To be clear, to this point the New England energy “crisis” has largely been a winter phenomenon. The chart below shows the weighted average price of natural gas for electricity generation in New England and the U.S. It shows, natural gas prices for electricity generation are roughly the same in New England and the U.S. with the exception of the winter months, when increased demand for home heating along with the region’s increased reliance on gas-fired electricity generation combine to exceed the capacity of the limited natural gas pipelines in the region. The result is a limited supply and exceptionally high natural gas prices for power generation in the region. As the chart shows, the premium (over average U.S. prices) paid for natural gas by New England power producers has increased each of the past several winters. Abundant supplies and lower prices nationally and a winter forecast of 11% higher mean temperatures compared to the Winter of 2013-14, will lessen but not eliminate natural gas issues or the larger issue of longer-term energy production in the New England region.
Cost of nat gas for generation

The chart below graphically depicts perhaps the most fundamental problem confronting the New England energy market, one that currently prevents the region from fully realizing the benefits of our nation’s booming production of natural gas. The chart highlights the dearth of natural gas pipeline capacity in the New England region compared to most other regions, including much more sparsely populated regions of the country.

ngpipelinesThere is a reason the chart shows a concentration of pipelines in Ohio, West Virginia, Pennsylvania, and other nearby (to New England) Eastern states. These states currently produce about 40% of the nation’s shale gas but they promise to produce an even greater percentage of the nation’s gas in the future. Together, these states (along with small amounts from states near them) hold over 60% of the proved reserves of shale gas in the entire U.S. according to the U.S. Energy Information Agency. Unfortunately, the chart also shows that the increasing number of pipelines emanating from the region don’t make their way into New England. When the U.S. was more at the mercy of the exigencies of the world’s energy suppliers than it is now, New England had someone to blame for its energy disadvantages. With an emerging abundance of natural gas so close by, it is more appropriate to ask ourselves why we don’t benefit from the boom in nearby production.

shale gas productionNew England is not a region that produces its own fossil fuels but few areas of the country do and they still manage to avoid the sort energy “crises” that periodically plague New England. To the extent that there is an energy “crisis” we have nothing or no one to blame but ourselves. Natural gas is generally more expensive in New England but not always for electricity generation, except during a few months of the year when pipeline constraints are the culprit. New England is “retiring” older “base-load” power plants but so are many other regions – seven coal-fired power plants that I know of in Ohio and another five in Western Pennsylvania alone. But these are also states where new gas fired power plants or other generating facilities are being built to replace them and neither of these regions is straining their natural gas pipeline capacity by adding new, gas-fired power plants. I have done studies for three new gas-fired power plants in Ohio in recent years and although subject to just as much regulatory and public scrutiny, none of the facilities faced the kind of parochial opposition characteristic of most proposed projects in New England. I have also done work on a wind energy project in New Hampshire and it faced as much or more opposition as would any fossil fuel generating project. In New England it seems, any energy project with a public benefit is seen as synonymous with trampling some individuals’ rights.

Whatever the extent of the looming energy crisis in New England it is of our own making. If you don’t want renewable energy production (wind, solar, hydro etc.), gas-fired power plants and the pipelines needed to support them, or any other power producing facilities built, you have no right to complain about the availability or cost of energy in the region. Personally, I would like to see more renewable energy produced in New England and New Hampshire but that doesn’t mean we should refuse the benefits from a greater supply of natural gas. If we do, we will only put ourselves at a greater energy disadvantage than we already face. There are many reasons (aesthetic, environmental, etc. technical) why renewables are not a more favored option for generating electricity in the U.S. but most of the arguments in opposition are based on costs. Too often these arguments are made by ideologues, vested interests, and others with an agenda, most of whom have no idea of how to measure the true cost (levelized cost of energy or LCOE) of production by different generation sources or the hidden as well as direct subsidies provided to each.

Despite highlighting the increase in natural gas production this is not a post about the merits of hydraulic fracturing. In the coming years the benefit/cost calculus of “fracking” will be refined. This post is about whether New England will realize any of the benefits that result from an increasing supply of natural gas in the country. I have written before that I do not believe energy prices are the root cause of New Hampshire’s recent slower economic growth (we have had high relative energy prices during the state’s boom periods and New Hampshire is producing more goods and services with a lower energy content per dollar of gross state product than ever before). But even if not a savior, a more stable and abundant supply of energy resources at lower prices would have real economic benefits. Whatever your views of its merits, there is little doubt about the impact of the boom in shale oil and gas production on U.S. energy independence, it will no doubt alter the economic, fiscal and the international geo-political landscape of the country. In ten years it is quite possible that the only nation from whom the U.S. imports oil is Canada. Whether the shale oil and gas boom also alters the prospect for NH’s energy and economic future is less certain but is almost entirely within our control.

To Divest or Not to Divest Electricity Generation

April 9, 2014

Whether or not New Hampshire’s largest electric utility should divest its generating facilities is a hot topic again. The NH Public Utilities Commission issued a preliminary report last week which concluded that it is in the economic interests of PSNH’s retail customers for the company to divest its generating assets. The report was less sanguine about the economic impacts on customers not purchasing electricity from PSNH, but that depends on how the stranded costs are allocated in any divestiture.

“Staff continues to believe that over the long term, PSNH’s default service rate will be substantially higher than market prices resulting in continued upward pressure on default service rates. Based on La Capra’s forecast of wholesale prices in New Hampshire and adjusted for retail, Staff’s rate analysis indicates that PSNH’s default service customers would be better off under a divestiture of the PSNH assets if the stranded costs were recovered from all customers. Customers who do not receive default service from PSNH, however, would see rate increases through the imposition of a stranded cost charge. While we recognize the volatility in today’s energy markets, the value of PSNH’s “hedge” will likely diminish over the long term and will continue to be at risk due to potential environmental legislation.”

There are also smart and well-meaning people in New Hampshire who argue that that PSNH’s generating assets provide a valuable ‘hedge” given the volatility of fuel (primarily natural gas) prices and the impending retirement of several regional electricity generating facilities. But the value of that hedge depends, in part, on the price paid for it. This winter’s cold snap and concomitant spike in natural gas prices are times when the PSNH hedge did provide some benefits. But even in those instances, the net electricity generated by PSNH was below what it was in the early and mid-2000s (the latest available data is for January of 2014 so this may change with February and March data). The figure below shows the capacity utilization of PSNH’s coal-fired generating units on a monthly basis during three separate time periods. Capacity factors are the ratio of net electricity actually generated to the total potential electricity that could be generated by a facility (for this analysis I used the average of winter and summer coal-fired capacity for each facility -Merrimack and Schiller stations – rather than the nameplate capacity).

Monthy capacity
The chart shows that from 2004 to 2009, PSNH’s coal-fired generating units were primarily ‘baseload” generators, operating at 60% of capacity or higher. I have previously written about how electricity gets sold into the regional market and which generators will provide that electricity (which determines their capacity utilization) so I won’t cover that again here. Baseload generating units typically operate 24 hours per day year-round baring maintenance outages. At the other end of the spectrum are peaking generators, which mainly operate when hourly electricity load demand is at its highest (think the hottest summer and coldest winter days). Intermediate (or cycling generating units) operate between base load and peaking generators, varying their output to adapt as demand for electricity changes over the course of the day and year. After 2009 the decline in natural gas prices along with higher generating costs, including environmental, associated with PSNH’s coal facilities have resulted in the price at which it can supply electricity to the regional grid being higher than many other generators. As long as their generating cost remain higher, except for times of peak demand, limited capacity by other generators, or when events like the spike in natural gas prices occur, PSNH’s coal-fired units will produce little electricity for sale to the regional grid. During 2013 alone, there were six months when the coal units operated at less than 10% of capacity. PSNH’s coal-fired units have gone from baseload, to intermediate generators and as the chart below shows, when averaged over 12 months, they are looking a lot more like peaking units. Whether this pattern will continue is the heart of the debate over whether PSNH should be required to divest its generating assets.
Annualized generation
It becomes a lot harder to amortize the costs of generating units as their capacity utilization is lowered. There may be times when the hedge provided by PSNH’s generating assets provides a benefit and that would be truer if the units were baseload generators. But even with the extremes of this winter’s cold, price spike in natural gas, and high demand for electricity, the chart above shows, over the course of a year, the facilities have moved from baseload generators, to intermediate, and are trending toward peaking units. The NH Public Utilities Commission, its consultants, and a lot of other knowledgeable people think that, despite current market conditions and the uncertainties surrounding regional generating capacity and natural gas supply and price, these trends will continue.

Energy Prices Won’t Be Our Savior

March 24, 2014

For as long as anyone can remember New Hampshire (and most of New England and the Northeast) has had high energy prices compared to most other states.  We may narrow the gap some but as sure as tomorrow will be Tuesday, compared to most other states and regions of the country, our energy prices will be higher. There are a number of reasons for that and they can’t be adequately covered here so for now let’s move on to the real concern of this post.  Many will disagree with me about the prospects for relative energy costs in the state but even if I am wrong, and NH and New England could somehow be truly energy price competitive with the rest of the country, we are likely to be very disappointed in the resulting economic benefits.  I am all for lowering energy prices and doing whatever we can do to accomplish that.  Reducing energy costs will give households more discretionary income, ease the burden high energy prices place on many households, and benefit the cash flow of many businesses.  These are real economic benefits but based on op-eds and comments about how high electricity and energy prices are killing business, including by people and groups I like and respect, you might think that reducing the price of electricity will bring a new industrial revolution to the state.  The problem is, a new industrial revolution has been occurring and it is one that relies less on energy and is, in part,  a result of those high energy prices.

Energy BTUs per GS

Energy prices are becoming less important to the success of the New Hampshire economy all the time.  As the chart above shows, the energy content of what the state produces has been declining for decades.  More of what we produce relies less on energy content and the lower energy intensity of the NH economy indicates a lower price or cost of converting energy into GDP.  Reducing the price of an input that is becoming less important each year to the output of the NH economy is not a prescription for revitalizing the NH  or any state’s economy.

To cite just one example, high energy prices have hurt but certainly didn’t kill the pulp and paper industry in New Hampshire.  Industrial electricity rates in Georgia are almost exactly one-half (5.97 cents/kwh) what they are in New Hampshire (11.97 cents/kwh avg. as of Dec. 2013) but Georgia lost 10,000 pulp and paper jobs (40% of the industry in that state) over the last 11 years.  Industrial electricity rates are 40% lower in Wisconsin and Pennsylvania than they are in New Hampshire and those states lost 11,000 and 10,000 jobs respectively in paper-making industries.  California lost more than 13,000 jobs in the paper industry, Illinois 12,000, Ohio 10,000 etc., etc. etc., to the tune of about 200,000 jobs lost across the country and in states with both high and low energy prices.  So if you thought that lower electricity prices would reverse that  industry you would be wrong.

I hope NH does lower electricity prices and if we do, congratulations, we will have won a battle for the 1970’s and 1980’s.  Maybe then we can turn our attention to the battle for the future.   If you want an example of a NH paper company that is fighting (and winning) today’s and tomorrow’s battles consider Monadnock Paper, you can read an excellent online Forbes article about them here.

The future is as much or more about reducing energy intensity as it is about lowering energy prices.  In fact, while lowering energy prices would have been great for NH circa 1980, it might also have delayed the long-term economic adjustments and reductions in energy intensity needed for our state and region to thrive. An industry that can’t thrive in NH because of energy prices is an industry that probably could not thrive in a global economy for a number of other cost-related reasons.   Maine’s industrial electricity prices are about one-third lower than they are in the rest of New England and I don’t think it is a coincidence that Maine is the only state in the region with an economy as energy intensive as the rest of the nation (chart below). Maine’s reliance on more energy intensive natural resource industries hasn’t served that state’s economy well in recent decades.

state by state energy intensity

Our state’s (and our region’s) comparative advantage will never be natural resources or lower costs such as electricity.  For the most part, state economies have been adjusting to account for that fact in what has been at times a painful but necessary adjustment.  As the chart below shows, states with high electricity prices also generally use less electricity per dollar of gross state product.

Eelectricty prices and energy intensity

Although it can, becoming a less energy and electricity intensive economy does not just mean ‘de-industrializing” or becoming a more services-oriented economy.  The dollar value of what New Hampshire’s manufacturers produce continues to climb in real dollars, they just do so just using less electricity every year.  As the chart below shows, the electricity content per dollar of manufacturing output in the state continues to decline and it is not a coincidence that our manufacturing sector has been evolving from traditional to more advanced manufacturing.

electricity content of manuf

Although much of this trend in manufacturing  has to do with the loss of more energy-intensive industries and the emergence of newer, less energy intensive industries, as Monadnock Paper demonstrates, some is also about traditionally energy-intensive industries adapting to the state’s less competitive energy climate.   In either case, the NH economy and individual businesses are way ahead of energy policies in the state.  The question is whether energy policies can catch-up enough to help facilitate the energy and economic transitions and adaptations that are occurring in the state’s economy

Residential Customers are Reshaping NH’s Electricity Market

July 9, 2013

You can’t write about energy debates in New Hampshire without writing about the largest provider of electricity in the state – Public Service Co. of NH.  This is not an anti-PSNH post, they already have enough people calling for their heads and I am uncomfortable among crowds.  I have known and worked with too many good PSNH employees to want to “pile on” with criticisms and even if I did the company has too sophisticated a public and community relations operation to be concerned with the writings of a blogger.   By way of disclosure, I am not currently involved either professionally or personally in any issue that directly affects PSNH.  I am, however, intensely interested in energy markets and energy policy in NH and the nation.

The NH Public Utilities Commission and Public Service Company of New Hampshire have sharply differing views on the outlook for the electricity market and what should be done about it.  Whichever view is deemed more accurate by the PUC will likely determine the how electricity markets are regulated and deregulated in NH in the coming years.   In this post I look briefly at the most prominent issue facing customers, regulators, and PSNH,  and the issue at the heart of what will be the most important policy debates (no offense Northern Pass proponents and opponents) over the electricity market in the state.

For decades electricity markets were affected much more by large commercial and industrial customers than by residential customers but that has chganged.  As I suggested at the beginning of the year in my post “The Coming Consumerism of Residential Electricity Customers”, competition for residential electricity customers would likely accelerate in NH.  As the chart below indicates, the migration of residential electricity customers away from PSNH has been accelerating and the implications are enormous.

residential customers

As PSNH’s electricity customers switch to competitive suppliers revenues decline, and  more importantly for the future of the market, the customer base shrinks.  For a company like PSNH with high “fixed costs” in electricity generating plants and other system costs, these fixed costs do not shrink with a reduction in electricity sales or a decline in the customer base .  The result is that fixed costs are recovered from a smaller number of customers which of course leads to higher prices and a further migration of customers and still greater costs for the smaller number of customers of that remain.  For an electricity provider with high fixed costs and a regulatory system that allows those fixed costs to be recovered from its customer base, revenues will not decline in proportion to declines in electricity sales.   As the chart below shows, the decline in PSNH’s electricity sales has been much larger than has been the decline in its revenues from electricity sales.

Energy sales and revenues

When revenues decline more slowly than do sales of electricity, the revenue derived per unit of electricity sold increases, despite a decline in both sales and revenues.

revenue per MWh

That can temporarily help cushion an electricity provider from the impacts of declining customers and sales but  is not a sustainable long-term strategy or good thing for customers and the economy.  It seems that both PSNH and the Public Utilities Commission agree on that.  What they don’t agree on is how long these trends will last, how far they will go, and most importantly, what to do about them.  Some of these issues will be topics of future blog posts.

The Outlook for Natural Gas Prices in New England

May 3, 2013

There is a lot of discussion, debate, advocacy and lobbying about whether New England’s energy future is becoming more vulnerable because of the region’s increasing reliance on natural gas for electricity generation.   Some see the prospect of rising natural gas prices (because of increasing demand in the region and nationally) as a vulnerability and others are concerned about constraints on the pipelines that bring natural gas into the region.  I’ve posted a lot about natural gas and electricity related issues and as I have previously stated my belief that regional increases in demand along with greater U.S. production of natural gas are more likely than not to create scenarios that will increase the capacity of the regional pipeline infrastructure. New England has traditionally been a region with a relatively low percentage of its energy consumption in the form of natural gas.  That is changing rapidly, but increases in U.S. production of natural gas along with demand driven incentives to increase infrastructure capacity in the region should reduce a lot of the volatility of natural gas prices in New England.

Apparently there are other folks who feel similarly.  The U.S. Energy Information Agency (EIA) released its “Annual Energy Outlook” last month and it has a wealth of historical data, forecasts and projections.   Their forecast of natural gas prices across the country are based on many economic, energy demand, production and other variables.  They also produce a range of forecasts based on different assumptions about economic growth , energy demand and prices.  The good news is that their baseline forecast for natural gas prices in New England (chart below) shows that  prices in the region, which are traditionally higher than in most other regions of the country, are expected to align with the national average early in the next decade, and then move lower than the national average over time.  Even better news is that this forecast is not dependent on a much weaker economy in New England than in the rest of the country (which would imply lower increases in energy demand in the region compared to the rest of the country).  I don’t think EIA would be forecasting lower relative prices in New England if they did not see  region’s pipeline infrastructure issue as being addressed.
NE Nat Gas Price vs US Forecast
The EIA also projects that the price of natural gas relative to coal will continue to increase.  Coal will probably almost always be a cheaper fuel than natural gas but today’s typical “combined-cycle” natural gas generating facilities are much more efficient than coal-fired plants.  When the ratio of natural gas prices to coal prices is approximately 1.5 or lower, a typical natural gas-fired combined-cycle plant has lower generating costs than a typical coal-fired plant.   Natural gas-fired electricity generators enjoyed a strong competitive advantage over coal plants in 2012 but natural gas plants will begin to lose competitive advantage over time, as natural gas prices increase relative to coal prices.    The retirement of older coal-fired generating plants, however, will mean that coal continues to generate a smaller percentage of the region’s and the nation’s electricity.

Some see New England’s increased use of natural gas as a concern.  There are issues that need to be addressed but none that are insurmountable or that should have the region reconsider its increasing reliance on natural gas.  Long-range energy price forecasts are notoriously difficult but New England’s energy needs and interests are finally becoming more aligned with the rest of the nation.  For too long New England has been an anomaly as the most oil-dependent and least natural gas-dependent region in the country.  Personally, I would rather have 300 million people concerned about my energy needs than just 15 million.

Electricity Prices Highlight the Benefits of Markets and Choice

March 28, 2013

Four of the six New England states (CT,ME, MA and NH) had lower average retail prices for residential electricity customers in January of 2013 than they did in January of 2012 (chart below).

Chang in Avg Retail Price of Electricity

Most of that is a result of the increasing sales into the region’s electricity market  of electricity generated by natural gas which is priced lower than the electricity generated using other sources.  The decline in the average price in NH is smaller than in some other states but it could have been, and could still be,  larger if retail competition in the residential electricity market takes hold.   The chart below shows the average cost of retail electricity for residential customers in the continental United States in January of 2013.  New Hampshire and all of New England have among the highest average rates but based on the contract information from the largest competitive suppliers of residential electricity in New Hampshire, the average price would be significantly lower (at least until November of 2013) for those who choose the lowest rates available from competitive suppliers (other higher rates are available that let customers choose to purchase a higher percentage of electricity generated from ‘green” sources).

Avg Residential Price of Electrictyby State

I was going to make this a much longer post and include a discussion of why the warnings by some about an “over-reliance” on natural gas in the region are overstated but not inaccurate (the natural gas pipeline limitations to the region are real but more likely to be remedied than not with increased natural gas usage in the region) but I will save that for another day.  The reputation and belief in free(er) markets and competition have taken a beating over the past several years so  for now I am just going to enjoy highlighting  of  one of their recent successes.

Gasoline Taxes, Prices, and Price Differentials

March 27, 2013

Policymakers often assume that sales and excise taxes are the primary reason for variations in the price of goods and they too often assume that consumers consider differences in tax rates across jurisdictions when making purchases rather than differences in the total price (tax plus non-tax price) of a good.  A good example was the $.10 drop in NH’s cigarette tax in 2010.   Some thought the decrease would be a beacon to NH for consumers.  But the decline did nothing to lower the price of cigarettes in NH because manufacturers increased their price by an equivalent amount immediately after the tax decrease (effectively capturing the revenue that would have gone to the State of NH).  I did a fair amount of gloating in an early post as the revenue numbers reflected my predictions. Consumers saw no price break and no major changes occurred in other states so no increases in competitive advantage for retailers occurred in NH (retailers saw no benefit) and the longer-term trend of declining smoking rates (along with a things like higher gasoline prices and fewer visitors to the state) were the primary determinants of sales trends, and thus lower revenues.

The demand for gasoline, like cigarettes, is relatively inelastic so it takes a surprisingly large price increase to change consumption very much but differences in prices among  locations may shift the location of some gasoline sales where consumers can conveniently choose where to make their purchases.  I can buy gasoline as easily in Maine as in NH and with a little more effort I can also buy in MA.  I often can get gasoline as or even a bit cheaper in MA than in the town where I live,  but I can’t get gasoline cheaper in Maine.  I can also get gasoline  cheaper if I drive a few miles to towns just north and south of me, or even to a gasoline station on the other side of town.   These price differences are often $.10 per gallon and occur among retailers of similar types – i.e. gasoline stations with a convenience store, the same brand convenience store selling the same brand of gasoline.   Nevertheless, when I look at the average price of gasoline between neighboring states (with some exceptions like California where environmental regulations have large retail price impacts), the differences in price appear  to be strongly related to differences in state tax rates (r=.82).  Comparing statewide average prices and tax rates for gasoline masks much of the variation in pricing that occurs within states and even within communities.  That is one reason why I think policymakers focus so much on tax rates as the primary reason for price differences.

State Gasoline Prices

Despite all of the attention to gasoline prices and proposals to raise or lower gasoline taxes over the past decade there has been surprisingly little research on the retail price impacts (or “pass-through” effects) of changes in gasoline taxes.  That may be because changes in gasoline taxes are relatively small (usually a few cents) compared to the much larger price changes that occur as a result of  supply/demand issues and variations in the world-wide price of oil.  The chart below shows how gasoline prices in NH have changed since 2004 and it also shows the theoretical price if the state had no excise tax on gasoline.  The red line shows the theoretical prices because, like cigarettes, retail prices may or may not be reduced by an equivalent amount if the gasoline tax were lowered.

Monthly NH Gasoline Prices

The theory of tax incidence suggests that sales and excise taxes should be fully passed on to consumers in competitive markets with constant marginal costs.  Less than full “pass-though” is expected in markets with increasing marginal costs, while the pass-through rate may be less than, or greater than, one-hundred percent in markets that are less competitive.  In addition, tax increases in one state may lead to higher prices across the border as stations there face greater demand.  A study examining a temporary reduction and reinstatement of a 5% gasoline tax in Illinois (sorry I can’t find the reference)  found that that when the 5% tax was eliminated, prices declined by 3% and when the tax was reinstated prices rose by 4%.

Politicos are looking to score big points for their positions on gasoline taxes.  There was a time when whatever marginal changes lawmakers made to gasoline taxes may have meant a lot to changes in prices at the pump.  Right now, and in the future, changes in world-wide oil markets are likely to overwhelm  any impacts from changes in state taxes and  together with the uncertainty over the degree of pass-through, make any predictions about the economic impacts of gasoline tax hikes nearly impossible.


%d bloggers like this: