Annual budget deficits since 2009 have been the largest in a generation. The deficit-to-GDP ratio, which averaged 2.5% from 1980 to 2007, peaked at 10.1% in 2009 as the recession reduced tax revenue and spending rose with the economic stimulus package. There is still a long way to go but the deficit to GDP ratio has improved each year since 2009 and will likely continue to do so for the next few years. The chart below shows a reasonable proxy of the official federal deficit – it shows the 12-month moving average of the difference between federal revenues and federal spending. Over the past year this deficit estimate has improved by an average of $28-$30 billion per month, much better than the CBO’s 2013 deficit projections.

The deficit is shrinking because of a combination of higher revenues and slower spending. To this point deficit reduction has largely been the result of higher tax revenue resulting from an improving economy, the expiration of the payroll tax holiday (worth about $135 billion this year), and higher tax rates for upper income individuals but spending reductions are beginning to play a larger role.
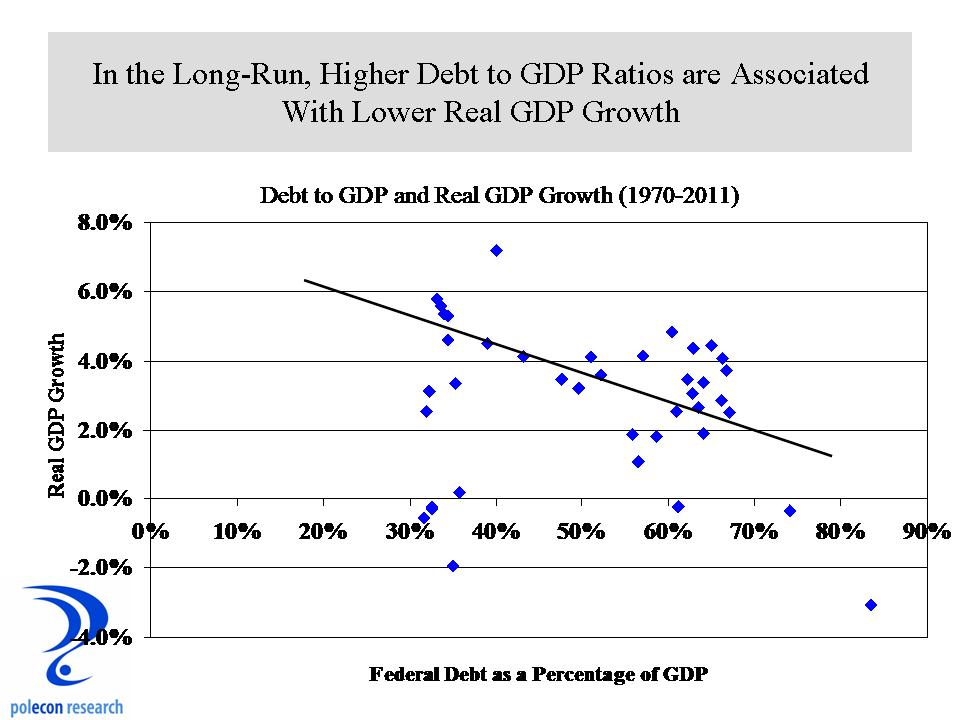
Lower deficits and a reduction in the national debt as a percentage of GDP will help economic activity in the long run. Although there are many short-term factors that influence the relationship between federal debt ratios and GDP growth, over the longer-term, higher debt levels are associated with slower GDP growth and lower debt levels are associated with higher GDP growth.

The deficit is contracting faster than expected, but the goal of deficit reduction can have negative implications from either excessive taxation or spending cuts that significantly impact demand. The Federal government accounts for roughly 7% of total economic output and has shrunk by an average of about 10% each of the last two quarters. So while the good news is that deficit-reduction is likely to be greater than expectations in the near term, the cost from tax increases and spending cuts will likely lower real GDP growth by about 1% over the next year.