Archive for June 2013

There Goes the Punch Bowl – Quantitative Easing for Dummies (Like Me)

June 21, 2013

Economic recovery following a recession is almost always characterized by rapid employment growth, not this one.  In an effort to boost demand, central banks across the globe, and especially the U.S. Federal Reserve, have pursued easy money policies in the wake of a worldwide financial and economic crisis.  Despite these efforts job creation continues at a tepid pace compared to recoveries from prior recessions.

Over the past decade the U.S. production of self-degreed constitutional scholars as well as Federal Reserve haters has grown exponentially.  I am neither.  The Fall of 2008 was a frightening time for anyone with even a cursory knowledge of the U.S. and world financial systems.  The Federal Reserve’s actions, along with other central banks, helped avoid an unimaginable calamity and while I am no Fed hater it is appropriate to consider the Fed’s policies in the three plus years since the Fed did what it needed to do to avoid a financial catastrophe.

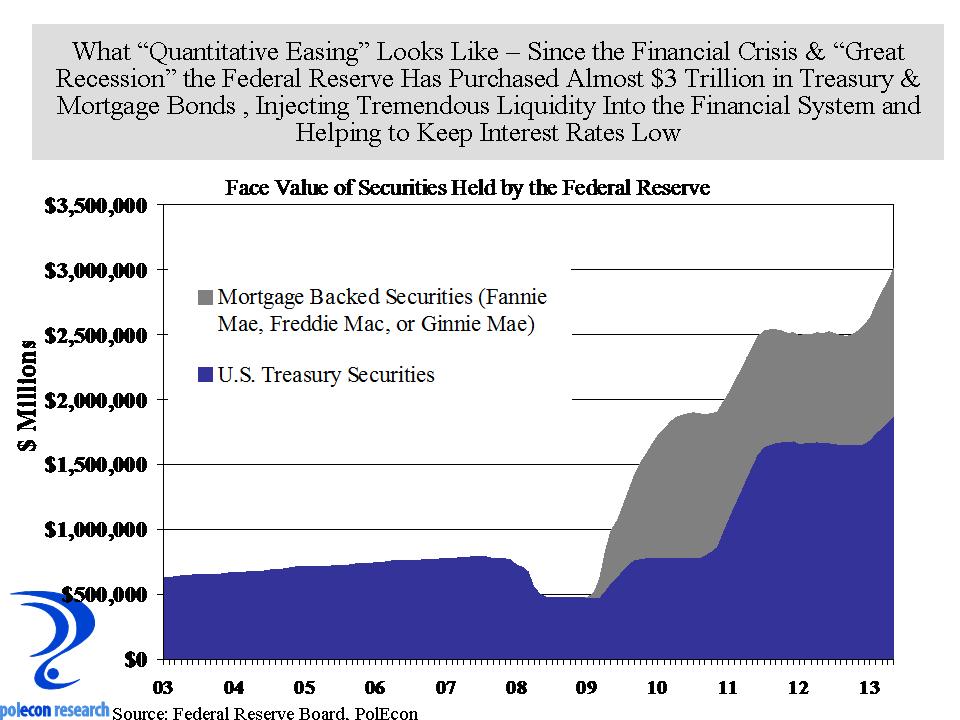
The Fed first began injecting liquidity into the financial system by purchasing the assets (loans and securities) of financial institutions (quantitative easing or QE 1) as the financial crisis and recession were taking hold.  This helped assure that there would be a supply of funds available to fuel the credit needs of the economy at a time when many banks were badly weakened and most were unwilling to lend even to each other.   As the chart below shows, the initial round of quantitative easing was followed by a continuation of purchases of mortgage backed securities (MBS) and treasury notes and bonds (QE 2 and QE 3), tripling the size of the Federal Reserve’s balance sheet.   The increase in demand for MBS and treasuries helped boost the price of these assets pushing their yield down and keeping interest rates in the economy low.

Quantitative Easing

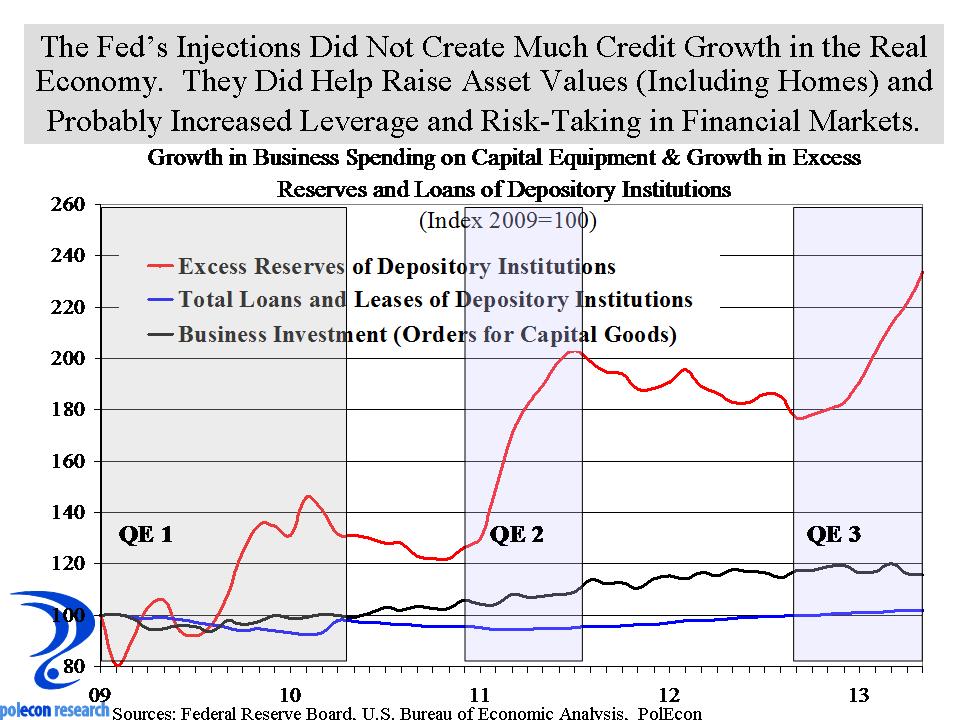
The problem is that the Fed’s liquidity injections have not created credit or the demand for credit in the real economy, but rather they have increased leverage and risk-taking in financial markets.  They have also helped increase asset values.  Increasing the value of stocks and bonds and especially homes is a good thing but as a method of stimulating the economy, not especially efficient.

Fractional reserve banking means that every dollar available to a financial institution can result in many more dollars in loans.  Every introductory economics student learns that the rapid expansion of the money-supply inevitably fuels inflation – except in this case it has done neither, at least thus far.   Inflation has remained subdued at roughly 2% because there is still a substantial amount of slack and a lack of demand in the economy and because banks are not using their swelling reserves to expand credit and increase liquidity.  This is not at all an indictment of banks.  They are responding to the tepid demand for credit at a time when de-leveraging has been the norm.  Banks earn 0.25% on the excess reserves (the fractional reserves in excess of those required to be held based on the volume of their loans and other assets).  With interest rates at historic lows, de-leveraging occurring among businesses and consumers, and at a time when banks face increasing scrutiny and regulation, we should expect that banks would be most willing to lend to the government and large stable corporations and less likely to extend credit to riskier borrowers like small businesses, start-up companies or first-time home buyers.  The chart below shows how the excess reserves of banks have grown with each round of quantitative easing, along with growth in the loans and leases of domestic banks, and growth in capital equipment purchases by U.S. businesses.  The chart suggests that about 2% of the liquidity injected into the financial system during QE 2 and QE 3 has been circulated into the economy, while the rest sits idle.

Bank Excess Reserves and Loans

The last time, interest rates were too low for too long (2001-2004) the result was huge bubbles in credit, housing, and equity markets and we know how that movie ended.  As the Fed begins to reduce its purchase of securities, the stock and bond markets are reacting with fear, too bad, its time for a movie with a better ending for the “real economy” and that will take policies that don’t just satisfy financial markets.

Demographic Demise – The Sequel

June 17, 2013

Those well known demographers at Governing Magazine are likely to ignite another round of hysteria about NH’s aging population with their recent article highlighting increases in the median age of state populations.  I do not plan to go “gently into that good night” and for the past decade, as I hurtle toward my dotage,  I have “raged against the dying of the light” by highlighting why, at least in NH’s case, demographic trends are far less apocalyptic than popularly portrayed.

I can’t say it enough, I  believe that demographics explain two-thirds of everything.  Current trends will present the U.S. and NH with many challenges but we will be infinitely better able to confront these challenges with an accurate understanding of the forces that are creating them.  Too often demographic data is tortured to yield conclusions in support of some issue or cause rather than analyzed to reveal the real underlying  forces affecting the economy and society.  If we think the state’s population is aging because of zoning restrictions or because contraceptives are too widely available,  or because there aren’t enough skateboard parks or coffee shops then policies designed to manage the changes resulting from demographic forces are going to be profoundly ineffective.

I first made the arguments below  about a decade ago and despite the protestations of those who have horror stories to tell and books and documentaries to sell, nobody has shown why they are inaccurate.

Aging is a permanent, irreversible consequence of low average family size and longer life expectancies in developed societies.  Because NH has both wealthier and healthier older citizens (on average) than does the US, we expect greater longevity.  NH also has among the lowest fertility rates of any state in the nation and this, more than anything, accounts for our increasing median age relative to the US.  The chart below shows how much lower and how much faster the fertility rate among women of child bearing years has been declining in NH compared to the U.S. average, along with how much lower NH’s mortality rate is than is the U.S. rate.

Fertility and mortality trendsUnlike the brother and son of former U.S. presidents I don’t know anything about how fertile women of different races or ethnic origins are but I am probably just as prone to putting my foot in my mouth, so here goes:  “Fertility rates,”  or the number of births per 1,000 women in child bearing years does vary  by the educational attainment, labor force status, and as is evident in the state of Utah, even the religious beliefs of women and their partners.  Fertility rates largely account for NH’s rising median age, just as they do for Vermont and Maine.  Fertility almost always has a more powerful effect on the age structure of a state’s population than does either migration or mortality because all of the population changes that it generates arise at age zero and work their way through the age structure for 70+ years.  The chart below shows how much lower is NH’s fertility rate among women age 15-44 than is the rate in most other states in the nation.  The chart also largely explains why Utah has the youngest median age of any state and why NH, VT, ME and other New England states have older median age populations.

State Fertility RatesWomen in NH (as well as in most New England states) have higher educational attainment (on average) and are more likely to be in the labor force than are women overall in the U.S..  Both of these factors are associated with lower birth rates. Much of NH’s increase in college educated workers is the result increases among women and this has produced substantial economic benefits for the state and its residents.

For two decades NH has added large numbers of families with children and lost younger people who attend college or otherwise leave the state in young adulthood.   In recent years a weak economy and a housing market that made it difficult to both sell and buy a house has greatly curtailed migration into NH.  Mover’s to NH over the past several decades are more likely to be a married couple family age 30-44 with children and  likely to both be college educated and working.  That demographic doesn’t do a lot to lower the median age of a population but it can help keep the median age stationary in the middle of the age range.  However, economic conditions not only have curtailed state-to-state migration, they have also lowered fertility rates, as income and employment trends appear to have given  pause to more families considering expansion.   Across the nation state-to-state migration has been lower than at any time in a half century and fertility rates started to decline in the U.S. (after rising in a few consecutive years) as the last recession took hold. 

The long-term trend in NH is for a gradually increasing median age that should be rising at about the same rate as the much of the U.S..  The state is not even close to the top among state on the percentage of its population age 65 or older and that fact alone should eliminate some of the more simplistic explanations for why NH’s median age has been rising faster than the U.S..  Because of our low fertility and mortality rates, NH is more dependent upon in-migration to offset trends that would produce more rapid increases in median age than seen in much of the country.  Over the past several years those migration trends haven’t been favorable.  If the economy and housing markets recovery continue and NH focuses on the right policies (hint – zoning regulations aren’t it) this should be a temporary  phenomenon, but that doesn’t mean we aren’t going to get any older, it just means that we can keep the median age at a more stationary point in the middle of the age distribution.  The middle has gotten a pretty bad name in recent years, but demographically at least, its not at all a bad place to be.


%d bloggers like this: