Posted tagged ‘NH’

NH Never Really Lost its Attractiveness

December 28, 2018

There is no more overblown or misunderstood issue in NH than its demographic trends. There are challenges to be sure but almost all of the popular memes don’t withstand solid empirical analysis.  NH’s extremely low birthrates among women 15-44 (first or second lowest in the nation over the past many years – again a sign of NH’s successes not failures as it is a result of women in NH having with high levels of educational attainment and who have a high level of participation in the labor force) means the state must rely on net in-migration for labor force and population growth.  I have argued for more than a decade that there is nothing that has fundamentally altered NH’s attractiveness as a place to live, despite a number of years recently where more individuals moved out of the state than moved into NH. During times of recession NH tends to lose educated and talented people to places with more opportunity, while the housing crash that prompted the last recession made it especially difficult for NH’s core in-migration demographic (two wage earner, married couple families, ages 30-44, with children) to move into NH because they likely would have had to sell a house with an underwater mortgage and they would also have wanted to buy a house in NH (both of which were much more difficult between 2007 and 2013). Like all rural states, NH also sees a high percentage of young people leave and that has not changed in decades.  The good news is that net in-migration to NH is resuming and gaining steam, NH had the 6th highest rate as a % of its population of any state and the demographics of in migrants were a bit younger than prior years.  In addition, about 55% of in-migrants to NH over the past five years have a post-secondary degree, adding to the overall skill level of NH’s population.

2017 State to state

Still, net in-migration tends to be concentrated in a few areas of the state, the Seacoast, Strafford  and Rockingham Counties in particular, and in several communities. While state policymakers worry about statewide demographic trends it is most important to remember that the state and its communities are not monolithic.  Trends vary greatly across communities and it is the decisions and policies of local communities that most affect demographic trends.  It would be wise for policymakers and local officials to look to the characteristics of communities that are bucking the trends about which policymakers are most concerned (aging, out-migration, etc.) for prescriptions to address their concerns.

Is NH’s Labor Deficit Turning?

September 19, 2018

Aside from the ups and downs of business cycles, the growth rate of New Hampshire’s (and the nation’s) labor force and labor force participation rate has been on a consistent, downward trend. The rising percentage of NH’s population in age groups with traditionally lower rates of labor force participation along with slower overall population growth are key contributors. The two trends go a long way toward explaining why economic growth has been slower over much of the past two decades than during earlier time periods. As I noted in earlier posts, with NH’s extremely low birth rates, net in-migration to the state is critical for population, labor force, and ultimately employment growth. Net state-to-state in-migration to NH is resuming in age groups with higher labor force participation and one consequence is a recent increase in the working-age population, as well as labor force participation in the state (chart), enabling stronger job growth in NH. It is early but the trend is very encouraging.

Particption and Population

Business is Aging Faster Than the Population

August 24, 2017

The U.S. economy is in a constant state of churn. New businesses are being created while existing businesses quit or fail. This dynamic process can be disruptive as new technologies, firms, and industries replace older ones, but it is not destructive, it enables increases in productivity and spurs economic growth. In a dynamic economy with lots of churning more productive firms drive out less productive ones, new entrants disrupt incumbents, and workers are better matched with firms. A dynamic economy constantly forces labor and capital to be put to better, more productive uses. Historically the dynamism of the U.S. economy is an important ingredient that distinguished our country from many slower growth (or stagnating) industrial economies. New Hampshire and the New England region have been especially dependent on economic dynamism as the region typically loses industries to regions or nations that have lower business costs once industries mature and become more standardized. High rates of new business starts fuel dynamic economies. Unfortunately in NH and in all other states the rate of new business starts is in long-term decline.

For most of the past few decades far more businesses in NH and most states were started then either quit or failed. More recently, the gap between a large number of business starts and a smaller number of quits or failures has been narrowing. Briefly, during the great recession, more businesses quit or failed in NH and the U.S. than were started.

New Firms and Exits

Except for an uptick during the “great recession,” business quits or failures have occurred at a pretty consistent rate over the past several decades. What has narrowed the gap between the number of new firms and the number of quits and failures has been a decline in the rate of new business starts in New Hampshire and the nation. The chart below shows that new firms (less than one-year old) accounted for less than 7 percent of all New Hampshire firms in 2014, down from 15 percent in 1988. A similar decline occurred in the country as a whole.

New Firms as a % of all Firms

The decline in economic dynamism implied by lower rates of business starts is contributing to our nation’s slower (by historical standards) productivity growth. Although labor force constraints are a primary culprit, lower rates of new business starts also contribute to slower employment growth, as fewer new business replace those business that quit or fail.

A recent study by Dun & Bradstreet American Express and recent data released by the U.S. Census Bureau show that larger businesses have been creating jobs at a faster rate than small businesses (less than 20 employees) in recent years, including in NH.  A very good business reporter in NH asked for my thoughts on these findings for an article he was writing.  In the article I note that the decline in entrepreneurial activity was a more important factor explaining slower job growth among smaller firms than was business size.  The age of businesses is an “intervening” variable between the apparent relationship between size of businesses and job growth, as new business typically start small. Simply comparing the percentage of jobs added by smaller and larger firms in NH would miss the job growth implications (among the small business category) of the declining rate of new business starts. New business starts account for a significant percentage of job creation in any year and a decline in business starts hurts job growth among  the category of small (under 20 employees) businesses.   The chart below shows that new firms less than one-year old accounted for about 8 percent of all private sector jobs in NH in 1984, by 2014 that percentage was down to 3 percent, a more than 60 percent decline.  From over 30,000 jobs at startups in the mid-1980s, the number of employees at startups averaged less than 18,000 between 2012 and 2014.

Jobs and % of Jobs

Today it is impossible to enter any analysis of the economy that isn’t interpreted through some ideological lens. Making it easier for entrepreneurs to start and operate a business without excessive regulatory burdens and allowing entrepreneurs to keep more of the rewards of their risk taking may seem like an ideological prescription but it just makes sense to incent more new business formations.  However, a bigger problem may be that too often regulations, laws and the political process favor older, more established technologies, businesses, and industries and look to protect and preserve the past rather than enable future technologies and industries.

Economic cycles produce temporary declines in entrepreneurial activity.  Recessions don’t make it easy to start a business but the nation’s longer-term decline in entrepreneurial activity spans economic cycles. One of the more troubling aspects of recessions is that by reducing startups and killing-off many younger firms they shrink the pool of new business from which the next generation of growth companies could emerge.  Younger firms that survive for a number of years tend to grow faster than older firms so a smaller number of new and surviving firms impede future job growth and make it harder to recover from recessions. By impeding business starts for several years (well after the recession ended) the less visible but longer-term impact of the “great recession” will be a smaller generation of the next growth companies.

Still, structural factors in the economy are more problematic for longer-term trends in business starts.  Primary among them is demographics.  There has been a lot of attention focused (often inaccurately) on the demographics of NH’s population but not enough on the demographics of its business population, even though the two are related.  Just as declining birth rates in NH’s population is the primary factor accounting for the aging of the state’s population (not the movement of young people out of the state), a decline in the rate of new business formations is rapidly aging the population of NH businesses.  In fact, the population of NH’s businesses is aging faster than is the state’s population, potentially reducing the economic dynamism that characterized the state’s vibrant economy during much of the 1980s and 1990s.  With an increasing percentage of the state’s workforce above age 50, entrepreneurial risk taking can be expected to slow and as the chart below shows, the percentage of businesses in NH that have been in business for more than 15 years rose rapidly between 2003 and 2014 (the most recent year for which data is available).

Aging of Business

Millenials are a generation that is larger than the baby boom generation and as they become established in the working world they could reverse the trend of declining entrepreneurism.  But today individuals are changing jobs at ever lower rates, suggesting a tendency to prefer security over opportunity and risk.  Millennials are also a generation that is burdened by higher debt levels when they enter the work world, that delays or eschews homebuying, marriage and having children, will they be a generation of risk takers that revive entrepreneurism in NH and the nation?  I hope so because a dynamic, high productivity U.S. and NH economy depend on it.

Immigrants to New Hampshire: Enemies at the Gate?

February 2, 2017

America is pretty great most of the time but I understand why many in this country disagree with that perspective.  There are a lot of disaffected individuals across the country, in large part because of the differential impacts that changing economic, social and cultural forces have had on individuals, communities, and regions of the country.  There is also no shortage of individuals, causes and movements looking to channel that disaffection.  Populism and nationalism are catalysts that can coalesce the disaffected in this and other countries into powerful and sometimes malignant forces. It is easy to see how the real disaffection accompanying economic and social change in this country, combined with legitimate desires for national security could be stoked to the point where issues requiring thoughtful policies and actions morph into something less legitimate and more pernicious.  As my favorite self-educated, longshoreman, philosopher Eric Hoffer, wrote in “The True Believer: Thoughts on the Nature of Mass Movements”  back in 1951- “Mass movements can rise and spread without belief in a God, but never without belief in a devil.”  Today in America the devil is foreigners and  in particular – but not exclusively – foreign Muslims (along with other foreigners and immigrants the media is a distant but strong second devil), but you don’t have to look too deeply to see those sentiments extending to other faiths, races, and nationalities and others (e.g. “experts”, scientists, intellectuals, “elites”.)”  That is a big step backward for a great country (that can, in fact, be made GREATER) but one who’s greatness has not been predicated on diminishing other peoples or retreating from the rest of the world.

Years ago in this blog I wrote that NH’s most valuable import was the talented individuals that arrived here from other countries. I still believe that to be true and now seems like an appropriate time to revisit that issue with some fresh data and analysis.

Unquestionably New Hampshire and New England will be economically and demographically worse off if international migration is significantly restricted.  In fact, it is hard to see a region of the country that would be more negatively affected than New England by any large scale reduction in immigration.  International migration has provided a powerful boost to the economy of New England by adding individuals to our labor force and talent to fuel our region’s innovation-dependent economy.  Always important to the region but never more so than now,  a time when New England has been on the losing end of national demographic trends that have seen more individuals in this country moving to the south and to the west.  Looking at just the past several years we see that all of the New England states experienced more people moving out to other states than moved in.  New Hampshire is again starting to see net in-migration from other states but for more than a decade the state has experienced, on average, net international migration of about 2,000 individuals annually.

net-migration

There are about 76,000 foreign born individuals living in New Hampshire.  Immigrants comprise over 6 percent of the state’s labor force (compared to 16.5 percent in the U.S. overall) but that 6 percent has an out sized importance to the state’s labor force in a number of ways.  On balance, immigrants increase the overall level of educational attainment of New Hampshire’s adult population.   Examining data from the U.S. Census Bureau’s “American Community Survey” 5 year estimates (2011-15), the chart below shows that 40 percent of the foreign born population age 25 and above in NH has a bachelor’s degree or higher, compared to 34 percent for U.S. born residents of the state.  A higher percentage of foreign born residents living in NH have not graduated from high school but overall the chart shows that  compared to the foreign born population across the U.S., immigrants in NH have significantly higher levels of educational attainment.

ed-attainment-of-immigrants

Immigrants represent a high percentage of individuals in New Hampshire with STEM (Science, Technology, Engineering, Math) degrees.  There is no single definition of what constitutes a STEM degree but examining Census data on the first college degree (bachelor’s) received by working individuals in NH, age 25 and above, it is not difficult to reasonably classify the 172 different degrees as STEM or not.

Among NH’s foreign born adult population that holds at least a bachelor’s degree, 46 percent hold a degree in a stem field, compared to just 24 percent for native born NH residents.

immigrant-pct-with-stem-degree

Despite comprising just over 6 percent of NH’s workforce, foreign born individuals account for 16.5 percent of all working NH residents with a STEM degree, a percentage nearly equal to that of NH born residents of the state.

immigrant-pct-of-stem

Finally, examining specific occupations shows just how important immigrants are to the supply of many occupations in the state..  Foreign born residents comprise 20 percent of the computer-related occupations held by NH residents.  Fully 20 percent of physicians, surgeons, and other high-level medical occupations are held by foreign born residents of New Hampshire. Foreign born residents also hold a relatively large percentage (11.5%) of production jobs in the state.  Among lower-skill occupations foreign born residents hold 21 percent of maid and housekeeping positions and 13 percent of janitorial occupations. The figure below highlights the impact of immigrants on the supply of occupations in NH for several of the more than 400 occupations examined.  Only occupations held by 1,000 or more NH residents are included.

immigrant-share-of-occupationsSupporters of migration bans and limits say that the limits on immigration would only apply to refugees (not comforting to me for a number of non-economic reasons), undocumented immigrants, or those with a criminal past.  But with the rhetoric and actions coming from Washington it is hard to see anti-immigration policies stopping there.

Not With a Bang But With a Whimper

July 26, 2016

The U.S. economy is currently in its 86 month of an economic expansion that began in the summer of 2009 according to the National Bureau of Economic Research, the organization that officially dates U.S. business cycles. If the expansion lasts another seven months (as it will), it will be the third longest economic expansion in our nation’s history, trailing only the 120 month expansion from 1991 to 2001 and the 106 month expansion from  1961 to 1969.

The probability of recession in the next six months is low but the business cycle hasn’t been repealed, another recession will occur and almost certainly sometime before the end of 2019.  It’s just that none of the excesses – wage and price growth, high energy prices, inflationary pressures, inflated asset values, etc.- that have preceded past recession are much apparent in today’s economy and there aren’t signs that any are imminent.  What will make the next recession unique in the post WWII era is that it may very well occur before the nation has fully recovered from the previous recession, despite how long the current recovery has lasted.  “Fully recovered” here means that the actual output of the nation’s economy (GDP) reaches its potential output (for a brief explanation of actual and potential output of the economy see this Congressional Budget Office publication). This is somewhat akin to feeling the effects of a hangover in the morning despite not having enjoyed the celebration the night before.  Unlike the last recession, or most recessions, the next one may not begin with a bang but rather with a whimper.

No expansion can last forever; the U.S. and the NH economies are showing signs of slowing so it is difficult for me to believe that the nation can avoid slipping into recession sometime during the first term of our next president.  If that President is named Clinton it will most likely mean a one-term presidency as three consecutive terms for an incumbent party (relatively rare in itself) along with a recession in the third term (unless is happens very early in her term allowing sufficient time for growth prior to 2020) would almost certainly result in the nation looking for a change in the party controlling the White House.  If the President is named Trump he will no doubt blame the recession on the past administration and that may help give him a pass in 2020, but a recession will challenge his claim as someone who knows how to create jobs, while his penchant for populist and nationalistic themes aren’t generally viewed as monetary and fiscal policies effective in combating a recession.  His administration’s and his personal  response to the recession might determine his fate (does anyone else remember the images of the first, single-term, President Bush zooming around in his cigarette boat off the coast of Maine while the U.S. was in the middle of the 1990-91 recession?).

The past two months have been marked by one very bad and one very good month for job growth in the nation and in NH.  I  advocate looking at three months of job growth numbers in discerning employment growth trends and a prudent man would wait for the release of the nation’s July job growth numbers on August 5th before making any proclamations about the direction of the U.S. or NH economy.  But a prudent man doesn’t write this blog and I am comfortable knowing that when you right too early it often seems like you are wrong so here are a few of the more accessible  indicators that I believe suggest slower economic growth moving forward.  There are others but jobs and revenues are what interest policymakers most so they are highlighted here.

  • The rate of private sector job growth has slowed.
  • The number of industries that are adding jobs versus the number shedding jobs (the employment diffusion index) has declined.
  • Help wanted advertising is declining.
  • Nationally, state corporate income tax collections appear to have peaked.

Slowing Private Employment Growth

Recognizing that there is always some level of unemployment in the economy, the nation and NH are at or very near “full employment,” making  job gains harder to obtain.  Full employment in the latter stages of recovery is the most obvious rationale for slower job growth going forward.  As the chart below shows, growth in private sector employment nationally is still solid but has been trending downward for some time while growth in NH accelerated in 2015 but appears to have peaked in early 2016.

private sector job growth

The Breadth of Job Gains Narrows

I use a 13 industry private employment diffusion index to assess the breadth of job growth across the private sector economy.  When more industries are adding jobs than are shedding jobs, the index is below .50 and the greater the number of industries adding jobs compared to those shedding jobs the higher is the index number.  The chart below shows that both the national and NH diffusion index have dropped, with NH’s decline of particular concern as it now stands below .50 on a three month moving average basis. NH’s employment numbers are often substantially revised so this index value may not be as bad as it appears here but the U.S. number still points to a slowdown.

diffusion index

Historically, significant declines in NH’s employment diffusion index have signaled turning points in the state’s labor market. The relationship between NH’s diffusion index value and the rate of year-over-year private sector job growth four months later is strong (a correlation of .82).  A simple linear regression of the NH diffusion index on private sector employment growth suggests the last two quarters of 2016 will see private employment growth in NH of about 0.6% on an annualized basis compared to the current rate of growth of about 2.0%.  Clearly not in danger of recession but definitely a slowdown.

diffusion index and emp growth

Fewer Help Wanted Ads

Nationally and in NH the number of help wanted ads has declined in recent months.  In NH the relationship between the three month moving average of help wanted ads and job growth in the quarter that follows is strong (R= .80).

NH US Help Wanted

Growth in State Corporate Income Tax Collections Has Peaked

Nationally, the rate of growth in state corporate income taxes is declining (chart below).

corporate tax revenues

The chart shows that compared to all states combined, the growth in NH’s business tax revenues is increasing as the growth rate nationally declines.  This despite the fact that NH’s private sector employment growth has been at about the U.S. average over the past year.  What is different in NH is the inclusion of NH’s Business Enterprise Tax revenue along with NH’s tax on corporate profits in the chart above.  Both private employment and wage growth have accelerated in NH over the past year. Wages and salaries paid by a business are the largest portion of the Business Enterprise Tax base so even as business profits grow more slowly, business tax revenues can be buoyed by substantial increases in overall wages and salaries.  While not a measure of the payroll of NH businesses, wage and salary income increased in NH by 8.6 percent between QI 2015 and QI 2016 compared to 5.3 percent nationally.  That increase has helped boost Business Enterprise Tax revenue and overall business tax revenue in NH in a way that it cannot in other states (most other states would see the change in individual income tax revenue).  The trend is depicted in the chart below that shows the growth rate of the annualized business profits portion of NH’s business tax revenue has slipped while the growth rate of the portion more dependent on wages and salaries has seen accelerated growth.  A slowing growth rate in private employment in NH implies slower growth in wages and salaries and business tax revenues in the state growing more similarly to the pattern among states nationally.  This will occur just as a budget surplus and strong overall revenue growth have increased pressures for additional state spending that had been muted by several years of relatively weak business tax and overall revenue growth.

NH business tax revenue growth

It is impossible to predict monthly payroll employment growth for a small state like NH (or any state for that matter) but I predict employment growth of about 120,000 jobs nationally in July but anything between 100,000 and 150,000 would be in line with the indicators highlighted in this post and consistent with a gradual slowing of economic growth nationally and in NH. Not soon but at some point that slowing will become a recession and that will be the reward for winning the White House and for new and incumbent occupants of statehouses across the nation.

What the Unemployment Rate Doesn’t Tell Policymakers Can Hurt Us

June 22, 2016

Last week the NH Labor Market Information Bureau released the NH jobs report for May and as usual all of the attention focused on NH’s low (2.7 percent) unemployment rate.  The more significant story was the April to May decline of 4,000 payroll jobs in the state.

Private sector jobs in NH were lower by 3,400 in May, the largest one month decline since 2008 – with one exception – a month in 2014 when workers at the Market Basket grocery chain left their jobs in support of their ousted CEO.  May 2016 job losses were an out sized drop for any month of seasonally adjusted data (a decline of that size would more likely be seen in the not seasonally adjusted data where large changes in employment occur annually during certain months of the year).  I am inclined to attribute some, but not all, of the drop in NH’s May employment to problems with seasonal adjustments and other statistical issues.  Still, the May data marks the first time since 2011 that a three month moving average of private sector employment growth in NH has been negative.

3 mos avg change in private emp

For some added context on the NH payroll employment numbers I wait for a release from the U.S. Bureau of Labor Statistics, usually about one week after NH releases its state’s job numbers.  That monthly report provides employment, unemployment, labor force and other labor market data for all 50 states.  Here is a bit of the context provided in the June 20th release from the U.S. Bureau of Labor Statistics:

“In May 2016, four states had statistically significant over-the-month decreases in nonfarm payroll employment and three states and the District of Columbia had significant increases. The job losses were in Tennessee (-13,400), Michigan (-12,700), New Hampshire (-4,000), and Montana (-2,700). In percentage terms, Montana and New Hampshire had the largest declines (-0.6 percent each), followed by Tennessee (-0.5 percent) and Michigan (-0.3 percent).”

The term “statistically significant” decline in employment is important.  Twenty seven states experienced declines in nonfarm payroll employment in May but in only four of those states was the decline deemed “statistically significant,” meaning that the decline was large enough for the BLS to be at least 90% certain that the change in employment did not fall within the margin for error of the employer survey on which the employment estimates are based.

May emp change

It is not wise to be too concerned with one month’s job report.  Whether the  May job growth number is real or illusory and the product of statistical anomalies, the numbers for NH still should have attracted more attention (than a 0.1% uptick in the unemployment rate) from the media and especially from lawmakers and public officials.  The May job growth number is certainly more noteworthy than a slight uptick in the state’s unemployment rate that was the focus of most media reports.   As I noted in my previous post, employment growth nationally and in NH is going to slow and one bad month is not reason to panic.  But NH’s year-over-year percentage increase in private sector employment took a big hit with the May jobs report and the state’s ranking among states on private sector job growth did as well.  Private employment growth in NH has been on a solid pace for more than a year but with the May data NH moved from the top third to the bottom half among states on year-over-year private sector job growth.

Ranking Private Sector Job Growth

Public sector job cuts continue to be a drag on NH’s total nonfarm job growth, shedding about 2,500 jobs between May of 2015 and May of 2016, by far the largest percentage decline of any state in the nation.

Change in Govt Jobs May 15 to May 16

Still, while the May jobs report was troubling, initial unemployment claims are a very good leading indicator of economic activity and they remain subdued in NH and have yet to suggest a significant downtown in either the U.S. or NH economies.  The May jobs report also showed a continuation of the recent trend of solid labor force growth.

IUC

Implications for State Revenue

My primary concern about the May jobs report for NH, and with monthly jobs reports for NH in general, is how little attention payroll employment numbers get from policymakers and how much attention and importance is given to the state’s unemployment rate.  The state will begin crafting its two-year budget this fall and solid revenue gains over the past year and a budget surplus are building pressure for substantial increases in state spending.  This isn’t a commentary on the merits of specific spending proposals (I will save that for later posts) just a caution that the fiscal environment into which spending proposals will be entered can change and the need to recognize that change as far in advance as possible.  I would feel more comfortable about the upcoming budget process if NH’s weak May jobs number, and the possibility that weaker job growth will continue, were at least acknowledged by policymakers, state agencies, and the media.  I want to know that there is someone in NH’s wheelhouse focused on the horizon and not on our wake.   I understand the appeal of the unemployment rate as a single, intuitive metric that summarizes economic conditions but the unemployment rate is a lagging indicator of labor market and economic trends.  For policymakers and anyone who needs to assess the near-term economic outlook, using the unemployment rate as a guide is a bit like driving using the rear view mirror.   The unemployment rate is an important economic indicator that says a lot about current economic conditions, it is just not that useful for forecasting purposes. Moreover, NH’s demographics (fewer individuals in demographic groups that typically have high rates of unemployment) mean that the state will almost always have a relatively lower unemployment rate than the U.S..  Too frequently that leads lawmakers and others in NH to assume the state’s economy is performing better than it actually is and better than the U.S. economy.

Business taxes are a big reason that NH revenues have outperformed expectations this fiscal year, accounting for almost two-thirds (or $61.4 million) of the $99.4 increase in traditional taxes and fees over FY2015 during the first 11 months of fiscal year 2016.  Focusing on changes in private sector  payroll employment and wage growth is especially important for lawmakers in the Granite State and especially important as we head toward a budget making year.  As a lagging indicator of economic activity NH’s unemployment rate will remain low, even as the economy slows.

Emp Growth and Business Taxes

If lawmakers focus too much on NH’s unemployment rate in their assessment of state revenue trends they risk delaying recognition of turning points in the NH economy and thus changes in state revenue trends.  Private sector employment and payroll growth slow before significant changes occur in the state’s unemployment rate and private sector employment growth is a better indicator  of trends in NH business tax revenue than is the state’s unemployment rate.  So the next time a public official brags about NH’s unemployment rate, ask him or her how many jobs were added in the state during the last month.

A Perfect Labor Force Storm

May 24, 2016

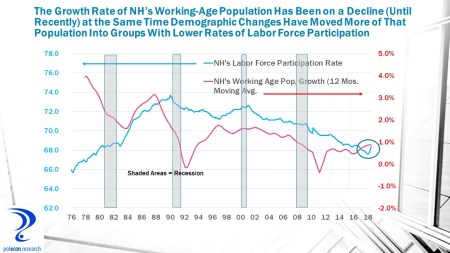
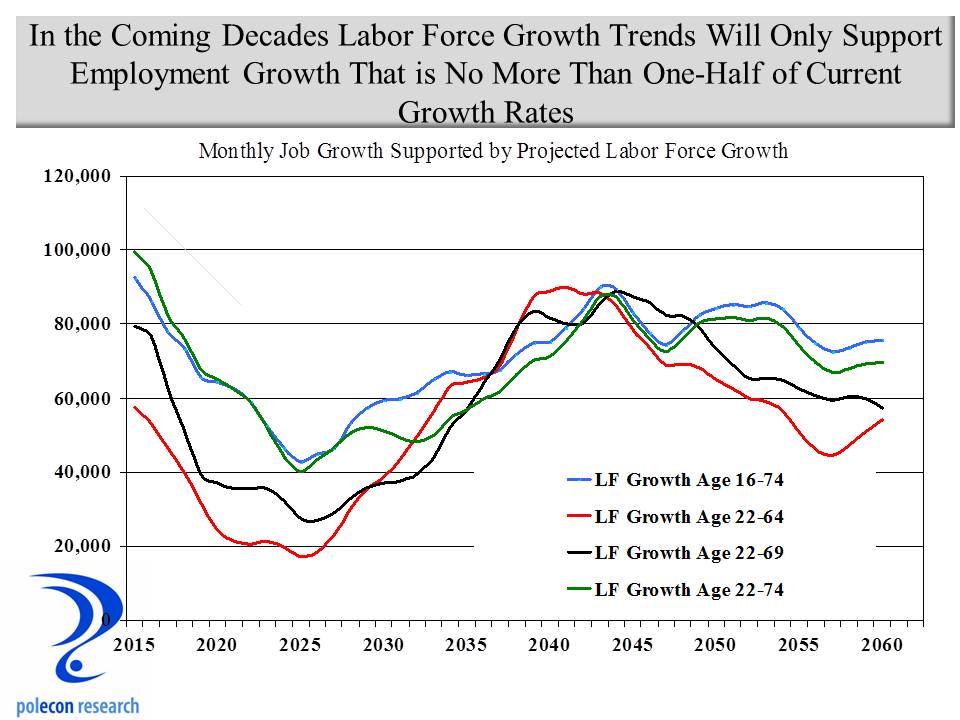
A perfect storm is brewing for the economy and individual businesses in NH and across the country.  Slow labor force growth, the retirement of baby boomers, and weak growth in labor productivity are severely limiting the productive capacity of the nation’s economy.  Between 2010 to 2015 labor productivity in the U.S. increased by just 0.5 percent on average annually, and the labor force by an average of just 0.4 percent.  Since the end of World War II, the combined, labor productivity and labor force growth in the U.S. had never fallen below 1 percent – until 2015 when it was just 0.9 percent. I have written about the the limits labor force growth place on the U.S. and NH economies here and here (and others).  Factors such as the flow of population (state-to-state migration and  international migration), and changes in labor force participation rates will play a large role in determining which states and regions are most affected, but a real possibility exists that the economies of some  states and regions could shrink over time.

Figure 1

A quick assessment of the potential impact of baby boom retirements across the country is illustrated in Figure 1 which shows the ratio of the population in each state that will (or could) be entering the labor force approximately over the next decade – that is individuals currently ages 5-19 –  to those who will (or could) be exiting the labor force – individuals currently ages 50 to 64.   The bars in the graphic that fall below zero indicate states that face more retirements from their labor force than new entrants over the next decade or more.  As the chart shows, the labor force in New England and much of the Northeast will be especially challenged by baby boom retirements as far more individuals will leave than enter the workforce.

In NH, the impact of baby boom retirements will vary greatly by industry.  The Millennial generation will soon be the largest segment of the labor force but their distribution across industries varies greatly.  For this analysis I examined the demographic characteristics of each industry’s workforce in NH.  Figure 2 presents the ratio of early career (age 25-34) to older workers (age 55-64) in major industry groupings in NH.  The graph suggests industries that will be more and less challenged by retirements of the baby boom generation.  Industries that have higher ratios employ more individuals early in their working lives than individuals nearing retirement age.  Several industries stand out for the high percentage of older individuals in their workforce.  Manufacturing is one industry that has had difficulty attracting younger workers and I have written about that issue long ago in this blog, Educational services is another.  Professional, scientific, and technical industries have a surprisingly low percentage of younger workers but an examination of this industry grouping at a more detailed level shows that the legal profession has among the oldest demographics of any industry in the state.

Figure 2

Looking at the age composition of workers in broad occupational groups in NH (Figure 3)  shows how much difference there is across different occupations employed in professional, scientific, and technical industries. The ratio of younger to older workers in the legal profession is just 46 percent, while in computer and mathematical occupations there are many more younger workers and the ratio is 127 percent.

Figure 3

Health care is also a field with a larger percentage of older individuals in the workforce but when the demographics are examined at a more detailed industry level or by specific occupations, it is clear that the industry is bifurcated – with physicians and other health care practitioners having an older demographic while many of the support occupations in the industry that have emerged as health care has become a much larger portion of the economy, have a much younger demographic.

Industry Growth is as Important as Industry Demographics

 The retirement of baby boomers only hints at the industries that could face the most significant labor shortages over the next decade.  Retiring workers may need to be replaced but they may not.  If employment in an industry shrinks or if it grows slowly over the next decade, then labor shortages are likely to be less severe than baby boomer retirements would suggest, even in industries with a higher percentage or older and retiring workers.

 To capture the impact of industry trends on potential labor shortages related to baby boom retirements I combined projected industry growth in NH over the next decade with the ratio of younger to older workers in each industry to produce a supply/demand balance metric.  For illustrative purposes I present the supply/demand calculations for broad industry groupings in Figure 4.  I did the same calculations at a more detailed (50+ industry) level but that level of detail is not amenable to presentation in a single graphic.  It is not possible to know what industries workers entering the labor force over the next decade will work in so these calculations are only rough estimates of potential supply/demand imbalances. As the chart shows,  industries with a relatively older workforce, such as manufacturing, public administration, and utilities, will nevertheless likely confront fewer labor shortages because of slower employment growth in those industries.  Unfortunately, all industries are likely to face shortages in some occupations that are employed and in demand across many industries.

Figure 4

What Can States and Business Do?

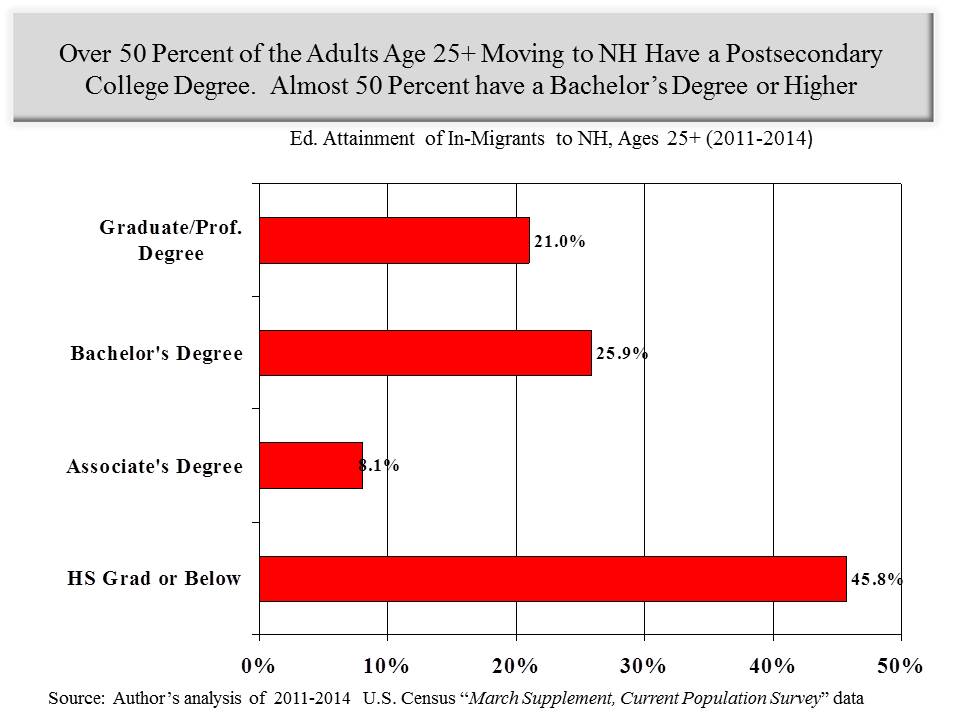
The primary shortcoming of Figure 1 is that it is a static representation of the demographics each state’s workforce.  The population and demographic composition of states are not static however.  People move from place-to-place, state-to-state, county-to-county, and country-to- country.  A state or region with substantial labor shortages that is also viewed as an attractive location can see increases in labor supply in response to labor shortages and wages that are rising in response to shortages.   For more than two decades attracting skilled individuals with higher levels of educational attainment has been a key to NH’s economic success, since the mid 2000s however, NH has seen fewer individuals moving into the state from other states.

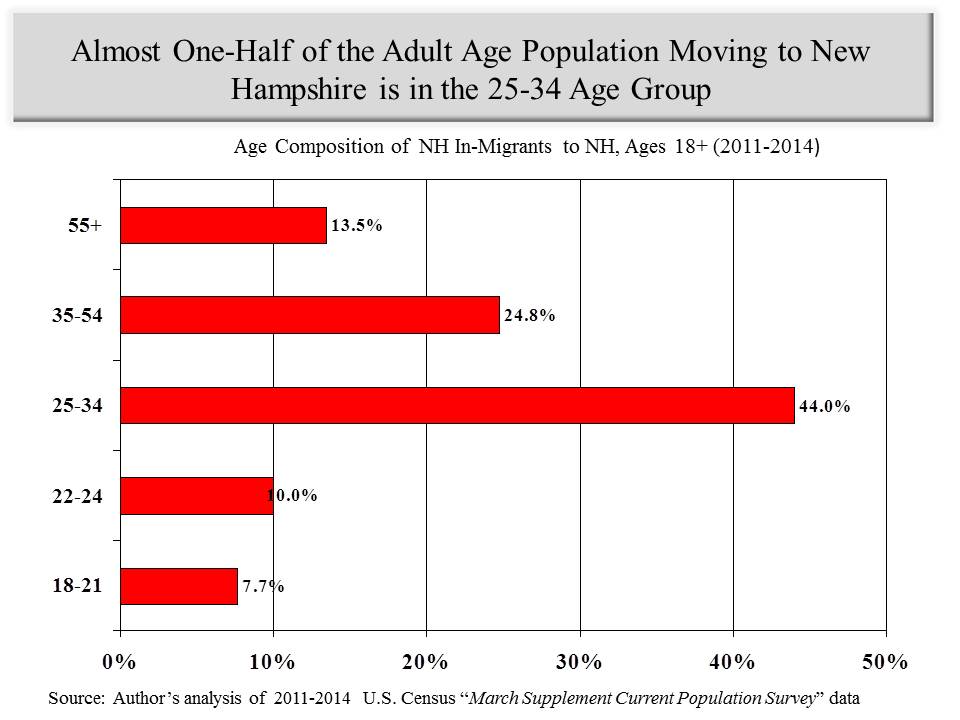
A popular meme in NH (and in many rural states) is that the state’s labor force challenges are largely the result of young people leaving the state.  But that is a phenomenon that has been occurring for decades in NH as it has in other rural states.   While it plays some role in the state’s labor force challenges, it has not been a key factor contributing to or detracting from NH’s economic performance – either NH’s strong successes of the 1980s and 1990s  or its subpar job growth of recent years. I wrote about who is moving to NH here, the chart below adds who (from an age perspective) left NH during the same recent 5 year time period.

Figure 5

I am not arguing that we ignore the issue of out-migration of youth, but a state budget in surplus along with the “migrating youth” meme is likely to produce proposals for labor supply policies that are likely to be as costly as they are ineffective.  In future posts I will examine the costs and benefits of several labor supply policies directed at increasing the percentage of young people in NH as well as the percentage attending college and remaining in NH after graduation.   NH is not monolithic, some communities and regions have been attracting younger workers and the age structure of their labor forces has not been increasing as rapidly as NH overall.  If policymakers want to attempt to change decades of youth migration trends then these communities are instructive of the types of actions that may or may not help NH capture higher numbers of workers early in their working lives.

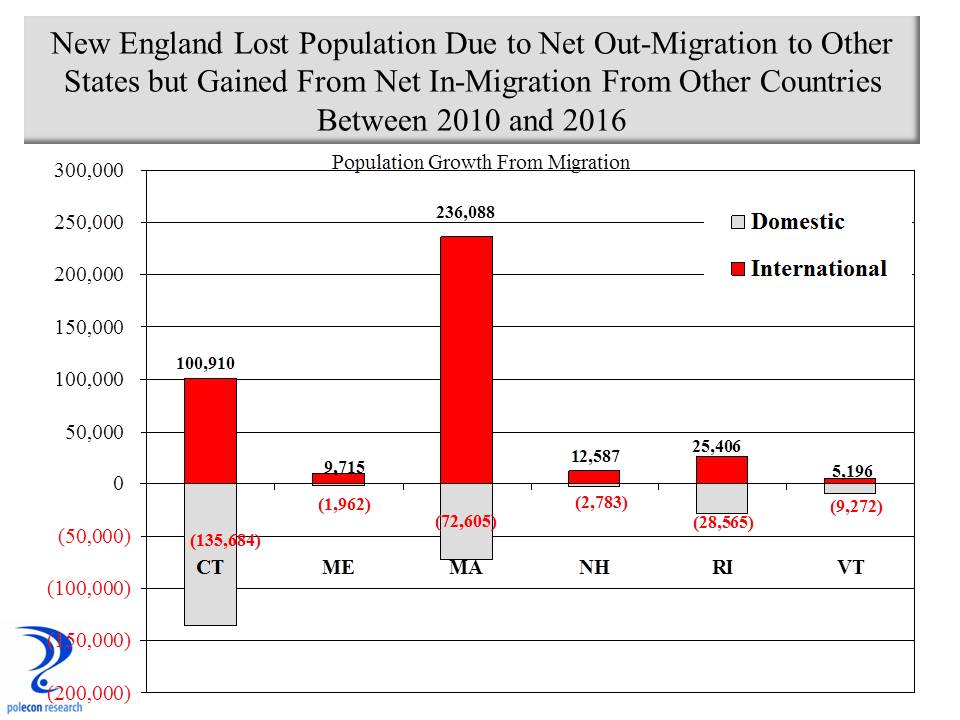
Still, migration along with changes in the labor force participation rate among different demographic groups are going to be the primary determinants of the magnitude of NH’s labor force growth in the coming decades. As Figure 6 below shows, net migration from other states (the # moving in versus the # moving out) has been negative in recent years. That is largely the result of a slowdown in people moving to NH rather than a substantial increase in those leaving the state. The chart also shows that net international migration has offset much of the recent loss from state-to-state migration.

Figure 6

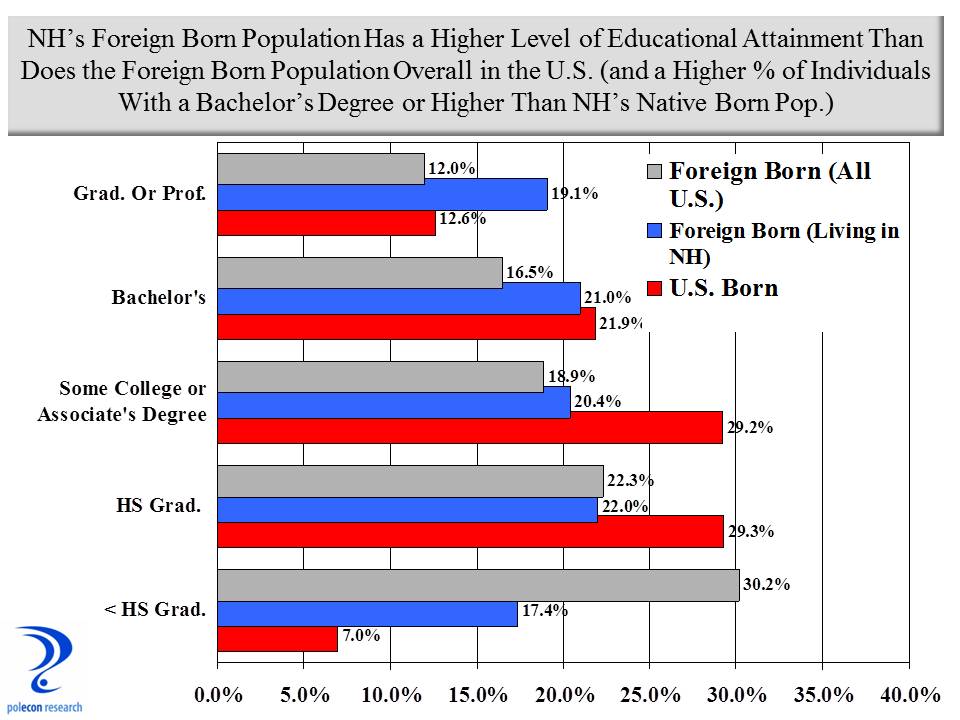
International migration of foreign workers into NH has played a critical role in meeting the demand for many occupations in NH.  Overall just under 8 percent of the labor force in NH is foreign born but in some occupations such as computer and mathematical occupations and life and physical sciences occupations, the percentage of foreign born workers in the NH labor force is over 20 percent (Figure 7).

Figure 7

The projections of labor supply/demand imbalances in this post don’t account for  potential increases in domestic or foreign migration but each of these will  play an important role in meeting the demand for labor in the Granite State.  Businesses have little control over net migration to NH so what can businesses do in the face of impeding labor shortages?  Here are some possible strategies to help businesses  meet their labor needs in an era of slow labor force growth:

  • Increase Wages and Pass Costs on to Consumers
  • Expand Automation and Increase Productivity
  • Move to Areas with More Labor
  • Increase Teleworking to Expand Potential Labor Pool
  • Tap the Untapped Labor Pools
  • Provide Incentives to Delay Retirement
  • Rely More on Contingent Workers
  • Recruit (and Train) Discouraged Workers.

These strategies are not available to all businesses or all industries.  Of all, I like providing incentives to delay retirement the best – it is the “revenge of the baby boomers”. More occupations today are less physically demanding and older citizens are healthier than any time in our nation’s history.  Combined, this should allow individuals to work (if they so chose) well beyond traditional retirement years.  For a long while now younger workers have been all the rage.  It is fitting that baby boomers who entered the workforce in numbers large enough to depress wages, and who have seen workplace cultures that increasingly look to appeal to the youngest workers, could see increasing demand for their services at the end of their working lives.


Oh The Damage Done

February 1, 2016

“I hit the city and
I lost my band
I watched the needle
Take another man
Gone, gone, the damage done.”  Neil Young, “The Needle and the Damage Done.”

Two years ago I wrote a report on the annual economic impacts of drug and alcohol abuse in New Hampshire.  It surprised many (and probably created much skepticism) with its findings of $1.84 billion in costs in 2012. Since my analysis of 2012 data the number of drug induced deaths in New Hampshire has almost doubled, from just over 200 to 400 and there is a greater awareness of the damage done in the state by drug abuse.

Time series drug induced deaths

What surprised me in 2014 was how much more advanced the data on the incidence of alcohol abuse and its negative impacts was than was the data on the incidence and negative impacts associated with drug abuse. I felt strongly then that my estimates of the costs of drug abuse were understating its true costs and I feel even more strongly about that today. Research on the negative impacts of alcohol use is more extensive, in part, because alcohol abuse affects more individuals and more individuals across a broader spectrum of the population. In addition, alcohol abuse has been identified as a major economic and societal issue for a much longer period of time. But I also think the relative lack of data and research on the societal and economic costs of drug abuse is, in part, a function of a tacit belief that drug abuse was largely a problem confined to individuals on the margin of society as well as some celebrities. In contrast, alcohol abuse has long been recognized as an affliction that does not discriminate along social, economic, or demographic lines. When the effects of drug abuse (or domestic abuse, human trafficking etc.) are seen to be confined to more marginal members of society it is easier to assign it a lower priority in the long list of public issues that should to be addressed. Increasingly common media reports about the dramatic rise in drug induced deaths, and drug use among a broader segment of society in New Hampshire and nationally, have raised the public’s (and policymakers’s) awareness of the socioeconomic breadth of the issue that long preceded the media’s attention. I couldn’t do my job well if I didn’t approach every analysis and every research project dispassionately but it is more than a little discomforting to me that our hearts today seem to be running around inside of reporters and journalists.

Me and my friends and colleagues in the business community frequently lament the fact that New Hampshire has among the highest electricity costs and highest business tax rates of any state in the nation, as well as the impacts that each has on NH’s economy. We should also be outraged by the fact that NH has the third highest rate of drug induced deaths per 100,000 residents among the 50 states, the tremendous costs that are associated with those deaths, as well as the costs associated with thousands of other users in the state who have not yet died from abusing drugs.

Drug induced deaths

The rates in the chart are age adjusted, meaning they are adjusted to reflect difference in the age composition of each state’s population. In the same way the rate of heart attack deaths per 100,000 in a state like Florida (a state with more older residents) would be expected to be higher than in a state like Utah (the youngest state by median age), a younger state would be expected to have higher rates of drug induced deaths. New Hampshire is not a young state so our 400 drug induced deaths among our population creates a staggeringly high ratio given the composition of our population.

Maybe the hearts of most of the members of the business community are inside of accountants (as if they have hearts) rather than journalists: we should find out as the economic costs of drug abuse continue to rise.

Who is Moving to NH and Why Does it Matter?

October 5, 2015

A lot of time and energy is expended fretting over young people and recent college graduates from New Hampshire moving to other states. It would be nice if many young people remained in the state but keeping a larger percentage of a shrinking demographic is, at best, a small part of New Hampshire’s longer-term demographic and economic challenges. New Hampshire, along with the rest of Northern New England has been a net supplier of 18-24 year olds to other states for decades and it that hasn’t changed much in recent years. It isn’t exactly a trade but what NH got in return, that is until the mid-2000s to the mid-2010s, was a lot of 30-44 year olds with high levels of educational attainment. The movement of individuals and families into New Hampshire during their early and mid-career years was what set New Hampshire apart from the rest of New England and the Northeast and it is what provided the fuel for the extraordinary rise in prosperity in the state from the 1980s to the early 2000s.

If NH becomes more attractive to young people that is great, but with the lure of several great and exciting cities so close, I don’t think our appeal to the youngest entrants to the working world is likely to be fundamental strength of our state. Still, I say go for it, it can’t hurt unless it takes our state’s “eye off the ball” of what contributed so greatly to our state’s prosperity. Take whatever actions to make our state a “hipper” place for young people as long as those actions also make NH even more attractive to those we have already proven we can attract and retain. Attempting to address whatever shortcomings NH has in the eyes of young people is a noble goal but no entity thrives for very long if it spends most of its time addressing its failures instead of feeding its successes. In this case, NH’s success is its demonstrated appeal to early and mid-career individuals and young families. After a decade of limited net in-migration from other states (more people moving in than moving out) and even net-out migration, in-migration to NH from other states is once again rising.

I confess to being a huge fan of the middle of the age distribution. Attracting those in the middle won’t give a state the lowest median age but it does help keep a state’s median age relatively stationary in the face of declining birth and mortality rates. More importantly, the benefits that individuals age 30-54 confer on an economy are much more important than are the benefits conferred by the 18-25 crowd. A younger workforce has been in favor since the 1980’s and capturing recent college grads is an obsession in NH and in many states, but in reality the strong economic growth that characterized the US and NH economies during much of the 80s and 90s, was, in part, the result of an increasingly high percentage of workers age 35-54, and a corresponding decline in the % age 20-34. In the aggregate, workers age 35-54 are our most productive. They have more accumulated expertise, knowledge and training than younger workers, at the same time they work more and are in their “peak” earning years. The high % of workers age 35-54 during the 1990s likely played a significant role in boosting our national and state productivity. The 35-54 age group works and earns earn more than older workers, boosting overall income levels and government revenues, at the same time this age group invests and saves more than the 20-34 age group, contributing to lower inflation and interest rates at the national level. As the chart below shows, NH’s period of strongest economic growth (as well as the nation’s) coincides with an increasing % of workers age 35-54.

Age comp of labor force

So, as I hurtle relentlessly toward the dying of the light I say three cheers for middle-age and let’s hope NH keeps attracting skilled, well-educated individuals and families in their peak working and earning years. My analysis of the last five years of NH data from the Census Bureau’s “Current Population Survey” suggests that is what is happening, boosting the prospects for accelerating prosperity in NH along the way. I examined the characteristic of some 22,000 individuals from the survey, over four years, who indicated that they had moved into NH during the prior 12 months period (I also examined the characteristics of those who moved out but that is another post). The age composition of in-migrants age 18 and older is presented in the chart below. It shows that the largest group of in-migrants was ages 25-34, representing 44 percent of the adult age migration to NH during the 2011 to 2014 time period. Another 25 percent were in the larger age 35-54 age group. New Hampshire will do quite well thank you very much if it can attract more of these individuals than it loses to other states each year. Net in-migration to NH resumed in 2013 and anecdotally appears to be accelerating in some parts of the state.

age comp of in migrants

As encouraging and important as the age composition is of in-migrants to NH is, the educational attainment of in-migrants is perhaps even more so. On that front there is even more encouraging news. About 55 percent of in-migrants age 25 and above hold a post secondary degree, with 47 percent holding a bachelor’s degree or higher. This is significantly higher levels of educational attainment than in the current population of NH residents age 25 and above.
ed attain of in migrants

I am waging my own private campaign (with limited success) to keep three of NH’s best and brightest young people in our state. Efforts to attract well-educated, early career and middle-aged residents aren’t nearly as exciting as campaigns to entice the young and the restless to remain or migrate to New Hampshire, but they are likely to pay greater dividends over the long-term for New Hampshire.

Jobs Just Don’t (and Won’t) Grow Like They Used To

June 29, 2015

A late boss of mine used to say “We all know the time when education in this country started to go downhill; it was the day after each of us graduated.” I am trying to not let nostalgia influence my views of the current labor market and prospects for job and economic and growth. In prior posts I have tried to make the case that slower labor force growth (and to a degree a skills gap) is the fundamental factor constraining growth in the NH economy. In my last post I wrote: “Looking ahead, population and demographic projections show that both nationally and in NH, the working age population (defined here as age 18-64) will show almost no growth over the next 25 years.” If that was written in another’s blog I would have dismissed it if it was not empirically supported, especially if it was as fundamental to the analysis as it was in my post. Regardless of whether you agree with or have even read the analysis in that post, the population and labor force trends it references are keys to understanding critical obstacles to future economic and employment growth.  In this post I provide some documentation and my interpretation of those trends.

It is important to make the distinction between growth in the “working age population” (which my prior post referenced) and “growth in the working age labor force,” (which is a more appropriate measure for the main thesis in that post.). While the two measures  move in the same direction, the magnitude of change can differ as the age composition of the population changes and as  trends in labor force participation among different age and demographic groups change over time. Longer-term trends (as opposed to shorter-term or cyclical trends – those affected by business and economic cycles) in labor force participation can mitigate or exacerbate some of the population trends affecting the size of the labor force.

“Prediction is very difficult, especially if it’s about the future”
—Neils Bohr, Nobel Laureate in Physics

First, let’s look at the assertion from my prior post that: “the working-age population …..will show almost no growth over the next 25 years.” That is a remarkably imprecise statement on which to base any analysis and its accuracy depends on your definition of “almost no growth,” as well as how you define the working-age population.  The chart below shows the U.S. Census Bureau’s “middle scenario” for U.S. population growth to the year 2060. In the chart I show four definitions of “working-age population” along with the cumulative growth rate of each. Three of the four definitions begin at age 22 to reflect the adult working age population. The three definitions include: ages 22-64 that recognizes a historical traditional retirement age at 65, as well as two others (ages 22-69 and ages 22-74) that reflect mortality, health, occupational, and retirement trends that have many individuals working beyond traditional retirement ages. To show that adding the younger population has relatively little impact on the trends I include a traditional definition of working-age population that includes individuals ages 16-64.

working age pop growth

The chart shows that the “adult working-age population” is projected to grow by about 10 percent over the next 25 years (between 2015 and 2040) in the first two (more traditional) definitions of working-age and by a much larger 15 percent for the definition that extends “working-age” population to ages 22-74. “Almost no growth” may overstate the decline in the rate of growth but, for me, 10 percent growth over 25 years is pretty close to almost no growth, especially by historical standards. I think the chart highlights the important role that older individuals could play in employment growth in the future. I like to call this the “revenge of the baby boomers” who first entered the labor market in competition with large numbers of other boomers and who experienced resulting demand for their labor that could not always keep up with the big increase in supply. Much later in life boomers who wish to continue working will likely see demand for their labor higher than it has been in the past for older workers.

The Distinction Between Population and Labor Force Growth

How growth in the “working-age” population translates into growth in the labor force is a function of the age composition of the labor force and the labor force participation rates among the different age groups in the population. Participation rates are highest between ages 25 and 54, much lower among teenagers, lower among 22-24 olds and much lower and declining at ages 55 and above. Thus when the population is growing in high participation age groupings (between 25 and 54) labor force growth will grow more similarly to population growth than when more of the growth in population is among younger (under 25) and older (55+ individuals). That is illustrated in the following two charts. The chart below compares cumulative population and labor force growth between 2015 and 2060 in the broadest definition of “working-age population” which here includes ages 16-74. Labor force projections incorporate a forecast of an increase in labor force participation rates for all age groups above age 55 (averaging about a 5% increase in participation rates) consistent with projections of participation made by the U.S. Bureau of Labor Statistics. The increase in labor force participation among individuals aged 65 and above is not simply a result of individuals who are not able to financially retire (although that does play a role), it is also a function of the better health of older individuals and a decrease in the percentage of jobs in the economy that are physically demanding, among other factors. For age groups in the middle age ranges there is a slight decline in participation rates (averaging about 0.4%), and for the youngest age groups a decline averaging 3.6 percent.

Combining the age distribution of the growth in the working-age population with trends in labor force participation shows that actual labor force growth among the population ages 16-74 is going to be much smaller than population growth because so much of the population growth will be among age groups with the lowest labor force participation rates.

16-74

When a the “adult working-age population” is examined (including ages 22-69), little difference between the cumulative population and labor force growth is seen, with time periods where growth rates are identical and some during which cumulative population growth is slightly higher.. This occurs because the combination of growth in the ages 55-64 population and an increase in the labor force participation rate of this age group compensates for the decline in participation among the youngest age groups and slower population growth in the high participation age groups (25-54).
22-69 growth

Population and Labor Force Growth Over the Next Several Decades Will Support Job Growth That is Less Than One-Half of Current Employment Growth Rates

Each of the graphs above show a labor force that is growing nationally (in fact some states will likely see an outright decline in their labor force). Because the charts show labor force growth it is easy to miss the significance of a slower rate of labor force growth on the U.S. economy and future job growth. Over the past three years the average monthly job growth in the United States has averaged about 200,000 jobs. Real labor force growth hasn’t been sufficient to accommodate that level of growth but because of the layoffs in the labor market during the recession there was enough slack (unemployed individuals and individuals temporarily out of the labor market) in the labor market to allow for that level of job growth. Eventually that slack will be taken-up and job growth will be more constrained because of labor force growth and wages will rise in response to tighter supply (that is just beginning to happen). That was the essence of my thesis about the interaction between NH’s business taxes and demographic and labor market trends.

During the non-recessionary years of the 1990’s the average monthly job growth in the U.S. was about 243,000. Those monthly job growth numbers include jobs going to individuals below the age of 22.  While my analysis primarily is concerned with the adult working-age population (ages 22+), including the labor force ages 16-21 into the analysis changes the population and labor force growth trends very little. Even including individuals ages 16-21 into labor force projections labor force growth will not support an increase in 200,000 plus jobs in the coming decades (except following a recession when substantial layoffs and slack in the labor market exist)..

To illustrate that point the chart below translates the annual increase in the nation’s adult labor force into a potential monthly job growth for the nation (if all of the increase in labor force were employed) under four definitions of the labor force. The chart shows that under a traditional (ages 22-64) or a maximum expansion (ages 16-74) definition of the labor force, annual growth will not sustain current or historical rates of monthly employment growth. During years of the highest labor force growth, jobs would grow only at about one-half the current monthly rate of job growth in the U.S.

LF to job growth conversion

Caveats and Conclusions

Long range forecast and projections are always problematic but the scenario of slower labor force growth and greater competition for labor outlined in this and my previous post will play out even if the degree to which it does has some uncertainty. Despite the overall U.S. trends it is important to note that population and labor force growth will vary greatly among states. Unfortunately NH and other Northeastern states currently are confronting trends that are on the negative end of the spectrum for population and labor force trends.

When the percentage of women in the labor force increased dramatically beginning in the 1970s the labor market was fundamentally changed and the growth potential of the economy was given a tremendous lift. There are no equivalent transformative changes on the labor market horizon. More individuals will work later into their lives but it won’t have the same economic effects as did the increase in labor force participation among half the nation’s population. In addition there has been on ongoing trend of declining labor force participation rates among young people that is, in large part I believe, attributable to the increase in post secondary school enrollments over the past few decades and this partially offsets increases in participation among older individuals. Perceptions of the need for and value of a at four-year college degree are increasingly being challenged so it is possible that the trend of lower labor force participation rates among the young may begin to reverse. The scenario presented here is based on the assumption that current international immigration and state-to-state migration trends will continue unchanged into the future. It is possible that if labor shortages are severe enough in the northeast, we would we see increased net migration into the region, and once again into NH.  But the potential pool of labor which NH can attract will be growing more slowly, making attracting “talent” to the state ever more challenging. That is one reason why I stress the importance of making states and communities attractive to individuals (of all ages) as well as attractive to businesses. Net inter-state migration to NH will likely increase from recent low levels, however, only if the state and its communities offer enough of the amenities and enough of a value proposition to justify that net in-migration. Finally, it is also possible that labor shortages will spur action to increase rates of international immigration to the U.S.. Prediction is indeed very difficult – especially when it is about the future. and especially when it involves a long horizon and as many variables as do population and labor force growth. But for now, my money is on the scenario outlined in this and my previous post.


%d bloggers like this: