Archive for the ‘Unemployment’ category

More Workers are Quitting Their Jobs and Getting Better Pay

August 7, 2018

U.S. job growth remains strong while real wage growth remains tepid despite a 3.9 percent unemployment rate nationally, but things may be changing. It is unlikely that companies can hold the line on wages – and depress real wage growth – when low unemployment encourages workers to quit their jobs in search of a higher salary. The rate at which workers are voluntarily leaving their jobs (the “quit rate”) is as high as it has been in 17 years (see graphic) as measured by the U.S. Bureau of Labor Statistics  “Job Openings and Labor Turnover Survey” (JOLTS).Quit Rate

This indicates a strong labor market where workers are confident that if they leave their job they can easily find another. The prospect for higher wages is a big reason. The Federal Reserve Bank of Atlanta’s wage measure for job switchers — people who leave one employer for another — reached 4.4% in March and is at 3.9% in June, well above wage growth for workers overall. It is a good environment for workers facing stagnating real wage growth to start looking for better pay, forcing firms to boost compensation to attract and retain employees. Although this is good for consumer spending, corporate profit margins may get pinched unless employers can cut costs elsewhere.

What the Unemployment Rate Doesn’t Tell Policymakers Can Hurt Us

June 22, 2016

Last week the NH Labor Market Information Bureau released the NH jobs report for May and as usual all of the attention focused on NH’s low (2.7 percent) unemployment rate.  The more significant story was the April to May decline of 4,000 payroll jobs in the state.

Private sector jobs in NH were lower by 3,400 in May, the largest one month decline since 2008 – with one exception – a month in 2014 when workers at the Market Basket grocery chain left their jobs in support of their ousted CEO.  May 2016 job losses were an out sized drop for any month of seasonally adjusted data (a decline of that size would more likely be seen in the not seasonally adjusted data where large changes in employment occur annually during certain months of the year).  I am inclined to attribute some, but not all, of the drop in NH’s May employment to problems with seasonal adjustments and other statistical issues.  Still, the May data marks the first time since 2011 that a three month moving average of private sector employment growth in NH has been negative.

3 mos avg change in private emp

For some added context on the NH payroll employment numbers I wait for a release from the U.S. Bureau of Labor Statistics, usually about one week after NH releases its state’s job numbers.  That monthly report provides employment, unemployment, labor force and other labor market data for all 50 states.  Here is a bit of the context provided in the June 20th release from the U.S. Bureau of Labor Statistics:

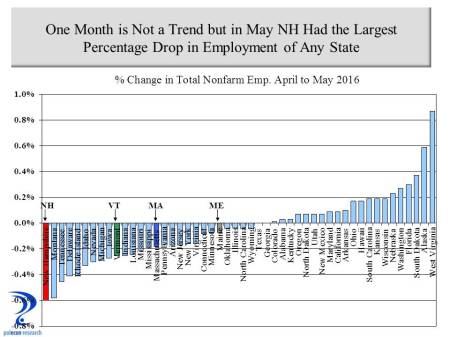
“In May 2016, four states had statistically significant over-the-month decreases in nonfarm payroll employment and three states and the District of Columbia had significant increases. The job losses were in Tennessee (-13,400), Michigan (-12,700), New Hampshire (-4,000), and Montana (-2,700). In percentage terms, Montana and New Hampshire had the largest declines (-0.6 percent each), followed by Tennessee (-0.5 percent) and Michigan (-0.3 percent).”

The term “statistically significant” decline in employment is important.  Twenty seven states experienced declines in nonfarm payroll employment in May but in only four of those states was the decline deemed “statistically significant,” meaning that the decline was large enough for the BLS to be at least 90% certain that the change in employment did not fall within the margin for error of the employer survey on which the employment estimates are based.

May emp change

It is not wise to be too concerned with one month’s job report.  Whether the  May job growth number is real or illusory and the product of statistical anomalies, the numbers for NH still should have attracted more attention (than a 0.1% uptick in the unemployment rate) from the media and especially from lawmakers and public officials.  The May job growth number is certainly more noteworthy than a slight uptick in the state’s unemployment rate that was the focus of most media reports.   As I noted in my previous post, employment growth nationally and in NH is going to slow and one bad month is not reason to panic.  But NH’s year-over-year percentage increase in private sector employment took a big hit with the May jobs report and the state’s ranking among states on private sector job growth did as well.  Private employment growth in NH has been on a solid pace for more than a year but with the May data NH moved from the top third to the bottom half among states on year-over-year private sector job growth.

Ranking Private Sector Job Growth

Public sector job cuts continue to be a drag on NH’s total nonfarm job growth, shedding about 2,500 jobs between May of 2015 and May of 2016, by far the largest percentage decline of any state in the nation.

Change in Govt Jobs May 15 to May 16

Still, while the May jobs report was troubling, initial unemployment claims are a very good leading indicator of economic activity and they remain subdued in NH and have yet to suggest a significant downtown in either the U.S. or NH economies.  The May jobs report also showed a continuation of the recent trend of solid labor force growth.

IUC

Implications for State Revenue

My primary concern about the May jobs report for NH, and with monthly jobs reports for NH in general, is how little attention payroll employment numbers get from policymakers and how much attention and importance is given to the state’s unemployment rate.  The state will begin crafting its two-year budget this fall and solid revenue gains over the past year and a budget surplus are building pressure for substantial increases in state spending.  This isn’t a commentary on the merits of specific spending proposals (I will save that for later posts) just a caution that the fiscal environment into which spending proposals will be entered can change and the need to recognize that change as far in advance as possible.  I would feel more comfortable about the upcoming budget process if NH’s weak May jobs number, and the possibility that weaker job growth will continue, were at least acknowledged by policymakers, state agencies, and the media.  I want to know that there is someone in NH’s wheelhouse focused on the horizon and not on our wake.   I understand the appeal of the unemployment rate as a single, intuitive metric that summarizes economic conditions but the unemployment rate is a lagging indicator of labor market and economic trends.  For policymakers and anyone who needs to assess the near-term economic outlook, using the unemployment rate as a guide is a bit like driving using the rear view mirror.   The unemployment rate is an important economic indicator that says a lot about current economic conditions, it is just not that useful for forecasting purposes. Moreover, NH’s demographics (fewer individuals in demographic groups that typically have high rates of unemployment) mean that the state will almost always have a relatively lower unemployment rate than the U.S..  Too frequently that leads lawmakers and others in NH to assume the state’s economy is performing better than it actually is and better than the U.S. economy.

Business taxes are a big reason that NH revenues have outperformed expectations this fiscal year, accounting for almost two-thirds (or $61.4 million) of the $99.4 increase in traditional taxes and fees over FY2015 during the first 11 months of fiscal year 2016.  Focusing on changes in private sector  payroll employment and wage growth is especially important for lawmakers in the Granite State and especially important as we head toward a budget making year.  As a lagging indicator of economic activity NH’s unemployment rate will remain low, even as the economy slows.

Emp Growth and Business Taxes

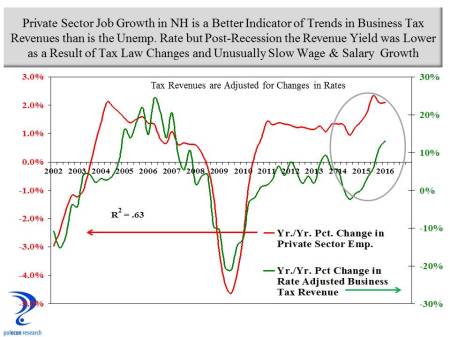
If lawmakers focus too much on NH’s unemployment rate in their assessment of state revenue trends they risk delaying recognition of turning points in the NH economy and thus changes in state revenue trends.  Private sector employment and payroll growth slow before significant changes occur in the state’s unemployment rate and private sector employment growth is a better indicator  of trends in NH business tax revenue than is the state’s unemployment rate.  So the next time a public official brags about NH’s unemployment rate, ask him or her how many jobs were added in the state during the last month.

Help Wanted Ads Drop, Labor Supply-Demand Ratio Rises

December 3, 2012

Online help-wanted ads in New Hampshire declined again in November according to the Conference-Board,  although the number of ads remains substantially higher than it was in November of 2011.  All occupational categories saw a decline in help-wanted ads with the exception of construction, production and transportation workers.  This is consistent with anecdotal and some empirical evidence about the demand for production workers impacting employment growth as discussed in a November 21 post.  For the second month in a row the largest percentage decline in ads was in professional, technical, and scientific occupations, although this broad occupational grouping still has the largest year-over-year increase in help-wanted ads in New Hampshire  between November of 2011 and November of 2012.

Help Wanted and Unemp

The chart shows recent trends in help-wanted advertising in New Hampshire, along with the ratio of unemployed workers in New Hampshire to the number of help-wanted ads, the “supply-demand ratio” for labor in the state.  After falling to about 1.4 unemployed persons for every help-wanted ad in the state, the ratio has been slowly rising and now stands at about 1.7 unemployed for every help-wanted ad.  Of course this ratio says nothing about the match between the occupations of job seekers and the occupations advertised in the help-wanted ads, but regular readers know it won’t likely be long before I offer another “skills gap” post that discusses that issue.

Equity in Unemployment

November 26, 2012

I started this analysis wondering if the percentage of jobs in professional, technical, and scientific industries in NH that are held by females is greater among younger workers in the industry than older workers.  I became sidetracked by the unexpected finding that the percentage of workers in those industries is about evenly divided between men and women (and as a spoiler the percentage that is female is larger at younger age groups – consistent with my “‘feminization of the NH workforce” theme from an earlier post).  One caveat before proclaiming gender equity in professional and scientific fields, the data do not account for the specific occupations in the industries.  That is, it is possible that the conventional wisdom that women are less employed in those industries is not supported, but the fact may remain that the more professional, scientific, and technical occupations in those industries (as opposed to the management, support and other occupations) may still be dominated by males.  Unfortunately there is data from different datasets that supports this thesis, although it does appear to be changing.

The chart below shows that women comprise about half of the employment in the broad industry grouping of professional, scientific, and technical industries.

The real kicker in the data is that it shows that reductions in employment in those industries came largely at the expense of female workers.  Again, this may just be a function of the reductions in those industries occurring in specific occupations more likely to be populated by females, a viable interpretation.  It may also be related to an increase in female employment among younger and newer workers in the industry who’s employment  may be most vulnerable in a recession.  Nevertheless, such a high percentage of  decline in those industries coming at the expense of female workers is well beyond what would be expected based on probability and chance alone.

Don’t Just Honor Them, Hire Them!

November 12, 2012

Today we honor veterans, at least that’s the idea if we can find the time between trips to the mall.  I hope you read about or  listen to their stories today.  If you happen to come by this blog, on this important day, here is one important story.  The unemployment rate among those who have served on active military duty  is higher than it is for those who have not served,  at all levels of educational attainment.  I am no expert on why, but I know it  is no way to thank men and women for their service.   Below is a chart that shows the unemployment rate among 25-34 year olds in New Hampshire, by educational attainment and whether or not they ever served on active military duty.    So honor them today for sure, but  hire them tomorrow if you can.

What Does the “Misery Index” Say About Election Results?

October 16, 2012

I am not a political analyst and this is not a political blog.  The polemics of political discourse are as tedious to me as the graphs I use with two Y axes are no doubt tedious to politicos. If you are prone to apoplexy or unable to view any data or information without an ideological lens, stop reading now.

Since Ronald Reagan closed a presidential debate with Jimmy Carter by asking “are you better of today than you were four years ago” that question has been a benchmark in every presidential election and with good reason because  the answer to the question is a pretty good predictor of election results.  But how do you operationally define “better off”?    The sum of the unemployment rate and the inflation rate is  referred to as the “misery index”, since a high reading on either one or both of the components would likely have a negative impact on household sentiment.  When the misery index is lower in an election year than it was in the previous presidential election, the party in power typically retains the presidency,  and when the misery index is higher, the presidency typically changes parties.  The chart below highlights the relationship.  The chart line shows the value of the “misery index” in the 3rd quarter of each year (just before the election) and each circular marker indicates a presidential election year.  The shaded markers indicate a change in control of the party in the White House.

With the exception of the 2000 election of George W.  Bush over Al Gore, when the misery index was lower in an election year than it was in the prior presidential election year, the party in power retains the White House and when the misery index is higher,  party control of the White House changes.   The chart suggests that the 2012 election should be close, but probably leans toward President Obama’s reelection.  Looking at the individual misery indices in  swing states also gives The President a slight edge.

The misery index doesn’t say much about NH’s gubernatorial election however.   The chart below shows that declines in the misery index (compared to 2 years earlier during the prior election for governor) do not appear to be associated with changes in party control of the governorship in the state.  The chart does does show that a change is more likely to occur in a year in which the gubernatorial election coincides with the presidential election.

Overall, however, the chart suggests that NH voters do not hold gubernatorial candidates responsible for weaker economic conditions nor are they likely to credit them for good economic performance.  Rather, they make their choices based on the perceived qualities of candidates.  Isn’t that refreshing?


%d bloggers like this: