There is a scene from the movie “Monty Python and the Holy Grail” where a wagon stacked with bodies is being pulled through a plague infested medieval village while a crier calls out “bring out your dead.” The comedy in that grim scene comes when a man tries to load a body slung over his shoulder onto the wagon and against the protests of the still quite alive “dead man” who says such things as “but I’m not dead,” I’m feeling better,” and “I think I will go for a walk.” I am reminded of that movie scene every time I hear proclamations about NH being the 1st or 2nd oldest state in the nation.
An excellent radio program in NH (especially when I am guest – I wasn’t on this broadcast) recently spent an hour discussing the implications of NH being “the second oldest state in the nation.” The operational definition of “second oldest state” was never given but I assume it is based on the median age of the state’s population. Using 5 year Census Bureau estimates (2010-14) NH has the third highest median age of any state in the nation (collective gasp here), behind only Maine and Vermont.
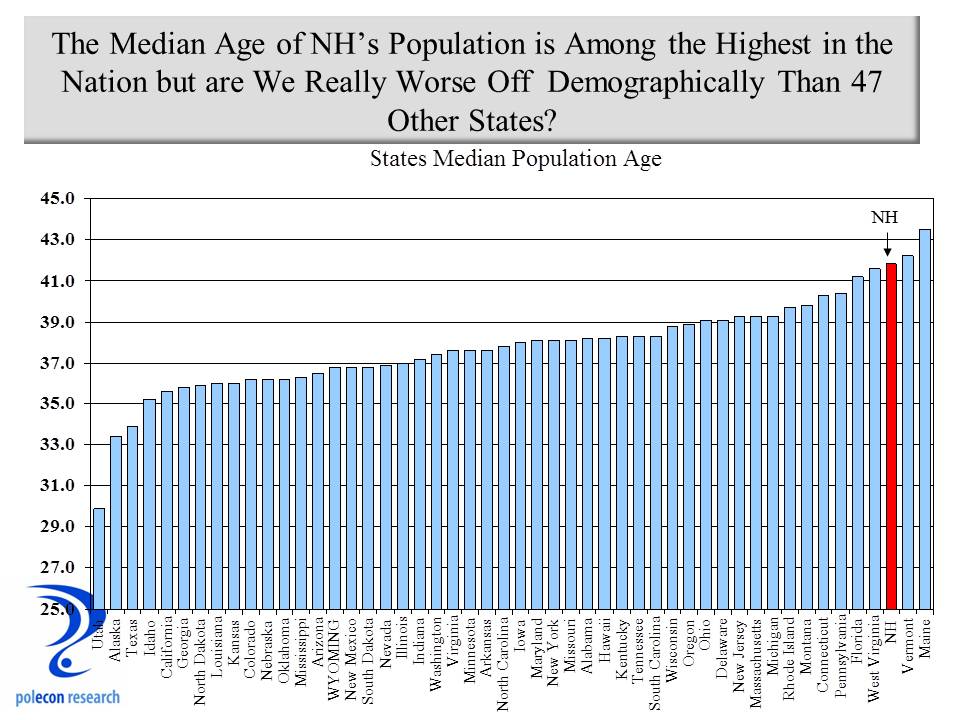
Before administering the sacrament of the anointing of the sick to New Hampshire, however, understand that a state’s median age says relatively little about the age distribution of a population and even less about the demographic and public policy challenges (and their severity) that a state will confront in the future. Does NH’s high median age really mean our state is worse off demographically than 47 other states?
First, a high median age doesn’t mean NH has a disproportionate number of elderly residents. It does mean, and has for some time, that NH has a high percentage of residents in the middle of the age distribution and fewer at early ages. As the chart below shows, on the percentage of the population age 65+, NH ranks 15th among all states and below many states with a lower median age.

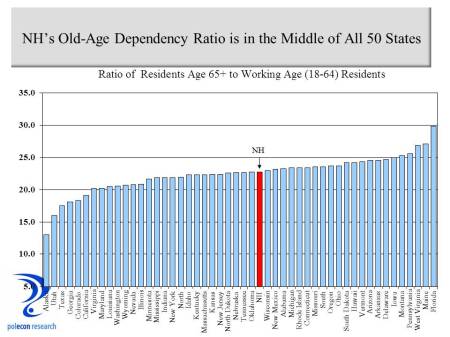
Second as I argued here, if you want to understand the strains that an older demographic may place on the fiscal system of a state or a nation you need to look at the “old age dependency ratio,” or the number of older residents in relation to the number of working-age residents because that is a measure of the population that will largely be paying for or supporting the services for the older population. There will be more elderly in NH and that will increase service needs but the fiscal pressures those needs place on the state is a function of both the number in need of services and the number of working age individuals supporting the services (that is why China’s “one-child” policy that results in four grandparents, two parents, and one child was always a demographic ponzi scheme). The old-age dependency ratio is rising in NH but again, on that metric, NH hardly looks that much worse off than most states as it is firmly in the middle of all states on the ratio of residents age 65+ to working age residents. In addition, because NH has relatively healthier and more well-off older residents compared to many states, our dependency ratio probably slightly overstates the challenge the old-age dependency ratio presents to the state. With NH’s lowest in the nation birth rates the old-age dependency ratio could rise rapidly depending on migration trends (as has been the case in recent years) and is one more reason to want to make our state broadly appealing to demographic groups.
NH does face significant demographic challenges and if overstating their magnitude is necessary for action to address them then I guess I can live with that. But too often the discussions of the demographic challenges facing NH are laced with agenda driven diagnoses and prescriptions that make for great headlines but ineffective policies.
Low birth rates (NH now has the lowest in the nation) resulting from high labor force participation and levels of educational attainment among women in NH (a sign of our state’s successes not our failures) along with low mortality rates among an older population that is both healthier and wealthier (on average) than in most states, is a recipe for a higher median age in a state. That is unless median age can be made more stationary through the in-migration of younger residents, or as NH has traditionally done, in-migration of residents more in the middle of the age distribution along with their children. That was exactly NH’s recipe for success for decades even as young people have left the state (a decades long trend in NH), at least until net state-to-state migration slowed in NH, just as it has been slowing nationally for some time. Between 2010 and 2015, the Census Bureau estimates that about 5,500 more NH residents moved out-of-state than residents of other states moved in, with about 6,700 more moving out of Hillsborough County than moved in, while about 4,500 more residents moved into Rockingham and Strafford Counties than moved out during that time. The graphic below disputes the notion that NH is no longer a place that people want to locate, they are just being more selective in where they choose to locate in the state. Examining the differences in population growth and demographic changes among individual communities within these counties further suggests some of the factors that can contribute to in-migration and inform public policies that seek to address NH’s demographic challenges. Not all communities experienced the growth or decline in migration characteristic of their counties. Understanding why is important to the future of our state and its communities. It is more than just nearby job opportunities or Hillsborough County would not have seen so much out-migration. I have written about some of the factors in prior blog posts.

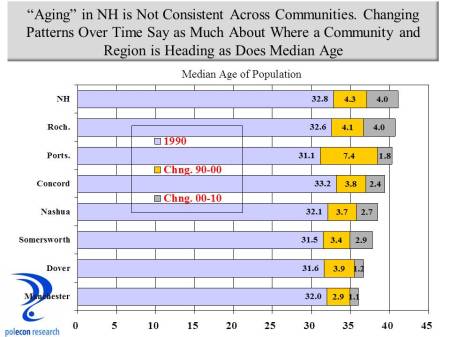
Many communities are aging more slowly than the state as a whole and their experiences are illustrative of some of the factors and actions that can influence the age structure of a state or a community. Yet policy discussions about demographics at the state level typically overlook positive demographic trends in many communities in the state. Below is a chart that highlights how the median age has changed over two decades in just a few NH communities. The chart shows the median age of each community in 1990, and then incrementally adds how much the median age has changed in each of the following two decades. There was relatively little difference in the median age of each community’s population in 1990, but especially in the 2000 to 2010 decade, the rate of change in median age varied significantly among the communities. Communities such as Portsmouth, which had a relatively high median age until 2000, slowed its rate of “aging” dramatically in the 2000s, as did Dover and Manchester, albeit for different reasons and with different demographics.
The point is that if some regions and some communities in NH can rage against the dying of the light, others and maybe even the state as a whole, can as well. So, while many want to heap NH onto a metaphorical “death wagon,” let me say “but NH is not dead, I think we should go for a walk today”.


