Archive for the ‘NH Economy’ category

Self-Inflicted Economic Wounds

July 11, 2019

For most of the past four years manufacturing employment has grown faster than total non-farm employment in NH, that is until recently. More recently manufacturing job growth has stagnated. A big reason for manufacturing’s job growth was the rapid rise in merchandise exports from NH. On a percentage basis NH exports have grown much faster since 2016 than have overall U.S. exports or exports from the rest of New England.

Exports of transportation equipment, primarily aircraft/aerospace parts and equipment have been the largest contributor to NH’s export growth, accounting for almost $1 billion of the state’s $1.23 increase in exports between Q1 2016 and Q1 2019.

Trade frictions, a slowing world economy, and developments in key export industries worldwide (slower demand for new non-defense and defense aircraft) have more recently combined to slow export growth with concomitant impacts on NH’s manufacturing employment. In the past I have argued that when the economy is strong the biggest mistakes are made, e.g. business and consumers borrow and spend too much, or in this case the government creates unnecessary trade barriers. We have little control over a slowing world economy but we need not exacerbate it by limiting world trade.

Not So Fast on NH’s Job Growth

March 14, 2019

The monthly payroll employment report gets a lot of attention. The monthly estimates are based on a survey sample of employers (differing from the monthly survey of households that is the source of unemployment and labor force estimates). Prior year monthly payroll estimates are revised early each year as more complete data (than the sample survey) are analyzed.  For a number of reasons (including the fact that newer firms are slow to get included in the survey) NH’s employment estimates more often than not have shown stronger (than first reported) job growth rates. Not this year. The new benchmark numbers have cut the state’s annualized job growth by more than half (to below 1%). The chart below shows the year-over-year growth rate in private sector employment in NH is about 1% (including government employment shows a slightly slower rate of job growth 0.8%).

Benchmark revisions

Early in 2018 I forecast NH’s job growth for 2018 would be about 0.6% (based on labor force constraints – not a weaker economy) and for several months I have been issuing a mea culpa for what looked like a significantly inaccurate employment growth forecast. While my sagacity is less challenged than I originally thought, I was more comfortable with NH’s employment trends when it was.

The Fed’s Revenue Loss is NH’s Revenue Gain

May 24, 2018

Federal corporate tax revenues have been on a downward trend since 2016.  That is unusual in a recovering and growing economy.  The recently enacted corporate tax rate cut from 35 to 21 percent has accelerated the downward revenue trend, a result expected by everyone with a thought process more guided by empirical evidence than  ideological orthodoxy.  The figure below shows how much more sharply corporate tax revenue has been declining since the recent cut in the U.S. corporate tax rate.  Each point on the graph’s line shows the sum of the prior 12 months of U.S. corporate tax collections. Thus, the large recent drop in the 12 month sum of corporate tax collections (as of April 2018) includes only a few months of the new lower rate, yet it still shows a precipitous decline in annualized revenue.

Fed corp tax revenue

I would like to have seen more real “reform” along with a more gradual corporate rate cut (along with some spending reforms to limit impacts on federal deficits) but the U.S. and New Hampshire business tax rates were too high and needed to be cut.    Still, no one who has even a cursory knowledge of the research and evidence on corporate tax cuts expected that such a large rate cut from 35% to 21%  would actually increase corporate tax collections. The best that can be said about the impacts of a large corporate tax cut is that it will lose less revenue over time. That doesn’t mean that a tax cut will always result in an absolute decline in revenues, although that has clearly been the case with the recent U.S. tax cut.  Revenue can still increase with a small rate cut even though revenues may be lower than they would have been had rates not been cut .  That is the case with New Hampshire’s very modest, recent cuts in business tax rates.  Business tax revenues (for the most part) continued to increase in NH but at a slower rate of growth  after the cuts where enacted.

New Hampshire is expected to have a more than $100 million budget surplus by the end of fiscal year 2018.   New Hampshire risks drawing two inaccurate conclusions from this  surplus and the recent sharp increase in business tax collections that is largely responsible for it.   First, that the small drop in 2017 in the state’s business profits tax (BPT) rate from 8.5% to 8.2%, and business enterprise tax (BET) from 0.75% to 0.72%, is responsible for the recent large increase in NH business tax revenues and subsequent state surplus.  Second, that a larger rate cut would produce even more business tax revenue and perhaps an even larger budget surplus.   Again, the rate cuts were needed but NH should understand that the rate cuts have not, and will not in the future, lead to a surge in business tax revenue.  If NH’s business tax cuts had actually produced more revenue (than if rates had not been cut) the growth rate of business tax revenue would have increased following the rate cuts.  In fact, the growth rate in business tax collections declined after NH’s rate cut took effect for tax periods beginning after December of 2016. That is until the federal government lowered its corporate tax rate.  Again, it’s not that business tax collections actually declined, the U.S. and NH economy were strong and profits were increasing,  it’s just that NH, by marginally lowering tax rates, decided to capture a little less of those profits and thus the growth rate of business tax revenue declined.

NH Business and other source Revenue Growth

The figure above shows that the annualized growth rate in NH’s business tax revenues declined throughout much of 2017 (although the final months showed some modest reversal of the trend). Annualized revenue growth jumped dramatically, however, in the first four quarter of 2018, after the cut in the federal corporate tax rate.  The chart also shows that the growth rate of NH’s seven largest sources of general revenue – other than the BPT and BET – that are dependent upon economic conditions and economic activity in the state (meals and rentals, liquor commission revenues, tobacco, real estate transfer, communications services, interest and dividends, and insurance taxes) are growing much more modestly, below the trend from recent years, and certainly not enough to produce a $100 million plus budget surplus.

Clearly business tax collections are responsible for NH’s large budget surplus, but it  is not accurate to say that the increase in business tax collections reflects a “booming NH economy” as many in the state argue.   NH’s economy is strong but not exactly “booming” (1.3% year-over-year job growth ranking 21st nationally, and 1.9% GSP growth ranking 26th) and not nearly strong enough to produce the kind of business tax revenue growth that the state has seen in recent months.  Excuse this brief sidetrack (it is a pet peeve) but don’t assess growth in NH’s (or any state’s) economy  on the basis of a state’s unemployment rate.  Hawaii, at 2.1%, currently has the lowest unemployment rate in the nation followed by NH and North Dakota tied at 2.6% – but here is the thing, over the past year the North Dakota economy has lost 1.3% of jobs (the worst growth rate in the nation), while NH added 1.3% more jobs (21st among all states).

State Unemp. and Job Growth

The same is true when state unemployment rates and the annual growth in state gross state product (the broadest measure of economic growth) are plotted (chart below).  In 2017 NH tied with Michigan for 25th among states for growth in gross state product (at 1.9%),  despite NH having a 2.6% unemployment rate while Michigan’s rate is 4.7%.  The scatter plots above and below urge caution in using unemployment rates to gauge economic growth in a state,  especially now that slow labor force growth is contributing to low unemployment rates and acting as a binding constraint on economic growth in many states.

State GSP Growth and Unemp

Growth in NH’s business tax revenue has historically tracked private sector employment growth in the state.  To show just how unusual the recent growth in NH’s business tax revenue is in relation to job growth in the state look at the following chart which shows how far, by historical measures, the recent growth in revenues has outpaced NH’s private sector employment growth.

Nh Business Taxes and Emp. Growth

Private sector job growth has picked up in recent months (defying reported growth in the size of NH’s labor force –  and suggesting to me that NH may be (re)capturing some of the state’s labor that has been working outside of NH – but more about that in a future post).  However, growth in business tax revenue has far exceeded that which historically accompanied similar rates of job growth.  Changes to federal corporate tax laws are a primary reason for the out-sized boost in NH’s business tax revenues, so whatever you think of the recent federal tax reform you can thank the feds for their role in creating NH’s current budget surplus.  The NH Department of Revenue provided lawmakers with a briefing on what tax reform could mean to NH’s revenues but they were rightly cautious in making a dollar forecast of impacts.  But a summary of their analysis of impacts suggests that more of the provisions of federal tax law will increase rather than decrease NH revenues.

The impact on NH revenues of federal corporate tax collections is also apparent when comparing annualized growth in federal corporate and NH business tax revenue in recent years.  The chart below shows how dramatically different are the most recent trends in business tax revenue growth at the federal and NH state level.  In addition,  surprisingly (to me at least), this inverse relationship seems to occur over the longer-term as slower growth in federal corporate tax collections since the recession are associated with higher growth in NH state business tax collections (and vice versa), despite the fact that economic growth in NH lagged U.S. growth during much of the recovery from recession.

Federal and NH Business Tax Growth

I have argued in prior posts that lawmakers should be cautious in budgeting because revenue growth in NH, although growing, was growing  more slowly.  I did not foresee a $100 million budget surplus but who did, and who knew what the impact of federal tax reform would be.  No public hearings or discussion of the federal tax reform proposal were held and in any case nobody was certain whether changes in corporate tax laws would pass.  Growth trends in most of NH’s key sources of state revenue have been modest even as federal tax reform quickly and dramatically altered NH’s business tax revenue trends, greatly improving the state’s fiscal position in the process.   I believe that fundamental underlying revenue trends still argue for caution in state budgeting, but when the federal government’s actions contribute to a state surplus NH is happy to say “yes please and thank you.” Lawmakers would be wise , however, not to assume that cuts in the state’s business taxes are responsible for the growth in state tax revenues or that larger cuts will add to the surplus.

The Best of Times, The Worst of Times

February 16, 2018
“It was the best of times, it was the worst of times, it was the age of wisdom, it was the age of foolishness, it was the epoch of belief, it was the epoch of incredulity, it was the season of light, it was the season of darkness, it was the spring of hope, it was the winter of despair.”
– Charles Dickens, A Tale of Two Cities

The U.S. economy is currently in the third longest period of uninterrupted expansion in its history, soon to be the second longest, and there is a better than even chance it will become the longest in history 16 months from now.  Even without the recently enacted deficit-financed stimulus (tax cuts and expenditure increases) the U.S. economy was on solid ground, with growth forecast to be stronger in 2018 than it was in 2017. That is what makes lack of concern over the projected increase in the government’s annual deficit from about $700 billion to $1 trillion especially troubling.

Expansion

The current economic expansion is exceptional in duration and atypical in gaining strength late in the economic cycle.  But it is also about to become notorious for producing a burgeoning federal deficit during a period of solid economic growth (annual federal deficits are generally inversely related to economic conditions).  So the price of  stronger growth and a longer expansion is looking like higher annual budget deficits (forecast to grow from 3% of GDP to 5% just by 2019) and a national debt that will grow from about 76% of GDP to 97% over 10 years, risking longer-term economic growth.  It is a high price to pay for a small increase in economic growth and a fiscal policy gamble to add stimulus to an economy near full employment but it is  price that the administration and congress are willing to pay without hesitation.

Annual deficits declined between 2012 and 2016 as the economic recovery strengthened and costs associated with the “stimulus” eroded.  But since early 2016 deficits have been increasing.  The difference between monthly revenues and expenditures over the most recent 12 twelve months (between February 2017 and January 2018) shows that the annualized federal deficit stands at $682 billion compared to $585 billion for the February 2016 to January 2017 time period, a 17% increase over the year and up from a low of $405 billion early in 2016.

Deficit

The increase in the deficit results from both higher spending and a slowing rate of revenue growth (chart below), and it comes before the impacts of recently enacted tax cuts and the two-year spending agreement take effect that will both lower revenues by about $1 trillion over the next decade (even after accounting for growth effects) and increase spending by about $300 billion just over the next two years.

Spending and revenues

The U.S. has had higher annual deficits in the past, but always during a period of weak or negative economic growth.  Increasing deficits and greatly adding to the nation’s debt in the absence of an economic downturn should have been a giant caution sign for lawmakers.  If  $400 billion annual deficits were “crippling” our economy in 2016 (as some lawmakers suggested) how are $1 trillion deficits in a growing economy not of more concern?  Debt is often the match that lights the fire of economic crisis, whether the fault was with politicians, central bankers, overzealous consumers, businesses, developers, bankers, credit rating agencies, regulators, or any combination thereof, all true crises involve too much leverage.

With that admonition (screed?), reducing the corporate tax rate was still a good idea, the U.S. rate was too high. And yes, a lower corporate tax will raise wages eventually (lower taxes increase capital investment and improve productivity – raising wages), but only after years, and certainly not in the time frame suggested by the White House. But just as important (and largely a missed opportunity in the legislation) was the need to eliminate targeted and industry-specific preferences that direct too much investment to tax-favored activities rather than to their most productive uses.  Many of the agreed upon expenditure increases also have merit.  Overall, however, the combination of tax and spending policies recently enacted seems poorly structured and ill-timed.  If we enact a deficit funded stimulus when we are near full employment and when the economy is already poised to grow more rapidly, what will we be able to do when the next recession arrives?

Impact on State Finances

The New Hampshire economy is fundamentally strong, our industries are as vibrant and innovative as ever and the state’s economy would be growing and producing more if the supply of labor could accommodate more growth. It can’t, labor force growth is not keeping pace with labor demand and economic growth has been slowing in New Hampshire for at least two quarters. It will continue to do so in 2018. So too will state revenues.

Job and LF Growth

State-level GDP estimates produced by the U.S. Bureau of Economic Analysis are reported with a long lag and are not a very timely indicator of current state growth trends.  A useful proxy for assessing growth trends in state-level GDP is aggregate hours worked in the state (employment times the average number of hours worked) which correlates well with changes in the state’s total output of goods and services (GDP).  Adding current estimates of U.S. productivity growth (there is no similar state-level measure) provides a high-frequency estimate of the state’s GDP growth trend.  As the chart below shows, the growth rate of NH GDP is declining, again, primarily because the rate of employment growth is declining.  When you are adding fewer workers the output of the state’s economy will grow more slowly unless there is a significant increase in productivity (it has increased some but not significantly).

Aggregate Hours Worked

Slower employment and economic growth in NH (along with changes in revenue policies) have slowed the rate of revenue growth in the state since 2016.  There has been a bump in the past few months but how the recently enacted tax cuts at the national level will affect the trend is uncertain.  What is certain is that the growth constraints NH faces will make it difficult to accelerate economic growth in the state and thus state revenues.

Looking at annualized revenue growth (summing any 12 month period), the chart below shows that revenue from NH’s nine largest sources of general revenue (and the sources most affected by economic trends) hit a plateau in 2016, at a time when employment growth was at its post-recession peak.  Since that time, annualized growth in the revenue sources most affected by economic conditions has slowed.

Revenue

 Looking at the rate of change in annualized state revenues illustrates the longer-term slowing of the rate of annualized growth.   The chart below shows how significantly the growth rate in revenues has slowed since 2016.

Revenue Growth Rate

Expenditure Pressures Will Mount

The impact on state revenues of recent changes in federal policies may be uncertain but their impact on state and local government is likely to add to the state’s fiscal pressures.  A great deal of uncertainty exists over how funding for state-operated programs that share costs with the federal government will be affected but most signs point to less funding for programs like Medicaid and infrastructure.  The administration’s recently announced $1.5 trillion infrastructure proposal actually reduces funding for states while calling for greater state commitments.  Proposals to cap or block-grant Medicaid funding would significantly add to the fiscal pressures facing all states.  At the same time mandatory spending on things such as government pensions are poised to increase significantly in coming years.

Other recent federal policies will affect states and localities by increasing the cost of borrowing.  One change eliminated the tax-free status of “advance refunding bonds” that allow states and communities to refinance debt at lower interest rates well before their call date in order to free-up funds for other purposes.  The prospect of annual deficits of more than a trillion dollars (placing greater demands on credit markets) during a strong economy when deficits typically fall, has also increased expectations of higher interest rates, increasing the cost of borrowing by governments, households and businesses.  How fast and how much rates rise is not certain but they have already increased significantly this year (albeit from low levels.)

Less directly, federal tax law changes will affect the borrowing costs of state and local governments by making municipal bonds less attractive (relative to other loans and investments).  Banks and insurance companies are big buyers of municipal bonds – lending money to state and local governments.  The interest rate that governments have to pay on those bonds is lower than on other types of loans made by banks because banks and insurance companies do not have to pay taxes on the income they earn from loans to governments.   The drop in the corporate tax rate reduces some of the advantage of the tax- free bonds and makes other loans/investments made by banks and insurers more attractive relative to municipal bonds.  Interest rates on municipal bonds will have to rise to remain competitive with other loans.

Along with slower growth in state revenues there are enough spending pressures building along with potential impacts from recently enacted federal policies to suggest  lawmakers in the state would be wise to be cautious in the next budget cycle that begins in the fall of this year.

The divergence between economic and fiscal conditions doesn’t seem to be troubling to many policymakers at the federal or state level.  With apologies to Dickens, it does feel like “it was the best of times, it was the worst of times.” Let’s hope that it isn’t also becoming “the age of foolishness.”

Great Expectations

June 6, 2017

“Take nothing on its looks; take everything on evidence. There’s no better rule.”        

    Mr. Jaggers to Pip,  in Charles Dickens’ “Great Expectations”

Optimism in the U.S. economy has been high for most of 2017.  Consumer and small business confidence are both higher than they have been in a decade  and according to the Business Roundtable the CEO’s of America’s largest corporations haven’t been this optimistic in eight years.

Sentiment

From survey data alone the U.S. economy appears to be booming.  But the hard, quantifiable data (1.2 percent GDP growth in the first quarter of 2017) tells a story of more tepid growth.  The degree of divergence between soft (survey and sentiment data) and hard economic data is striking and either consumer and business sentiment will lead to higher rates of growth or sentiment will begin to wane – something has to give and my money is on the latter.

The divergence between sentiment and actual economic performance can be especially problematic for lawmakers crafting state budgets.  With so much economic optimism it is easy for those urging caution in budgeting (based on expected revenue) to be the skunks at the garden party. I don’t know who has the best revenue estimates on which to base NH’s next budget but the trends I see (and present later in this post) urge caution in assuming current levels of consumer and business optimism will be matched by revenue growth.

Still, the economic recovery remains on track (albeit at a modest pace by historical standards) and it has a better than 50/50 chance of becoming the longest expansion in U.S. history by lasting into the middle of 2019.

Length of recovery

The current expansion is getting old but expansions don’t die of old age; something kills them (think the savings and loan crisis in the 1980s, the dot com bubble in the early 2000s, and the mortgage and financial crisis of the recent recession).  Right now, the economy does not seem to be harboring the kinds of excesses and imbalances or overindulgence that have presaged sharp slowdowns or recessions in the past. There are some areas of concern; at more than 20 times earnings, stock market valuations (depending on which index is used) are well above the 15-17 time earnings that is the historical average, but this is not at the “irrational exuberance” stage.  Economists tend to write-off or disbelieve negative economic data as statistical anomalies or due to temporary factors prior to slowdowns and lately a bit more of that has been occurring than I am comfortable with.  But even as there are some unflattering economic indicators that should be acknowledged they are still too new to be trends.  No one is saying the “r-word” and the best we can say today is that we are one day closer to the next recession.

There is no more important task for policymakers than estimating revenues. Underestimating state government revenues results in more needs being unmet than is desirable, while overestimating revenues can lead to difficult and painful spending cuts in later years. So why should NH lawmakers be cautious in their revenue estimates in a time of optimism and apparent abundance?   As Dickens (Mr. Jaggers) would say “take nothing on its looks; take everything on evidence.”   In the case of state government revenue the “looks” are reports of a booming economy and high confidence while the “evidence” is real trends in revenue growth.   Analysis and empirical evidence are not currently in favor as tools for governing, at least at the national level, but the great majority of lawmakers in NH value data and evidence and do their best to employ rigor in the budgeting process.  But a focus on monthly revenue reports and numbers can sometimes make it difficult to separate the signal from the noise in the revenue trends. In addition, while it is important to note how actual revenues compare to “planned” revenues on a monthly basis, revenues can meet “planned” expectations at the same time they are signaling a weakening trend.  Thus it is possible that lawmakers can be optimistic that revenues meet or exceed expectations in any month at the same time revenue growth is slowing.  Which is the more important trend?  When I look at the larger trends in state revenue collections from NH’s nine largest sources of own source, general revenue, I see a slowing growth trend even as revenues have generally met monthly expectations.  The chart below shows the year-over-year percentage change in annualized (sum of prior 12 months) state revenue collections.

Annualized NH revenues

Examining NH business tax collections reveals a similar trend of a declining rate of growth.   The chart below shows the rate of change in annualized (sum of the prior 12 months) business tax collections, along with the trend in rate-adjusted revenue to control for the impacts of rate changes on growth rates.

Annualiz NH Business Taxes

The growth rate of meals and rental tax collections in NH (more commonly called meals and rooms) has also slowed.  The chart below shows annualized growth in spending on meals and rooms in NH.  Because the data shows spending on meals and rooms rather than tax collections the data is free from any changes related to tax rates.

Meals and rooms trend

Many factors influence rooms and meals and hospitality expenditures in the short-term (weather, gasoline prices, etc.) but the most fundamental factor that determines longer-term (longer than month-to-month) trends in meals and rooms expenditures are employment and earnings trends in the state and New England region.  Employment continues to grow but at a somewhat slower rate as the nation and the region confront full-employment and labor shortages. Wage growth is occurring but prices are also rising and as the figure below shows, real (inflation adjusted) earnings growth has been trending downward in the U.S. and New England (the same is true for NH).  The result is that the rate of growth of consumer expenditures, in almost all expenditure categories, has slowed.  The chart below presents an estimate of trends in the growth of real earnings (employment times the average hourly wage times average number of hours worked and adjusted for inflation) in the U.S. and New England.  The earnings of New England residents and their ability and willingness to spend have a significant impact on several NH revenues.

Real Earnings Growth

The relationship between spending on meals and rooms in NH and real earnings in New England (lagged) is evidenced in the graph below.

M&R and NE Earnings

I don’t know who is more accurate in estimating revenues in the current debate over the state’s next budget.  There is a case to be made for different expectations.  As long as policy decisions are made based on some empirical interpretation of trends in the economy and revenues rather than an ideological push for more or less spending I think the state will be fine regardless of what lawmakers decide.  I am frequently in error but rarely in doubt and I’ve presented one of what are many interpretations of revenue trends in NH.  Despite what I see as a lot of unmet needs in the Granite State, the trends highlighted in this post urge caution in pillorying anyone who argues for fiscal restraint at a time of so much economic optimism.

Not With a Bang But With a Whimper

July 26, 2016

The U.S. economy is currently in its 86 month of an economic expansion that began in the summer of 2009 according to the National Bureau of Economic Research, the organization that officially dates U.S. business cycles. If the expansion lasts another seven months (as it will), it will be the third longest economic expansion in our nation’s history, trailing only the 120 month expansion from 1991 to 2001 and the 106 month expansion from  1961 to 1969.

The probability of recession in the next six months is low but the business cycle hasn’t been repealed, another recession will occur and almost certainly sometime before the end of 2019.  It’s just that none of the excesses – wage and price growth, high energy prices, inflationary pressures, inflated asset values, etc.- that have preceded past recession are much apparent in today’s economy and there aren’t signs that any are imminent.  What will make the next recession unique in the post WWII era is that it may very well occur before the nation has fully recovered from the previous recession, despite how long the current recovery has lasted.  “Fully recovered” here means that the actual output of the nation’s economy (GDP) reaches its potential output (for a brief explanation of actual and potential output of the economy see this Congressional Budget Office publication). This is somewhat akin to feeling the effects of a hangover in the morning despite not having enjoyed the celebration the night before.  Unlike the last recession, or most recessions, the next one may not begin with a bang but rather with a whimper.

No expansion can last forever; the U.S. and the NH economies are showing signs of slowing so it is difficult for me to believe that the nation can avoid slipping into recession sometime during the first term of our next president.  If that President is named Clinton it will most likely mean a one-term presidency as three consecutive terms for an incumbent party (relatively rare in itself) along with a recession in the third term (unless is happens very early in her term allowing sufficient time for growth prior to 2020) would almost certainly result in the nation looking for a change in the party controlling the White House.  If the President is named Trump he will no doubt blame the recession on the past administration and that may help give him a pass in 2020, but a recession will challenge his claim as someone who knows how to create jobs, while his penchant for populist and nationalistic themes aren’t generally viewed as monetary and fiscal policies effective in combating a recession.  His administration’s and his personal  response to the recession might determine his fate (does anyone else remember the images of the first, single-term, President Bush zooming around in his cigarette boat off the coast of Maine while the U.S. was in the middle of the 1990-91 recession?).

The past two months have been marked by one very bad and one very good month for job growth in the nation and in NH.  I  advocate looking at three months of job growth numbers in discerning employment growth trends and a prudent man would wait for the release of the nation’s July job growth numbers on August 5th before making any proclamations about the direction of the U.S. or NH economy.  But a prudent man doesn’t write this blog and I am comfortable knowing that when you right too early it often seems like you are wrong so here are a few of the more accessible  indicators that I believe suggest slower economic growth moving forward.  There are others but jobs and revenues are what interest policymakers most so they are highlighted here.

  • The rate of private sector job growth has slowed.
  • The number of industries that are adding jobs versus the number shedding jobs (the employment diffusion index) has declined.
  • Help wanted advertising is declining.
  • Nationally, state corporate income tax collections appear to have peaked.

Slowing Private Employment Growth

Recognizing that there is always some level of unemployment in the economy, the nation and NH are at or very near “full employment,” making  job gains harder to obtain.  Full employment in the latter stages of recovery is the most obvious rationale for slower job growth going forward.  As the chart below shows, growth in private sector employment nationally is still solid but has been trending downward for some time while growth in NH accelerated in 2015 but appears to have peaked in early 2016.

private sector job growth

The Breadth of Job Gains Narrows

I use a 13 industry private employment diffusion index to assess the breadth of job growth across the private sector economy.  When more industries are adding jobs than are shedding jobs, the index is below .50 and the greater the number of industries adding jobs compared to those shedding jobs the higher is the index number.  The chart below shows that both the national and NH diffusion index have dropped, with NH’s decline of particular concern as it now stands below .50 on a three month moving average basis. NH’s employment numbers are often substantially revised so this index value may not be as bad as it appears here but the U.S. number still points to a slowdown.

diffusion index

Historically, significant declines in NH’s employment diffusion index have signaled turning points in the state’s labor market. The relationship between NH’s diffusion index value and the rate of year-over-year private sector job growth four months later is strong (a correlation of .82).  A simple linear regression of the NH diffusion index on private sector employment growth suggests the last two quarters of 2016 will see private employment growth in NH of about 0.6% on an annualized basis compared to the current rate of growth of about 2.0%.  Clearly not in danger of recession but definitely a slowdown.

diffusion index and emp growth

Fewer Help Wanted Ads

Nationally and in NH the number of help wanted ads has declined in recent months.  In NH the relationship between the three month moving average of help wanted ads and job growth in the quarter that follows is strong (R= .80).

NH US Help Wanted

Growth in State Corporate Income Tax Collections Has Peaked

Nationally, the rate of growth in state corporate income taxes is declining (chart below).

corporate tax revenues

The chart shows that compared to all states combined, the growth in NH’s business tax revenues is increasing as the growth rate nationally declines.  This despite the fact that NH’s private sector employment growth has been at about the U.S. average over the past year.  What is different in NH is the inclusion of NH’s Business Enterprise Tax revenue along with NH’s tax on corporate profits in the chart above.  Both private employment and wage growth have accelerated in NH over the past year. Wages and salaries paid by a business are the largest portion of the Business Enterprise Tax base so even as business profits grow more slowly, business tax revenues can be buoyed by substantial increases in overall wages and salaries.  While not a measure of the payroll of NH businesses, wage and salary income increased in NH by 8.6 percent between QI 2015 and QI 2016 compared to 5.3 percent nationally.  That increase has helped boost Business Enterprise Tax revenue and overall business tax revenue in NH in a way that it cannot in other states (most other states would see the change in individual income tax revenue).  The trend is depicted in the chart below that shows the growth rate of the annualized business profits portion of NH’s business tax revenue has slipped while the growth rate of the portion more dependent on wages and salaries has seen accelerated growth.  A slowing growth rate in private employment in NH implies slower growth in wages and salaries and business tax revenues in the state growing more similarly to the pattern among states nationally.  This will occur just as a budget surplus and strong overall revenue growth have increased pressures for additional state spending that had been muted by several years of relatively weak business tax and overall revenue growth.

NH business tax revenue growth

It is impossible to predict monthly payroll employment growth for a small state like NH (or any state for that matter) but I predict employment growth of about 120,000 jobs nationally in July but anything between 100,000 and 150,000 would be in line with the indicators highlighted in this post and consistent with a gradual slowing of economic growth nationally and in NH. Not soon but at some point that slowing will become a recession and that will be the reward for winning the White House and for new and incumbent occupants of statehouses across the nation.

What the Unemployment Rate Doesn’t Tell Policymakers Can Hurt Us

June 22, 2016

Last week the NH Labor Market Information Bureau released the NH jobs report for May and as usual all of the attention focused on NH’s low (2.7 percent) unemployment rate.  The more significant story was the April to May decline of 4,000 payroll jobs in the state.

Private sector jobs in NH were lower by 3,400 in May, the largest one month decline since 2008 – with one exception – a month in 2014 when workers at the Market Basket grocery chain left their jobs in support of their ousted CEO.  May 2016 job losses were an out sized drop for any month of seasonally adjusted data (a decline of that size would more likely be seen in the not seasonally adjusted data where large changes in employment occur annually during certain months of the year).  I am inclined to attribute some, but not all, of the drop in NH’s May employment to problems with seasonal adjustments and other statistical issues.  Still, the May data marks the first time since 2011 that a three month moving average of private sector employment growth in NH has been negative.

3 mos avg change in private emp

For some added context on the NH payroll employment numbers I wait for a release from the U.S. Bureau of Labor Statistics, usually about one week after NH releases its state’s job numbers.  That monthly report provides employment, unemployment, labor force and other labor market data for all 50 states.  Here is a bit of the context provided in the June 20th release from the U.S. Bureau of Labor Statistics:

“In May 2016, four states had statistically significant over-the-month decreases in nonfarm payroll employment and three states and the District of Columbia had significant increases. The job losses were in Tennessee (-13,400), Michigan (-12,700), New Hampshire (-4,000), and Montana (-2,700). In percentage terms, Montana and New Hampshire had the largest declines (-0.6 percent each), followed by Tennessee (-0.5 percent) and Michigan (-0.3 percent).”

The term “statistically significant” decline in employment is important.  Twenty seven states experienced declines in nonfarm payroll employment in May but in only four of those states was the decline deemed “statistically significant,” meaning that the decline was large enough for the BLS to be at least 90% certain that the change in employment did not fall within the margin for error of the employer survey on which the employment estimates are based.

May emp change

It is not wise to be too concerned with one month’s job report.  Whether the  May job growth number is real or illusory and the product of statistical anomalies, the numbers for NH still should have attracted more attention (than a 0.1% uptick in the unemployment rate) from the media and especially from lawmakers and public officials.  The May job growth number is certainly more noteworthy than a slight uptick in the state’s unemployment rate that was the focus of most media reports.   As I noted in my previous post, employment growth nationally and in NH is going to slow and one bad month is not reason to panic.  But NH’s year-over-year percentage increase in private sector employment took a big hit with the May jobs report and the state’s ranking among states on private sector job growth did as well.  Private employment growth in NH has been on a solid pace for more than a year but with the May data NH moved from the top third to the bottom half among states on year-over-year private sector job growth.

Ranking Private Sector Job Growth

Public sector job cuts continue to be a drag on NH’s total nonfarm job growth, shedding about 2,500 jobs between May of 2015 and May of 2016, by far the largest percentage decline of any state in the nation.

Change in Govt Jobs May 15 to May 16

Still, while the May jobs report was troubling, initial unemployment claims are a very good leading indicator of economic activity and they remain subdued in NH and have yet to suggest a significant downtown in either the U.S. or NH economies.  The May jobs report also showed a continuation of the recent trend of solid labor force growth.

IUC

Implications for State Revenue

My primary concern about the May jobs report for NH, and with monthly jobs reports for NH in general, is how little attention payroll employment numbers get from policymakers and how much attention and importance is given to the state’s unemployment rate.  The state will begin crafting its two-year budget this fall and solid revenue gains over the past year and a budget surplus are building pressure for substantial increases in state spending.  This isn’t a commentary on the merits of specific spending proposals (I will save that for later posts) just a caution that the fiscal environment into which spending proposals will be entered can change and the need to recognize that change as far in advance as possible.  I would feel more comfortable about the upcoming budget process if NH’s weak May jobs number, and the possibility that weaker job growth will continue, were at least acknowledged by policymakers, state agencies, and the media.  I want to know that there is someone in NH’s wheelhouse focused on the horizon and not on our wake.   I understand the appeal of the unemployment rate as a single, intuitive metric that summarizes economic conditions but the unemployment rate is a lagging indicator of labor market and economic trends.  For policymakers and anyone who needs to assess the near-term economic outlook, using the unemployment rate as a guide is a bit like driving using the rear view mirror.   The unemployment rate is an important economic indicator that says a lot about current economic conditions, it is just not that useful for forecasting purposes. Moreover, NH’s demographics (fewer individuals in demographic groups that typically have high rates of unemployment) mean that the state will almost always have a relatively lower unemployment rate than the U.S..  Too frequently that leads lawmakers and others in NH to assume the state’s economy is performing better than it actually is and better than the U.S. economy.

Business taxes are a big reason that NH revenues have outperformed expectations this fiscal year, accounting for almost two-thirds (or $61.4 million) of the $99.4 increase in traditional taxes and fees over FY2015 during the first 11 months of fiscal year 2016.  Focusing on changes in private sector  payroll employment and wage growth is especially important for lawmakers in the Granite State and especially important as we head toward a budget making year.  As a lagging indicator of economic activity NH’s unemployment rate will remain low, even as the economy slows.

Emp Growth and Business Taxes

If lawmakers focus too much on NH’s unemployment rate in their assessment of state revenue trends they risk delaying recognition of turning points in the NH economy and thus changes in state revenue trends.  Private sector employment and payroll growth slow before significant changes occur in the state’s unemployment rate and private sector employment growth is a better indicator  of trends in NH business tax revenue than is the state’s unemployment rate.  So the next time a public official brags about NH’s unemployment rate, ask him or her how many jobs were added in the state during the last month.

Presidential Campaign Impacts on U.S. Job Growth and Implications for NH

June 9, 2016

The May U.S. jobs report with downward revisions to the March and April job numbers was bad, not bad enough that you should start stocking canned goods and bottled water in your basement but bad nevertheless.  The impact of 35,000 striking Verizon Corp. workers on the May numbers is cited as one explanation for the weak report but there were 25,000 temporary workers hired by the company during the strike so the overall impact was actually fairly small.  Seasonal adjustment factors (the statistical procedure used to smooth regular annual fluctuations in employment data throughout the year– things like Christmas hiring, summer employment of youth etc.) seem to be more problematic in recent years and that may also be a contributor.   Of course it is possible that hiring was just weak, plain and simple.  Hiring will continue to weaken, I just don’t think job growth is really as weak, and the slowdown as rapid, as the May jobs report suggests.

Presidential Campaigns Appear to Impact Job Growth

The first rule of politics is to forget all of the rules of economics and that is more problematic now that the national political climate seems to increasingly influence real economic variables. Think of the impact that debt ceiling debates and government shutdown threats have had on economic activity recently.  With almost no focus in the current presidential election on sound economics and economic policies it is easy to see how politics could  contribute to a weak May jobs report (when the empirical evidence doesn’t provide a clear explanation for economic events it is hard to go wrong blaming politics and politicians).  But there is some evidence that presidential elections can temporarily depress job growth.  The uncertainty of a presidential election, especially in a year without an incumbent, and the people and policies that candidates may employ in their administration can give pause to businesses investment and hiring decisions. The uncertainty surrounding future economic and fiscal policies in a presidential election year should arguably be greater several months prior to the election rather than a month or two when the election outcome and policy directions become clearer.  I compared average private sector job growth (government employment should not be affected) in the U.S. during the months of June-August in presidential election years, to the average job growth from September (of the year prior to the election) to May (of the election year).   Since 2000, in each presidential election year the average private sector job growth from June-August significantly lagged average job growth over the prior nine month (Sept-May) period. The pattern held in 2008 but because the U.S. economy was in free fall for other reasons it is not included here.   In years with no presidential election this generally was not the case (years such as 2002, 2003 and 2007 when the U.S. was entering or exiting a recession are exceptions).

UncertaintyJob growth in NH is going to slow regardless of political uncertainties given existing labor force constraints.  NH is essentially at full employment and the nation is close. The longer a recovery lasts the greater are the chances that job growth will slow.  Still,  there are more uncertainties regarding the presidential candidates and the policies that could affect business and the economy in this election than is typical in a presidential year so it is not unrealistic to think that politics is already affecting hiring and investment decisions.

Will New Hampshire Follow the National Trend?

State level job growth numbers for May will be released June 17th.  In a small state like NH monthly job growth can be especially volatile. Up or down  conclusions about a state’s economy should not be drawn from a single month of employment data.  A three month trend in private sector employment is a better reflection of the direction of a state’s economy and by that metric NH has been on a roll.  The chart below shows that after several years of below national average private sector job growth, the pace of job growth in NH is now at a level equal to the U.S. average.  Moreover, the growth trend for NH has accelerated while the rate of private sector job growth in the U.S. has decelerated.  The rate of private sector job growth NH is going to slow nonetheless,  just as it has in the nation overall.

private sector job growthI don’t think the private sector job growth trend has gotten enough attention in NH.  Many (including me at times) focused on several years of NH’s subpar total non-farm (including government) employment growth.  But as I have noted in prior posts, the percentage drop in government jobs in NH is among the largest of any state in the nation, masking some of the strength of hiring trends in NH’s private sector.  The chart below shows how both private sector and state and local government employment in NH have grown since each sector’s pre-recession peak.  Private sector employment in NH peaked in February of 2008 and after shedding 6% of those jobs during the recession NH has regained that many plus an additional 3%.  State and local government employment in NH did not peak until April of 2010.  It takes a couple of years for property valuations to reflect economic conditions so the largest declines in property valuations – and thus local revenues and employment- occurred as the recession had ended.  State and local government employment in NH is about 8.5% lower than at its peak, with local government shedding about 6,800 jobs and state government about 1,000 jobs.

public vs private sector growth

Labor Market Response in NH May Be Too Late

For too long in NH private sector job growth remained consistent at a subpar rate despite a large increase in help wanted ads in the state.  A combination of slow or no labor force growth and a mismatch between job opportunities and the skills of job seekers were the causes and not a fundamental erosion of NH’s business climate as I argued in this post.

NH US Help Wanted

But now help wanted ads in NH and the nation are slipping (chart above) and while the recovery isn’t over we are getting better more slowly.  Unfortunately, that is occurring just as the labor market conditions –  low unemployment, rising wages, and signs that NH is once again seeing net in-migration from other states, are all resulting in a more rapid expansion of the NH labor force, the key ingredient wages

the state has lacked in recent years to achieve a faster pace of  job growth.

NH Labor force growth

A Bumpy Ride for the Remainder of 2016

I am frequently in error but rarely in doubt and in this post  last fall I was confident NH would again exceed the U.S. rate of employment growth (it is still possible but not likely) and that NH would see a 2.5% increase in total employment in 2016 (that is not going to happen). In fairness, private sector job growth has been on a more than 2% growth pace for the year and I did include two caveats in my forecast last fall: first that labor force growth in NH would have to accelerate (in part due to a resumption in net in-migration to the state) and while the labor force is once again growing in NH,  it is at a pace that may not sustain the 2% plus growth that NH’s private sector is currently on.  Second, the decline in government jobs would have to abate – it hasn’t.  A month ago at a presentation at a local community bank I downgraded my job growth forecast for NH in 2016 from 2.5% to 1.8%.  With more recent national economic data – including the May jobs data and March/April revisions, readings from my PolEcon NH Leading Economic Index, along with the uncertainties produced by the nation’s political climate, I now believe the rate of growth will be just 1.2 to1.4 percent.

A Pyrrhic Victory for Pipeline Opponents

June 2, 2016

Another energy project has been scuttled that could have provided some relief to New Hampshire and New England households and businesses who are paying among the highest prices for energy of any state in the nation. I believe the project would also have contributed to the important goal of reducing carbon emissions in NH and New England (more about my support for reducing carbon emissions and some controversial policies to accomplish that in a future post).  No doubt any proposed energy project is better when forged and tempered through a process of public review and debate.  But the withdrawal of proposed wind energy projects, and more recently the Northeast Energy Direct (NED) natural gas pipeline project, as well as the difficulties encountered by some solar projects in the state, question how committed many residents and some policymakers in NH are to finding solutions to an energy climate that is widely recognized as detrimental to households, businesses, and the NH economy.  As opponents of  pipeline, wind, and solar projects claim another “victory” in NH, an admonition given to Pyrrhus, a Greek general and ruler of Epirus comes to mind.  After a costly victory over his Roman enemies by Pyrrhus, the Greek philosopher Plutarch reportedly told Pyrrhus that another, similar “victory” would ruin him.  If the “ruin” that could occur only affected the combatants in NH’s  energy infrastructure battles, instead of the 1.4 million non-combatant “energy civilians” in the state, Plutarch’s warning might be useful.  But there are no “generals” and no real leaders or statesmen and stateswomen battling NH’s energy constraints and so the casualties of our state’s inability to take control and direct its energy future will be most broadly spread across the state’s population.

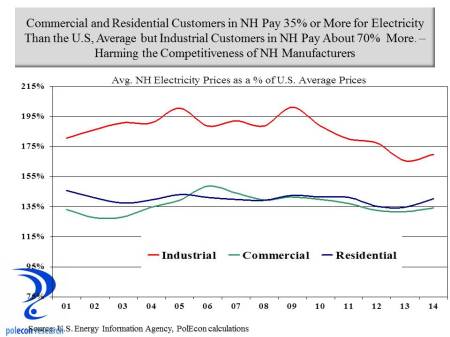
This post highlights some of my calculations of the costs to NH of the defeat (or victory as opponents would argue) over the Northeast Energy Direct natural gas pipeline proposal.  To begin, let’s reiterate the cost disadvantages faced by consumers of electricity in NH.  The chart below shows that through 2014, residential and commercial electricity customers paid, on average, about 35 percent higher rates than the national average, while industrial customers paid a whopping 70 percent higher rates than the national average.

energy prices

The NED Project’s Impact on Natural Gas and Electricity Prices

Natural gas prices have been lower in recent years as a result of increased U.S. production, largely from the Marcellus and Utica shale formations in  Ohio and Pennsylvania.  But as I noted in this post, a lack of pipeline capacity precludes NH and New England from realizing the full benefits from declining natural gas prices.  The increased supply of natural gas from nearby sources enabled by the Northeast Energy Direct project would impact natural gas prices in NH and New England.  Price reductions would result in direct savings to residential, commercial, and industrial consumers of natural gas and would also result in electricity prices that are lower in NH than without the Northeast Energy Direct project. New England’s wholesale power prices are closely related to natural gas prices because of the region’s dependence on gas-fired power generation capacity. By reducing spot prices for natural gas in New England, the NED Project will have a direct impact on New England’s wholesale power prices.

At least eight separate studies have forecast lower natural gas prices in New England resulting from an increase in pipeline capacity into the region.  Even one study from the Massachusetts Attorney General’s Office, while suggesting an increase in pipeline capacity to New England isn’t needed to assure reliability of electricity supplies in the region (inaccurately I believe and contrary to reports by others, including the operator of the New England Energy grid), recognizes that increased pipeline capacity would result in lower regional natural gas prices.

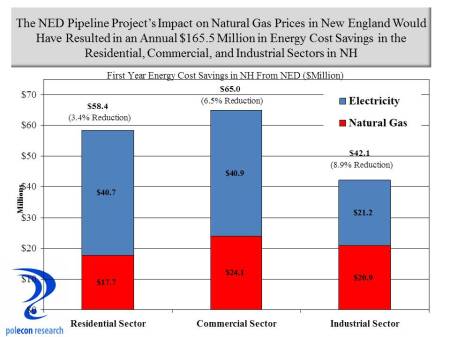
 There is a range of estimates of the price impacts from an increase in natural gas supply to the region. My estimates of energy cost savings in NH use one of the more conservative estimates of the price impacts of increased supplies to the region as documented in a study  by ICF International. I used historical data on both natural gas and electricity consumption by sector (residential, commercial, industrial)  in NH from the U.S. Energy Information Agency (EIA) as well as forecasts of future consumption based on the EIA’s regional forecast for growth in natural gas and electricity consumption and applied ICF natural gas and electricity price reduction estimates to consumption forecasts in NH to estimate savings to customers in the state that would result from the operation of the NED pipeline.  In the initial full-year of pipeline operation I estimated the savings to natural gas and electricity consumers in NH to be $165.5 million.  The breakdown of saving by source and sector is presented below.  Savings represent about 3.4 % of the 2014 energy expenditures of NH residential consumers, 6.5% of commercial sector energy expenditures, and 8.9% of the energy expenditures of industrial consumers.

savings by sector

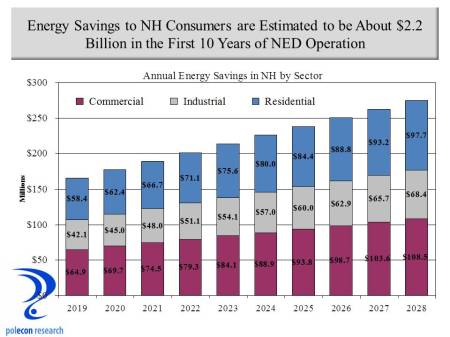
 Using the same sources and methods, I estimate the 10 year energy cost savings to NH natural gas and electricity consumers  would be just under  $2.2 billion in nominal dollars as a result of the Northeast Energy Direct project.

10 years savings

Additional Benefits of Increased Regional Access to Natural Gas

There are other potential benefits from NED that have been less talked about.  Much of NH has limited or no access to pipeline natural gas from local distribution companies.  The lack of access to natural gas increases energy costs for households and businesses in many regions the state.  In particular, lack of access increases the economic disadvantages currently faced by most rural regions in the state.   Natural gas is most available in the populated regions of Southern NH closest to regional pipelines and the lateral pipelines operated by local utilities who purchase natural gas from the regional pipeline operators.  The proposed NED pipeline would have passed through a portion of the state where the economy has lagged for some time and regions that could most benefit from access to pipeline natural gas.  The NED would increase capacity but local utilities would have to add lateral pipelines to serve communities, households and business in places like Keene, Claremont, Cheshire, Sullivan and Grafton Counties.

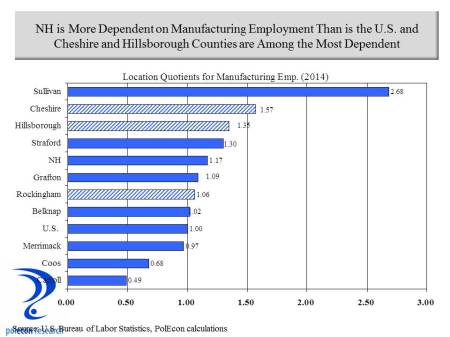
Along with extremely high electricity prices for industrial consumers relative to the U.S. average, the lack of access to natural gas is a significant disincentive to operating a manufacturing facility in much of New Hampshire, as nationally, natural gas accounts for 40 percent of the purchased energy of manufacturers on a BTU basis.  There is anecdotal evidence that manufacturers nationally are starting to react to lower natural gas prices by planning to open new facilities in the United States. There are other influential factors, including rising employment costs overseas, but those industries for which natural gas is an important input are anticipating an advantage of locating their operations in the U.S..  Cheshire and Sullivan Counties are among the most manufacturing dependent regions in the state and access to utility natural gas would especially benefit communities in those regions.  The chart below presents location quotients which represent the concentration of manufacturing employment in each NH county relative to the concentration of manufacturing employment in the U.S. overall. A location quotient of 1.00 indicates a region where the concentration of manufacturing employment is identical to the concentration of manufacturing in the the U.S. economy overall.  Location quotients above about 1.20 suggest counties where manufacturing is especially important to the regional economy.  Shaded bars represent counties through which the NED project would pass. The NED would not pass through Sullivan County but its proximity would make lateral access to gas from the pipeline feasible.

manufacturing LQ

Increased natural gas supplies and lower prices will be especially helpful to smaller manufacturing firms which face higher prices in New England but also face larger natural gas price differentials relative to larger manufacturers than anywhere in the country.  High prices and larger price differentials create a strong disincentive for new and emerging manufacturing firms to operate in New Hampshire and may be contributing to an “aging” in the manufacturing sector in the state.

gas prices to manufactures

Access to natural gas would also benefit households. Just under 20 percent of households in New Hampshire use pipeline natural gas for heating and another 13 percent use bottled gas but there are large regional variations in the availability of natural gas for heating.  Again, regions of the state that are considered economically disadvantaged, in most cases, have the least access to pipeline natural gas.  Access to pipeline gas won’t guarantee a reduction in disparities in the economic performance of various regions of NH but it would help households and manufacturers in regions where the economic performance has lagged.

home heating in NH by source

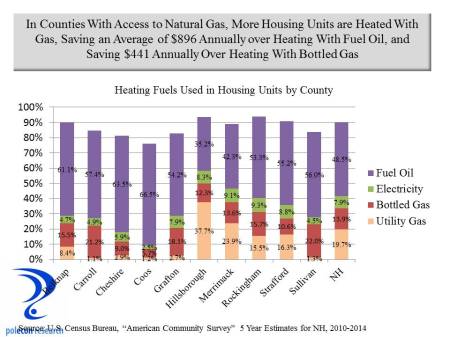
The savings for households heating with pipeline natural gas is substantial. The table below shows the average cost differential in annual heating costs between housing units heated with pipeline natural gas and other sources.  The difference between pipeline natural gas heating and fuel oil – the largest source of home heating fuel in NH – averaged over $890 annually between 2010 and 2014. By lowering natural gas prices the differential between homes heated with natural gas and other sources (other than solar) are likely to widen.  The NED would  increase opportunities for more communities, regions and more homes to be heated with natural gas in New Hampshire, amplifying the potential savings estimated here for NH households and the NH economy associated with lower natural gas prices.

Table copy

Factoring the impacts of the NED project on natural gas prices and disposable income for  residential consumers (and not including the impacts on commercial and industrial consumers)  I estimate that an additional 5,300 jobs would have been created in the first 10 years in response to the energy cost savings to households from the NED project.  When the impacts on industrial and commercial consumers are considered the potential benefits of the project become even clearer.

Disclosure

I originally prepared more detailed estimates (than in this post) in a report I did for the proposed NED project.  I write this blog (when I have time) because I enjoy researching and writing about topics that interest me, not to advance client interests. I think the report contained some good analyses and now that the NED proposal has been withdrawn and the company is no longer a client, I don’t feel conflicted writing about it here.  The success or failure of the NED project had no impact on the compensation I received. The report addresses energy issues in NH that I have been writing about since long before my work for the NED project. It examines the usual economic impacts from the construction phase of the project but more importantly potential longer-term impacts of the project.  The report also examines controversial topics such as potential impacts on tourism activities as well as fiscal impacts of the project.  The report can be viewed here. Because the report was paid for by the NED project owners, critics will dismiss some or all of the findings.  But a report that is paid for only means that its author(s) has some “skin in the game.” In a small state, and especially in NH, anyone who produces work that distorts findings or misleads policymakers won’t be offering services of  value and won’t be working in the state for long.  On the other hand, anyone without “skin in the game” or some compensated interest is pretty much free to make any claim without evidence, present any data, or any “analysis” regardless of its accuracy, without concern for the impact that it has on their business or professional reputation. I am not arguing that any information brought to policy debates that isn’t paid for has no value or is necessarily inaccurate or misleading, just that information that is not paid for by some interests is not is inherently or by definition more accurate or relevant than work that is paid for – there should be no “halo effect” for information entered into important policy debates simply on the basis of whether or not compensation was involved – compensated or not, information entered into the debate is provided by a party with a particular interest in the issue.  The quality and accuracy of the analysis should determine its merits.  I like to think that the ultimate test of the quality of an analysis is whether those who produced it will be around and willing to answer for its accuracy or inaccuracy when the time comes when that can be determined.  I don’t think my analyses (or forecasts) are wrong that often but when they are I am available to answer to policymakers and others for it.  I don’t think I would have had to answer for my my analysis of the impacts of the NED.

How Much of a Benefit is Low Oil Prices?

March 7, 2016

Low oil prices have provided an economic windfall to households in New Hampshire and across the nation. Based on actual 2014 energy consumption and expenditure data for NH, changes in 2015 energy prices, and forecasts of 2015 energy consumption (actual data won’t be released for another year), I estimate that businesses and households saved about $1 billion in 2015 as a result of lower oil prices (Figure 1).

NH savings

Households saved over $800 million – largely as a result of lower gasoline prices – and businesses saved nearly $200 million. In 2015 households in NH spent about $665 million less on gasoline than they did in 2014 and about $800 million less than they did in 2012 (Figure 2).
gasoline savings

Here I am talking about the monetary impacts of lower oil prices, the distribution of impacts among states, between business and households, by different income levels, and how increased U.S. oil production is changing the demand for imported oil. While the overall impact is a net positive on the U.S. economy – especially consumers – the net benefits to our nation’s economy have been smaller than many anticipated. This is not a full accounting, I do not consider any environmental implications (I will write about some of those in future posts on carbon emissions, carbon taxes and climate change that are sure to incite the unstable) or the fact that low oil prices make Vladimir Putin only slightly more scary or any number of petroleum states that much less stable.

There was a time not long ago when low oil prices would have provided a stronger stimulus to the U.S. economy, as every dollar saved by businesses and individuals as a result of lower oil prices translated into nearly a dollar of benefits to the U.S. economy as more of the dollars saved were dollars not being sent overseas. But today many more of the petro dollars saved are dollars that would have gone to U.S. businesses and workers, reducing the overall net benefits that lower oil prices have on the U.S. economy. Figure 3 shows the dramatic increase in U.S. oil production beginning late in the last decade along with a concomitant decline in oil imports.
production and imports

Regional Impacts

Make no mistake, lower oil prices are a good thing for U.S. economy overall, but the boom in oil and gas production in the U.S. includes states that are relatively new to energy production, spreading the negative impacts of a downturn in energy markets more broadly across the U.S., as well as some states who have gone from very small to more significant energy producers, deepening the negative impacts from low prices in those states. Texas, Oklahoma, Alaska, Louisiana are used to economic disruptions caused by fluctuations in oil prices (although much of Texas is now much more diverse) , North Dakota and other states not so much. Figure 4 shows the volume of oil production in 2014 by state and thus the relative exposure that these state have to fluctuations in oil prices.

state production

The increase in U.S. oil production was spurred by high world oil prices that made it economically viable to extract oil using more costly methods, as well as improved technologies that made it possible to extract oil that could not be obtained through traditional drilling techniques. A few years ago I worked on an energy project in the Permian Basin of West Texas and Eastern New Mexico that involved enhanced oil recovery (EOR) techniques. At that time the price of oil was around $100 bbl while the break-even price of EOR was approximately $67 bbl. In that environment it is not surprising that a boom in production would occur in areas with even difficult to extract oil reserves. Continued improvements in technology have no doubt lowered the break-even price of EOR below the $67 that it was back in 2012, but probably not as low as the $48 per bbl that was the average price for U.S. crude in 2015, and certainly not as low as the $32 bbl average of January 2016. The sharp decline in oil prices since 2014 is affecting the profitability, production, and employment of energy companies and those that service and supply them. Low oil and gas prices don’t help energy producing states the way they help NH and other non-energy producing states because the benefits of lower oil and gas prices to households and businesses are mitigated by the reduction in investment and employment in oil and gas extraction, transportation, and the industries that support them – including financial industries, professional and technical industries (engineering etc.) and many others. Figure 5 shows states at the bottom of private sector job growth in 2015 – all but Vermont and Illinois are significant energy producing states.
state emp  change

Income Support

The benefits of lower energy prices on households nationally have been large. Energy spending dropped from 6.1% of total expenditures of households in 2008 to 4.4% through mid-2015. All households benefit from lower energy prices but the benefits are not evenly distributed. Low-income consumers devote a larger share of their budgets to energy and thus lower energy prices provide a greater relative benefit to households lower on the income scale. Data from the Consumer Expenditure Survey of the U.S. Bureau of Labor Statistics show that consumers in the bottom half of the income distribution devoted 10.7% of their budget to energy expenses, while consumers in the top half of the distribution devoted 8.1% of their budgets to energy (the figures are higher in the Northeast where households spends more on heating and much more on oil heat than the national average). To some extent these differences may overstate the benefits of lower energy prices to lower-income households because the largest difference in the percentage of household expenditures on energy by income level is for electricity; lower oil prices have had little impact on electricity prices, but the benefits to lower income households are still signficant. Figure 6 shows the percentage of total household expenditures in the U.S. that are devoted to energy among households in four different income ranges.

exp by income level

Geopolitics

The most important implication of U.S. oil production may be for U.S. foreign policy. Not only are oil imports on the decline as U.S. production has increased, but the sources of imported oil are also changing. Persian Gulf states are a declining source of oil imported in the U.S., while Canada is a rapidly increasing source (Figure 7).

imports by region

The historical role that concerns about oil supplies have played in U.S. policies toward Persian Gulf states is debatable but a declining dependence on Persian Gulf oil at least offers the possibility that whatever U.S. involvement continues in the region will be less energy dependent. If current trends in U.S. production and imports continue, it is possible that the only country that the U.S. imports oil from in 10 years is Canada. If I have learned one thing from this presidential primary season it is that not all Canadian imports are a good thing. But, I grew up along the Canadian border and I would be pretty comfortable only relying on the great white north to meet our nation’s demand for imported oil.


%d bloggers like this: