Posted tagged ‘revenue’

“Honest Brokers” and Revenue Estimates

May 14, 2013

Unlike the federal government, states can’t easily budget and spend more money than they take in revenue so revenue estimates play a much more important role in state budgeting than they do  in federal budgeting.  I don’t know how anyone can accurately forecast revenues when the revenue yields are based on negotiations, lawsuits or other non-economic variables but that seems to be the basis  of much of the disagreement among budget writers in New Hampshire. When a comparatively large percentage (compared to many other states) of your revenues are derived from a “Medicaid enhancement tax”  and “tobacco settlement”  money budget writing can become even more politicized than usual.

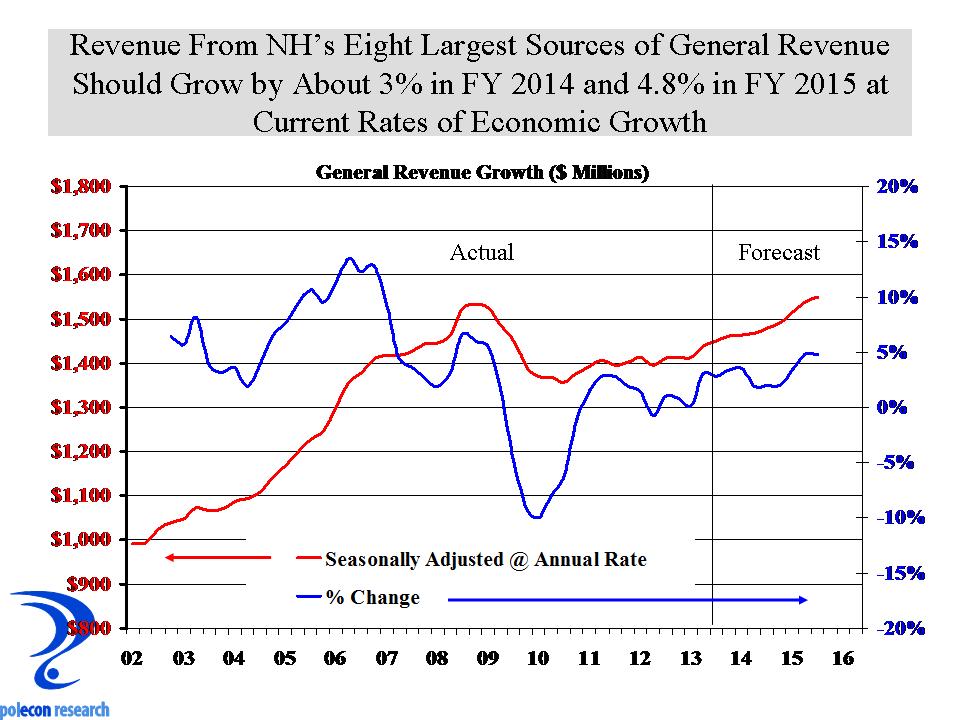
I don’t pretend to know what these non-traditional sources of revenue will yield in the coming years but I get a sense that those who do are fitting their forecasts to their meet their budgetary goals.  I  don’t think revenue forecasting is that difficult as long it is based on real economic data and trends and it minimizes the use of assumptions about changes in the performance of the economy.   I make forecasts with assumptions all the time but  minimizing their use  in revenue forecasts will mean that even if the forecast is wrong, it won’t appear as though the error resulted from a desire to “coax” a specific result from the forecast.   In January I presented my outlook to the NH House Committee on Ways Means.  At that time I said I thought revenue growth from major, “own-source” revenues would average about 2% each year of the biennium and that businesses tax revenue growth would be a bit higher, but with even modest economic improvement could average 5-6% annual growth.  Now, several months later, based on recent revenue performance, and making  no assumptions about significant changes in economic conditions, I see growth at about 3% in FY 2014 from the eight largest sources of general revenue, and just under 5% in 2015.  Those numbers don’t count the “non-traditional” revenue sources but I think they are important in reflecting the fundamental underlying growth in the state’s economy and a better assessment of  general revenue trends.

NH General revenue forecast

Clearing out some old boxes from my attic  I came across a number of old college tests and papers.  One was from a graduate school class on public finance where I argued that all federal budgeting and budgeting  debates should proceed from a common economic and revenue forecast.  I also found one from an undergraduate class on the philosophy of Marxism in which I wrote phrases like “man should never be a means to end but only an end in himself ” so clearly I was prone to a lot of bad and muddled thinking back then.  In the 1990’s I wrote a column in a publication arguing for a non-partisan revenue estimating committee in NH.  That was a pretty good idea  and it did happen – although my prompt had nothing to do with it –  and it was enacted largely absent the “non-partisan” aspect (or at least “unbiased”).  I still think a true, non-partisan, representative revenue estimating panel would be a good thing for NH, not to bind any actions but simply to serve as a baseline scenario that any policymakers who wishes to deviate from would have to offer solid reasons for doing so.  Some group in the budget debate has to serve as the “honest broker”  but the honest broker role won’t happen if the group is loved too much by some or hated too passionately by others.   The current estimating panel has some of the best and most qualified people I know to do revenue estimating .  It just doesn’t have the  credibility among many policymakers that it could have  if  no one loved or hated it too much, but instead almost everyone complained a little (or a lot) about  it.  It is too bad because we are still going to need an “honest broker” when the NH House and Senate begin negotiations on the next budget.

Betting on Gambling Assumptions

March 5, 2013

The gambling debate in NH is as hot as it has ever been as the NH Senate just passed a casino gambling bill.  Since I have no dog in the fight (or more appropriate to the debate – no pony in the race) I’ll use this blog to add my $.02.   I think the issue will be decided largely on the basis of something other than the impact casino gambling would  have on state revenues, but to the extent that fiscal impacts are a part of  policymaker’s decision process I’d like to see them have access to the best information and tools with which to make their decision.   Public policy analysis is not physics, there aren’t formulas with constants that govern  behaviors today the same way they did one million years ago.   Policy research is mostly social science that relies on a combination of disciplines like economics, sociology, and demography, and others.  The goal of policy analysis isn’t to prove anything or have something published in an academic journal (a fact usually lost on academics)  it is to improve the information in the debate and to marginally improve the decision-making process.  Policy research is best when it not only provides information, but also when it increases policy maker’s understanding of the issue and how even small changes in policy proposals might affect the ultimate impact of a proposal.   A lot of lobbyists want to provide the one “answer” to what will be the impact of this or that proposal or what will be its fiscal costs or benefits.  A lot of lawmakers want a single “point estimate” of impacts as well, when in fact there is always a range of likely impacts (some more likely than others) and usually they depend on a set of assumptions.   I’ve done a lot of policy research and I never assume anyone will agree with any of the assumptions I include in my policy models so I always design them for policy makers to insert their own assumptions in order to calculate the impacts of policy proposals.  That both increases the confidence policy makers have in their decision-making by helping them understand the sensitivities of estimates to different assumptions and the key determinants or levers that produce different impacts, and it reduces concerns that my analyses are using unrealistic assumption or “cooking” the numbers.  But what it really does is provide a ‘tool” for policy makers to use rather than giving them my “answer” to any policy question.  I usually do have my preferred answer but it doesn’t do any good unless lawmakers can see that it isn’t just “my preferred answer” bu the result of some pretty sound empirical analysis, even when it can be interpreted differently.  Invariably I offer to make my models available to policy makers but to date at least, only a few have every taken my up on it.

With that long preface I’d like to suggest that all sides of the gambling debate make their models and assumptions available and allow policy makers to get a better understanding of the sensitivities of their estimates to different assumptions.  My friend Dennis Delay at the NH Center for Public Policy Studies  is about the best there is at shooting straight and trying to develop the best estimates possible but while he does the analysis I don’t think he does all of the report writing so I would like to see more attention in their analysis of gambling to demonstrating likely impacts under a range of assumptions because it seems that not everyone agrees with theirs.  I haven’t seen any detailed analyses by gambling proponents and think they need to provide their assumptions and models for estimating revenues and impacts as well if they want lawmakers to adopt their proposals (they may have done this I just haven’t seen any analysis).

To demonstrate how important assumptions are in estimating revenues I developed a small model of gambling revenue in NH (not including any social costs).  The model results presented below assume one casino in Southern NH with 5,000 slot machines (or video lottery terminals) but any number of slots can be entered as a variable.  The base for state revenues (on which a state tax would be applied) is estimated using  per slot machine revenue data from Connecticut Casinos for the most recent year (2012).  This seems like the most similar market but again, a different per slot figure can be entered into the model to yield different results.  In addition, different tax rates and different impacts from Massachusetts casinos can be entered into the model.  I’m not trying to estimate revenues here but I am trying to highlight just how important model assumptions can be in determining fiscal impacts and until all sides show how their estimates are affected by their assumptions I think it is hard for lawmakers to make reasoned decisions based on fiscal impacts.  As the chart below shows, estimated state revenues vary greatly when even a few assumptions change.  The “Y” or left, vertical  axis shows estimated state revenues, and the “X”  or bottom, horizontal axis shows increasing tax rates from left to right.  Each colored line on the graph shows estimated state revenue at each tax rate and each  colored line represents a different assumption about the impact on revenues depending on how much casinos in Massachusetts affect casino revenues in NH.

Sensitivity of Revenue Estimates

Finally, I would like someone to articulate and provide some data on how  casinos in NH would perform in a competitive market depending on the type of experience they provide.  That seems to me to be a question best answered by the industry.  I think it is important in understanding the impacts of an increasingly competitive gambling market and the data I have looked at suggest that, at least in Nevada (see below), casinos have derived an increasing share of their revenues from rooms, meals, beverages, retail and shows.  Entertainment seems to play a larger role in the business models of casinos in that state and I wonder if that will be true in NH or in Massachusetts and what are the implications if it isn’t in either, both, or if it is in just one state.

Sources of Casino Revenue

If We Can Beat the Mayan Apocalypse Why Not the Fiscal Cliff?

December 21, 2012

If the Mayan apocalypse can be postponed (I am not sure exactly at which time it is supposed to occur so I may be speaking too soon here) then surely the U.S. Congress can agree to actions to avoid the fiscal cliff.  Lawmakers are poised to give us over $500 billion in tax increases and over $100 billion in spending cuts to begin the new year.  The fiscal cliff is a  pretty big lump of coal as a gift to begin 2013.

What is extraordinary about the cliff’s self-inflicted harm is that it appears  almost all sentient beings realize what needs to happen. More importantly, there also appears to be substantial agreement on most of the actions necessary to avoid the economic harm resulting from the fiscal cliff.   Spending clearly has to be cut  just as surely as revenues have to be raised.

deficit trends

With so much apparent agreement on actions needed to avoid the damage, it is hard to understand the calculus of lawmakers as the lack of an agreement begins to  demonstrably affect business and consumer confidence as well as financial  markets.  Congress always comes up with a temporary fix for the alternative minimum tax and can easily do so again.  Almost everyone wants the payroll tax cut to expire (for different reasons – Republicans because they don’t like the temporary nature and believe it has no incentive for work and saving and Democrats because of its impact on the Social Security trust fund).  There is little support for extending unemployment benefits.  It seems like neither party really wants the spending cuts (Republicans opposed to defense cuts and Democrats to non-defense cuts).   There is disagreement over the tax increase for high income individuals included in the Affordable Care Act and Medicare reimbursements for doctors but those are a miniscule portion of the cliff’s effects.   Beyond all the posturing,  the fight in congress is really  about whether to extend tax cut provisions to 98% or 100% of U.S. households.

cliff effects on growth

I know I am simplifying here.  Even with many agreed upon temporary  fixes,  longer-term solutions must be found.  But lawmakers could still salvage strong economic benefits by avoiding the worst of the cliff’s impacts in the short-term while resolving longer-term issues in the first-half of 2013.  Such a “grand bargain”  would both increase business and consumer confidence and set the nation on a more sustainable budgetary and debt path that would quickly overcome any of the short-term negative impacts  resulting from necessary spending cuts and revenue increases.

Empiricism – 1, the Orthodoxy of Ideology – 0

October 11, 2012

The tally is in and according to the NH Department of Revenue, last year’s $.10 cut in the rate of the state’s cigarette tax resulted in a loss of $12 million dollars for the state.  Note that tobacco revenues were down much more than that for the year, but that is the amount attributable to the rate cut.  It is about $500,000 less in revenue (out of over $200 million) than I forecast in a study that I conducted for a number of health related organizations, you can read it here.

In that report I wrote:

Industry revenue (net of excise taxes) is estimated to increase by $6.5 million with a $0.10 decrease in the states excise tax.  However, if the industry increases prices by the average over the past 20 years ($0.10 – the median is $0.08), industry revenue increases by an estimated $12.5 million.  Clearly there will be a strong incentive to capture the potential surplus from an excise tax decrease (rather than allow it to be passed on to consumers).  At the same time, a $0.10 excise tax decrease will lower state government cigarette tax revenues by $9 million, but if the industry raises prices by $0.10 then revenues will decline by $12.5 million.”

About a week after the rate cut took effect the industry raised prices by $.10 in New Hampshire.  In case you are wondering,  industry prices are not the same and do not move similarly in all states (look at the industry produced “Tax Burden on Tobacco” for historical state sales and price data to confirm this).     If you want a way too busy chart thati illustrates the strong incentives the industry has to raise prices when tax rates are cut,  here it is ( from page 22 of my report).

The $12 million reduction in revenue related to the rate cut is also $16  million less in revenue than the proponents of the tax cut argued in a “study” introduced during legislative debate ( that does not appear to be available any longer online).  There are a lot of reasons why cigarette sales and revenues decline over time (demographic changes, gasoline prices, etc.) all of which I included in my modeling of revenues but none of which were included in the estimates produced by advocates.  Advocates of the rate cut never mention these factors when sales drop, they only cite tax rate increases for declines (higher rates do decrease sales) but they are now offering them  as the reason why tobacco revenues are are  $16 million less than they forecast (because the orthodoxy says lower rates on their own can never be accompanied by lower revenues).  Except that isn’t the reason.  Factors outside of the rate decrease (demographics, gas prices etc.) account for the difference between the total decline in tobacco tax revenue over the year (just over $20 million) and the amount attributable to the rate decline ($12 million).  So about $8 million in the total decline in revenue is a result of factors other than the rate cut.

Sometimes cuts in tax rates can increase revenues, but the belief that they always do has become an ideological orthodoxy that can undermine cases where reduced rates can empirically be shown to increase revenues.  I am all for ideological arguments in policy making when they are based on evidence and not orthodoxy, but we run a risk of making bigger errors in public policy when we can’t distinguish between the two.


%d bloggers like this: