Posted tagged ‘employment’

How Much Should We Pay to Save a Steel Mill Job?

November 16, 2018

There are about 86,000 steel mill jobs in the United States, down from a decade ago when it was about 100,000. At its nadir in early 2017, steel mill jobs were under 81,000. About 6,000 jobs have come back since tariffs were introduced, but the producer price index (PPI) for steel mill products also soared as a result. The value of U.S. steel mill output was about $78 billion before tariffs while the producer price index for steel mill products has risen just over 20% since tariffs . Those numbers imply a cost of tariffs to purchasers of U.S. steel mill products (U.S. companies and governments) of about $16 billion, as well as a cost per job saved of about $2.7 million. If instead of tariffs the U.S. had offered each of the 6,000 laid-off steel mill workers a generous $100,000 stipend per year for 3 years to replace lost pay and benefits and to retrain, it would have cost $1.8 billion, saving U.S. companies and governments $14.2 billion in tariff-related costs. A  less than 1% surcharge on imported and U.S. steel mill products could have paid for such a policy without adding to government debt. I’m not arguing for such a policy but that 1% seems like a small price to pay to avoid punishing 20% price hikes.

Steel Prices and Emp

More Early Evidence on the Impacts of the Affordable Care Act

May 9, 2013

First, let me start by noting that this is not a post about the merits of the Affordable Care Act (ACA), depending on your political leanings either pejoratively or admiringly labeled “Obamacare,” it is a post  about  policy analysis.  I love public policy analysis and I  tell almost everyone who asks me (there aren’t many) that to understand the full impacts of any  proposal it is far more important to understand the incentives inherent in a policy proposal than it is to understand the goals, objectives or intentions of the proposal. Businesses, just like individuals, will respond to changes in public policies according to their self-interests.  In the case of the ACA, businesses wishing to avoid providing health insurance coverage to some or all employees have an incentive to keep employment levels below the employment threshold at which the ACA applies to a business (50 employees) or reduce the number of full-time employees in order to fall below the threshold.

In a prior post I noted that there was some early evidence of the effects of these incentives on retail employment (an industry with a higher percentage of workers without health insurance coverage) but that I thought more evidence was needed to evaluate any impacts from the ACA.  At that time I suggested that the expiration of the payroll tax cut might be more responsible for declines in retail employment than any impacts from the ACA. I promised to follow the issue so here is some additional evidence and unfortunately it points to some negative employment impacts from the ACA.  Whether this will continue and if it is does whether the negative impacts outweigh any positive impacts from the ACA is fodder for future posts.  For now, the chart below shows how the average hours worked in the leisure and hospitality industry has been declining.  This is an industry with the highest percentage of workers without health care coverage and also with a high percentage of employers near the threshold at which the ACA mandates apply.  It is also an industry that employs large numbers of part-time workers, making it relatively easy for employers to reduce the hours worked by employees in order to have them fall below the criterion that would have them classified as full-time employees for purposes of ACA mandates.   As the  chart shows, the average weekly hours worked in the industry (compared to the same month of the prior year) has declined significantly since the end of 2012.

Avg Hours Worked in Leisure and Hospitality Industries

It is still to0 early to make claims about negative employment impacts from the ACA but the evidence is beginning to point to some troubling impacts.  As we move toward the implementation date for the ACA any employment impacts will become clearer as employers looking to avoid mandates get closer to finalizing the employment level averages that will be used to determine their inclusion or exemption from ACA mandates. Empirically it may be too early to make a definitive call on the ACA’s employment impacts, but based on what I see as the incentives inherent in the ACA, it is just a matter of time before the call gets made.

Even A Broken Clock is Accurate Twice a Day

March 8, 2013

I am frequently in error but rarely in doubt, so when I am right I have to make sure someone notices.  Good news was reported today  on job growth nationally, as an estimated 236,000 jobs were added across the country in February.   I hate to sound jaded but in each of the prior two years job growth looked to be accelerating early in the year only to experience a significant mid-year  slump.  For now, however,  it is a positive sign.  I have been especially and uncharacteristically gloomy in my characterization of NH’s economy but there was some little reported good news on that front released last week.  The annual benchmark employment revisions showed that NH has 9,600 more jobs than originally estimated.  I won’t get into why the revisions are necessary and can result in some significant changes in the numbers  but in my very first post in this blog back in October I highlighted the disconnect between the volume of  help-wanted advertising in NH and estimates of job growth in the state.

“In the first ever Trend Lines blog post I begin by asking a basic question:  Could the most recent job growth picture in NH be distorted by numbers that will later be revised?”

I also suggested that growth trends in reported wages and salaries  in the state were also inconsistent with estimated job growth trends. In that post and in subsequent  posts (here and here) and others as well, I talked about a potential “skills gap” as a contributor to the disconnect between help-wanted ads and NH’s reported job growth.  I think a “skills gap” is a contributing factor  but as I argued in my first and subsequent  posts –  my money is on job growth being revised upward.  It is nice to be right but it really doesn’t change the overall theme of NH’s economy- that it continues to under perform relative to states it typically outperforms.  That was also predictable:

“…that the jobs data is wrong and will be revised upward early next year, is real,  but that doesn’t mean the revisions will show NH is again outperforming its neighbors or the nation.  It just means we will look less bad over the past year or so than we do right now.”

Five months later I think that still  sums-up my feelings about the revisions, its good to know we have more jobs but we are still in a growth mode that is too slow.  With the revised job numbers for NH the relationship between help-wanted advertising and reported job growth looks more appropriate.

NH Revised Emp

The revised job numbers also are more consistent with PolEcon’s NH Leading Index which had been signalling stronger employment growth in NH than was first reported.  The revised job numbers are more consistent with the signals provided by the Leading Index.   That may not mean much to anyone but to me it means I won’t have to spend a lot of time re-calibrating the Index and that means a more enjoyable weekend.  Enjoy yours.

Leading index and revised emp

Entrepreneurship and Gender Equity

January 16, 2013

I’ve written a couple of times (here and here) about gender equity issues in employment and unemployment.  I have an interest in almost all labor market issues but on this one I have three terrific and personal reasons for my interest.  One of them is a scientist in training and in a few years will be confronting the labor market issues I  examine  here.

My initial hypothesis was that larger businesses in NH would likely have more extensive policies and recruiting  efforts that would result in a higher percentage of women being employed in larger businesses in professional, scientific and technical industries in the state.  These industries include things like legal, architectural, engineering, laboratory, computer programming, accounting and scientific firms as well as veterinary services but not human medical services). As the chart below shows, that is not the case, as the smallest firms have a higher percentage of their employees who are women.   These industries also have the highest percentages of employees (male or female) with at least a BA degree.  Again, as the chart shows, smaller firms had the highest percentage of women among the employees with the highest levels of educational attainment.

Female Emp in Prof and Tech Industries

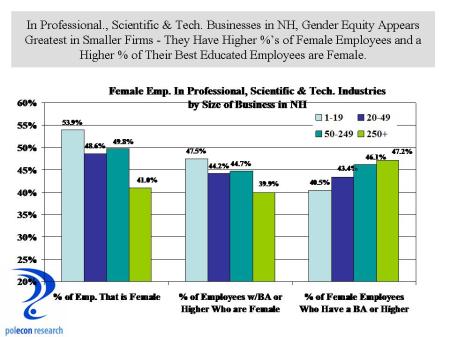
My new hypothesis is this – I don’t think (or at least I hope) that larger firms have any preference for hiring men over women.  Rather, it is that a higher percentage of the smaller firms in these industries are likely to be women owned and newer businesses started, owned, or managed by women.  I think the fact that the percentage of all women employees at larger firms, who have at least a BA degree or higher is greater than it is at smaller firms suggests that larger firms don’t just hire females predominately for lower-skilled occupations.  Women still represent a smaller percentage of graduates from many professional, scientific and technical programs (although that is changing) and thus present a smaller percentage of the potential workforce for many industries.  For smaller prof./scientific and tech. firms that are started, owned or operated by women,  female employment with the highest levels of educational attainment could, however,  be expected to be higher than at larger firms.

Anyway, that’s my story and until I get more evidence, I’m sticking to it.  More than just my interest as a parent, I think the issue has larger implications for policies to support gender equity and to increase the supply of highly skilled workers.   It may be that promoting entrepreneurship among women is among the best approaches to both.

The Sun Will Come Out Tommorow

January 3, 2013

I have been uncharacteristically and uncomfortably gloomy in my assessment of the NH economy lately, but I still hold out hope that New Hampshire’s job growth numbers for 2012 will be revised upward early in 2013 based on the volume of help-wanted advertising in the state and reported growth in aggregate wage and salary income in the state.  Even if that doesn’t happen there are encouraging signs that job growth will accelerate.   PolEcon’s NH Leading Index increased this month to a value of 13.0, down slightly from 16.7 the prior month, but it has registered its highest three-month reading since early in 2010.    At least some uncertainty around the  “fiscal cliff” that caused many firms to postpone hiring has been removed.   The U.S. Treasury debt ceiling still needs to be raised this month and a repeat of the last debt ceiling antics could produce another big drop in business and financial market confidence, but overall, the national and NH economies appear poised to see accelerating job growth as 2013 progresses.

Polecon NH  Leading Index

PolEcon’s NH Index of Leading Indicators is a diffusion index consisting of nine state and national indicators of economic activity designed to predict changes in the rate of employment growth in NH.  When index scores are above zero, more of the leading indicators are moving in a positive direction and the NH economy is expanding. The Index has a strong statistical relationship with changes in NH employment, Index scores lead changes in the rate of NH employment growth by 3-6 months.  Using statistical techniques, Index scores can also be converted into a probability that NH will be in  a recession sometime within the subsequent six months.

Leadin Index Components

Hiring by Age: More Evidence of a Skills Gap?

December 10, 2012

I know its a tough labor market for young people and recent college grads, but they still represented a larger portion of new hires in NH in 2011 than would be expected based on the percentage of employment by age in the state.  The chart below shows the age distribution of  employment in NH in 2011 along with the percentage of new hires in the state by age group.   Although job growth has been slow this recovery, the chart still shows that among those who have been hired for a new job (that is the hiring that is not a “call back” of a previously laid-off worker), younger workers make up a disproportionate number of the new hires.

Emp by age

This could be more evidence of, as well as a subset of,  the “skills gap” debate.  Many employers complain that the skills that young workers and recent grads posses don’t match their needs, and this is true for many occupations, but what this data also seems to suggest is that the mismatch between the demands of employers and those seeking work among the existing workforce is even greater than that for younger workers and new entrants to the labor force.  It suggests a bigger problem than just getting kids into the right majors and training programs (although that is a big part of it).  It points to a larger problem of a fundamental change in the types of occupations in demand (or the skills required of the same occupations) as well as a “twist” in the labor market that results in differences in the occupational make-up of industries.  It is a much more difficult , slower, and likely painful process to have the existing workforce adapt to these changes in order to increase their employment prospects than it is to begin with the next generation of workers, although both will challenge future employment and economic growth for some time.

Of course it is possible that employers just prefer younger and perhaps less expensive workers and that is what accounts for their outsized share of recent new hires.  Or it could be a function of the type of industries that were hiring in 2011 (I will be examining this hypothesis).  It may be more comforting to view labor market trends from those perspectives but it won’t get us any closer to taking the personal and policy actions necessary to create greater alignment between the skills of our workforce and the skills needed for a more prosperous economy.

Some Thankfull Job Growth Numbers

November 20, 2012

The U.S. Bureau of Labor Statistics released its monthly report on state and local employment today and the good news is that, preliminarily,  New Hampshire added 1,000 jobs in October.  The bad news is that this is just 1,200 more jobs than the state had one year earlier in October of 2011.  For optimists,  the most recent trend is likely to be the most important and the monthly report is consistent with the rise in PolEcon’s NH Leading  Index.

Nevertheless, the longer-term job growth trend in NH has been weak.  Looking at growth in just private sector employment, the situation is no better for NH.   As I have noted here, I  believe job growth in NH is being underestimated but even if that is true, it is hard to see how the recent past will be revised enough to make NH’s job growth picture look comparable to that of our neighbor to the south or the U.S. as a whole.


%d bloggers like this: