Archive for April 2014

The Demographic Trend NH Should Most Worry About

April 25, 2014

I believe that demographics explains two-thirds of everything and with more observers, analysts, and pundits also appreciating the explanatory power of demographics, the use of demography to account for economic, fiscal, and social phenomena has increased dramatically. That also means there are more inaccurate or misleading demographic analyses to sort through to find real insights.

The simple story about how NH is aging rapidly is a nice, if not completely accurate, dramatic story with intuitive appeal that makes it ideal for stimulating PowerPoint presentations as well as marketing and promoting a host of public policies and causes.  Most of the policy prescriptions justified on the basis of demographics will have no impact on the age structure of NH or any other state.   As I have noted before, aging is a permanent, irreversible consequence of low average family size and longer life expectancies in developed societies.   Unlike some states NH’s aging is more a result of its successes than of its failures.   As long as NH continues to have relatively healthier and wealthier (lowering mortality rates) older citizens who resist shedding their mortal coil in a timely manner, and as long as females in the state continue their preference for achieving relatively high levels of educational attainment and labor force participation (lowering birth rates), NH will have a relatively higher median age of its residents.   The youngest states (by median age) in the nation are those with higher birth rates i.e. Utah, California, Texas.   Adding population at age zero has the greatest impact and over the longest time on the age structure of a population.

It is possible for NH to achieve a relatively stationary median age through in-migration; even if the in-migration isn’t concentrated among the youngest age groups (this can be demonstrated mathematically but is not amenable to a blog post).   In fact, that is exactly what New Hampshire did for several decades during its boom years – it added a lot of individuals and families in the middle of the age distribution (30-44), typically two wage earner married couple families (probably both college educated) with children.

I think it is great, although somewhat unrealistic, to  think NH can retain all of its young people in an effort to address the “aging” issue (young people from smaller states and non-metro areas seem to have an understandable preference for locating in areas teeming with a similar demographic).   Even if NH keeps all of its young people in-state after completing their education I don’t think there is anything we can do to keep them from growing older, so as long fertility rates continue to decline the state will only be keeping a somewhat larger percentage of a declining demographic.   But that is not to say that efforts to make the state more attractive to young people aren’t valuable, whether or not they are directed at individuals born in New Hampshire.   In fact, NH should be more concerned with making the state attractive to the skilled individuals with higher levels of educational attainment, of all ages.

Our state’s ability to attract ‘talent” from other states has largely been responsible for NH’s increasing prosperity over the past several decades and that gets to the demographic trend NH should be very concerned with – the continuing decline in our nation’s mobility or rate of inter-state migration.   The recent decline has been attributed to economic conditions but there is a longer-term trend decline in inter-state migration that has been widespread across demographic and socioeconomic groups, as well as for moves of all distances.
National interstate migration rates

Researchers have noted that homeownership and the age distribution of the population (older households move less) can account for some, but not much of the decline, and some have hypothesized that changes in the labor market (reduced job changing and switching of employers) may be playing a significant role.   The chart above shows that both inter-state migration and individual rates of changing employers have been declining. While not indicative of causation, there is a strong correlation between the two variables over time.

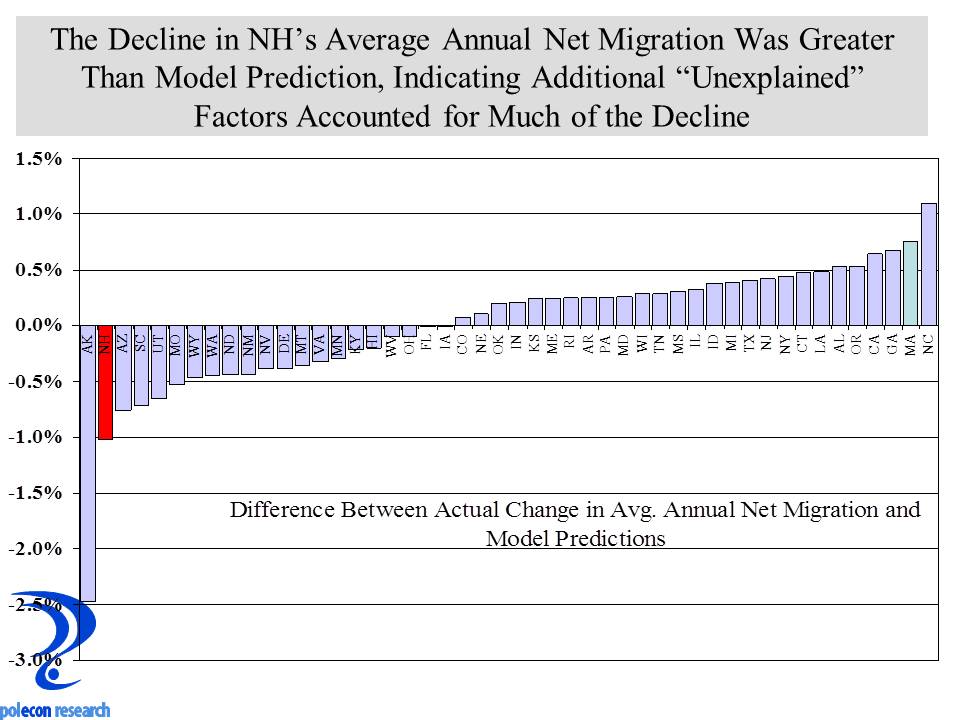
NH has seen a larger drop in its annual inter-state migration rate between the decade of the 1980s and the decade of the 2000s than almost all other states. Of course some of that is attributable to the fact that we began with much higher rates (see the drop in other states with high rates of inter-state migration) but it is still an important trend to examine.

State interstate migration change

Examining the relationship between inter-state migration and switching employers with cross-sectional (state level) rather than as a time series, shows a similarly strong relationship, suggesting to me that a more dynamic labor market where individuals are less concerned about moving between employers will maximize NH’s opportunity to increase the net in-migration.   Still, developing a simple predictive model that includes rates of switching employers to explain inter-state migration rates suggests that NH should have seen a much smaller decline in net-migration than actually occurred.   The chart below shows the model’s residuals, or errors in predicting the change in inter-state migration for each state, it shows that NH’s decline in average annual inter-state-migration between the 1980s and 2000s was actually greater than predicted by the model.   At the other end of the spectrum, Massachusetts, while having a declining inter-state migration rate, experienced a much smaller decline than predicted.   A lot of self-serving hypothesis for the above expected decline in NH’s inter-state migration rate will be offered but understanding the real causes are critical for the state’s future.

Residuals of interstate migration
New Hampshire needs to concerned with demographic trends but it also needs to be concerned with the right ones and the ones that it has some ability to influence.   I don’t think the state can or perhaps even should do much about its lower birth and certainly not the lower mortality rates that are key drivers of population aging.   But I do think that achieving a relatively stationary (it will increase it is just a matter of how rapidly) median age is possible. But this will require policies that are concerned with making NH attractive to individuals as well as businesses.   At the local level this is working as evidenced by the differences in growth rates among NH regions, but as the data in this blog suggest, in doing so the state will be pushing against larger national economic and demographic trends.


More on Shifting Economic Activity in NH

April 17, 2014

My post on the “Shifting Locus of Economic Activity in NH” back in January generated a lot of interest and emails. That post has more views than any other post on this blog over the past year and half. Admittedly that’s setting a pretty low bar as far as blog readership honors go. Nevertheless I want to thank my family as well as those with an interest in flying, swarming insects and an inability to spell “locust” in their search engines for making it possible.


As I noted in my first post on the topic, I believe there are a number of economic and demographic indicators that support my contention about the shift in economic activity. Still, there are some (many?) in the Granite State who disagree. In the spirit of giving the public what it wants and sparking debate, I present another of what will be several posts on the topic.
Some themes essential to my thesis are: that the ability to attract and retain talent (skilled individuals with higher levels of educational attainment) is the critical ingredient responsible for the shifting of activity in NH – as well as the key ingredient for producing a dynamic economy anywhere; and that communities offering amenities and services desirable to “talent” and at a relatively more affordable price are keys to attracting talent. I think price (the ability to offer desirable amenities and services at a relatively more affordable price lower than other communities that offer similar amenities) has been important. But I also think that patterns of economic activity in NH and throughout the country demonstrate that unless your community or state is sitting on a valuable store of fossil fuels or minerals, being cheaper isn’t enough to generate more robust economic activity. One interesting artifact of the debate over local government fiscal policies is the mistaken belief that communities spend more when they contain a higher percentage of lower-income residents. In fact, just the opposite is true – expectations for services, quality, and amenities, along with their costs, generally rise as communities (primarily cities – small and large) generate more economic activity and become wealthier. This typically creates a lot of conflict in communities that are experiencing new economic successes and associated demographic changes and can make sustaining a higher level of economic activity difficult for a community.
Getting back to the evidence that supports my contention about economic activity in NH, the previous decade has not been kind to NH or most states in terms of job growth. I documented the Seacoast’s increasing share of NH’s employment and in key industries in my prior post on the topic.  Here, and in future posts, I will look at some of the demographics of that job growth to support my thesis. The chart below shows the percentage change in jobs among individuals of all educational levels (age 25 and up) in different counties and the State of NH between 2003 and 2012, as well as the percentage of jobs held by individuals with at least a BA degree.

County Job Growth
Similar to my prior post, the chart shows that job growth has been higher in the Seacoast (defined here as Strafford and Rockingham Counties because of data availability while the prior post used data at the community level) than in either Hillsborough County or the State as a whole. More importantly, the chart shows that the rate of job growth in the Seacoast among those with at least a BA degree has exceeded the rates for either Hillsborough County or the State by an even wider margin. Strafford County has seen an especially large increase (largely in Dover – my domicile in the interests of full disclosure) but its much smaller employment base makes larger percentage changes easier to obtain. Again, however, it is not just job growth but the nature of that growth and the shifting of talent that is the key.
The Seacoast accounted for a higher percentage of the state’s net job growth between 2003 and 2012 (chart below). The percentage of the state’s net job growth accounted for by the Seacoast was 70% compared to 46% for Hillsborough County (note the percentages add to more than 100% because some counties had negative job growth during the time period).

Share of States Job Growth
Almost half of the net job growth in NH among workers with a BA degree occurred in the Seacoast. Hillsborough County still has a larger percentage of job holders in the state with a BA degree or higher (37% to 31% in the Seacoast) but that percentage has slipped by almost 1% over the time period, while the Seacoast’s percentage has increased by 1%. Still even shifts occurring at seemingly glacial speed are very powerful. I suppose it is possible that the Seacoast has just been more successful in adding jobs which overqualified BA’s are filling. Based on my initial examination of job growth by industry, I don’t think that accounts for the relative differences, but in future posts I will examine that and other possibilities.

To Divest or Not to Divest Electricity Generation

April 9, 2014

Whether or not New Hampshire’s largest electric utility should divest its generating facilities is a hot topic again. The NH Public Utilities Commission issued a preliminary report last week which concluded that it is in the economic interests of PSNH’s retail customers for the company to divest its generating assets. The report was less sanguine about the economic impacts on customers not purchasing electricity from PSNH, but that depends on how the stranded costs are allocated in any divestiture.

“Staff continues to believe that over the long term, PSNH’s default service rate will be substantially higher than market prices resulting in continued upward pressure on default service rates. Based on La Capra’s forecast of wholesale prices in New Hampshire and adjusted for retail, Staff’s rate analysis indicates that PSNH’s default service customers would be better off under a divestiture of the PSNH assets if the stranded costs were recovered from all customers. Customers who do not receive default service from PSNH, however, would see rate increases through the imposition of a stranded cost charge. While we recognize the volatility in today’s energy markets, the value of PSNH’s “hedge” will likely diminish over the long term and will continue to be at risk due to potential environmental legislation.”

There are also smart and well-meaning people in New Hampshire who argue that that PSNH’s generating assets provide a valuable ‘hedge” given the volatility of fuel (primarily natural gas) prices and the impending retirement of several regional electricity generating facilities. But the value of that hedge depends, in part, on the price paid for it. This winter’s cold snap and concomitant spike in natural gas prices are times when the PSNH hedge did provide some benefits. But even in those instances, the net electricity generated by PSNH was below what it was in the early and mid-2000s (the latest available data is for January of 2014 so this may change with February and March data). The figure below shows the capacity utilization of PSNH’s coal-fired generating units on a monthly basis during three separate time periods. Capacity factors are the ratio of net electricity actually generated to the total potential electricity that could be generated by a facility (for this analysis I used the average of winter and summer coal-fired capacity for each facility -Merrimack and Schiller stations – rather than the nameplate capacity).

Monthy capacity
The chart shows that from 2004 to 2009, PSNH’s coal-fired generating units were primarily ‘baseload” generators, operating at 60% of capacity or higher. I have previously written about how electricity gets sold into the regional market and which generators will provide that electricity (which determines their capacity utilization) so I won’t cover that again here. Baseload generating units typically operate 24 hours per day year-round baring maintenance outages. At the other end of the spectrum are peaking generators, which mainly operate when hourly electricity load demand is at its highest (think the hottest summer and coldest winter days). Intermediate (or cycling generating units) operate between base load and peaking generators, varying their output to adapt as demand for electricity changes over the course of the day and year. After 2009 the decline in natural gas prices along with higher generating costs, including environmental, associated with PSNH’s coal facilities have resulted in the price at which it can supply electricity to the regional grid being higher than many other generators. As long as their generating cost remain higher, except for times of peak demand, limited capacity by other generators, or when events like the spike in natural gas prices occur, PSNH’s coal-fired units will produce little electricity for sale to the regional grid. During 2013 alone, there were six months when the coal units operated at less than 10% of capacity. PSNH’s coal-fired units have gone from baseload, to intermediate generators and as the chart below shows, when averaged over 12 months, they are looking a lot more like peaking units. Whether this pattern will continue is the heart of the debate over whether PSNH should be required to divest its generating assets.
Annualized generation
It becomes a lot harder to amortize the costs of generating units as their capacity utilization is lowered. There may be times when the hedge provided by PSNH’s generating assets provides a benefit and that would be truer if the units were baseload generators. But even with the extremes of this winter’s cold, price spike in natural gas, and high demand for electricity, the chart above shows, over the course of a year, the facilities have moved from baseload generators, to intermediate, and are trending toward peaking units. The NH Public Utilities Commission, its consultants, and a lot of other knowledgeable people think that, despite current market conditions and the uncertainties surrounding regional generating capacity and natural gas supply and price, these trends will continue.

Maximizing Costs and Benefits of the Minimum Wage

April 1, 2014

Note: Links updated and some errors corrected at 6:23 pm

Lawmakers want to do the right thing on the minimum wage issue and even if some don’t, the issue is a highly symbolic indicator of one’s position on a number of important policy issues. That’s too bad because it reduces the probability that the issue will be decided entirely on its merits (benefits versus costs). With so much hyperbole on both sides of the debate it is difficult to know what the “right thing” is and raising wages for those at the bottom of the wage scale has a lot of appeal as an easier and faster way to augment income than is increasing the productivity and educational attainment of individuals.
This month the U.S. Bureau of Labor Statistics (BLS) issued a brief report on minimum wage workers. Anyone interested in the policy debates about minimum wage should at least peruse “Characteristics of Minimum Wage Workers, 2013.”  According to the BLS, about 59 percent of workers in this country are paid on an hourly basis and the percentage of that group that is working at or below the minimum wage declined to 4.3 percent last year. Thus about 2.6 percent of all workers (those paid hourly and those on salary) are paid at or below the minimum wage. Most of those workers are employed in a few industries, led by the food service industry which employs nearly one-half of all workers making at or below the minimum wage.
min wage industries

New Hampshire is immersed in its own debate over raising the state’s minimum wage. In what was largely a symbolic measure, the prior legislature repealed the minimum wage and the current legislature looks to reinstate and raise the minimum wage in the state. My analysis of data from the U.S. Census and BLS’s “Current Population Survey” (CPS) indicates that about 10,000 workers in NH earn at or below the national minimum wage of $7.25 (this number is slightly below the 11,000 estimate in the BLS report, but that report rounds the NH estimate so the discrepancy is probably less and well within the CPS’s sampling error).

number of min wage workersAnother 16,200 earn between $7.25 and the proposed new state minimum of $8.25. Thus about 26,000 hourly workers, about two-thirds of whom are mostly in the food services and retail industries, would be affected by a $8.25 minimum wage. A second proposed increase to $9.00 would affect another 13,600 workers. So all told, about 40,000 workers or about six percent of all workers in the state could be affected. I did not analyze the age composition of NH’s minimum wage workers but a 2007 study by the Federal Reserve Bank of Boston did and they conclude that younger workers comprise a larger portion of minimum wage workers in NH than in the U.S. as a whole. Almost one-half of workers at the minimum in NH are teenagers age 16-19 (chart below).

age of min wage workersWhatever the result of NH’s minimum wage debate, a lot of people earning far more than minimum are working to influence the outcome. I have no personal or professional stake in the minimum wage debate but I like the issue because it is a documentary on highly-charged policy fights, combining real and perceived forces of good and darkness: economics, emotion, populism, ideology, compassion, greed, idealism, labor versus management, as well as wealth versus want. The minimum wage debate also provides some of the clearest examples of the tradeoffs involved in public policy choices. In this case, the tradeoff is raising wages for some while reducing the employment opportunities (hours or jobs) for others. Despite what the media say, and the President’s statement that “there’s no solid evidence that a higher minimum wage costs jobs,” most economists do agree that minimum wage increases result in some economic damages (reducing employment). They don’t agree on everything about the impacts of the minimum wage, however, and a good number of reasonable economists believe that the negative employment impacts from minimum wages are offset or even outweighed by the benefits. The negative employment impacts are substantial but do not appear, to me at least, to be dramatic, which of course is a fairly insensitive view that could only be held by someone not negatively impacted by an increase in the minimum wage (who are likely to be the least skilled and with the fewest economic opportunities among us).

In any case, having some negative impacts is not, in itself, enough to reject a policy. Most people, me included, accept the fact that the tradeoff for a compassionate policy that provides a minimal cushion against the ravages of unemployment (unemployment compensation) is some increase in the rate of unemployment. There are just as many or more policies that benefit some businesses or industries but also have some negative competitive impacts or costs to consumers.

I don’t have strong feelings either way about re-establishing and raising the state’s minimum wage. Raising the state’s minimum wage will cost some businesses and/or consumers more and reduce and have some negative impact on employment and hours worked (see the Boston Fed’s study here if you don’t trust me). The chart below demonstrates (too busily) the impacts on a business of an increase in the minimum wage assuming they can’t or don’t raise prices and any increase in the minimum wage comes at the expense of profitability (that is increases is efficiencies can’t offset wage increases). Wages comprise close to 40 percent of business costs for both food service and retail businesses and the high-end of profit margin in those industries is about 5 percent so the chart also incorporates those two assumptions. Depending on what percentage of the businesses’ workforce is currently at or below the minimum wage, the chart shows how business costs increases for both the $8.25 and $9.00 increases (the red lines), as well as how profitability is affected (the blue lines). It may use simplifying assumptions but I think the chart demonstrates why businesses in affected industries are so opposed to a minimum wage increase. While expenses appear to rise modestly, profit margins can quickly erode.

business impactsMy issues with raising the minimum wage tend to be more about the distribution of the impacts than with their magnitude. Freedom from want for working Americans should be a national goal. If augmenting the income of individuals with the least earning power (because of experience, skills, education, etc.) is a national goal, it is it is hard to see why that responsibility should fall only on a few industries that employ these individuals, especially when doing so will only decrease the opportunities for employment.  That seems to be the philosophy behind the Earned Income Tax Credit.  There are other distributional impacts as well.   Those with the least opportunities bear the greatest negative employment impacts even as they also receive some benefits.   Big companies are more able to absorb higher costs and in any case are less likely to pay minimum wage, so smaller, local businesses already at a cost disadvantage can be put at even more of a competitive disadvantage.   This is especially true in rural areas. Small, rural towns have lower costs, especially for real estate, so an increase in the minimum wage gives cities and big companies competitive advantages at the expense of small and rural employers.

As is the case with most policy debates, proponents of a minimum wage increase maximize benefits and minimize costs while opponents minimize the benefits while maximizing the costs.


%d bloggers like this: