Archive for the ‘Uncategorized’ category
April 11, 2019
In a presentation I gave to the NH Senate Ways and Means Committee I noted two important wage trends. First, the average weekly wage of NH workers today is actually a bit lower than it was in June of 2017. This does not mean that no worker’s wages are increasing. Rather, it reflects the mix of industry and occupational job growth in NH. Lower productivity and wage industries have added more jobs in NH than have higher productivity/wage industries.
Second, the weighted average weekly wage in the industries that added jobs in 2018 was $946 while it was $1,163 in the industries that lost jobs. But it is not accurate to suggest this implies the NH economy is somehow being “hollowed-out” of higher paying jobs. Data from the end of 2018 showed that there where 50% more job openings in the state in occupations that require a college degree (9,522) compared to jobs that don’t require a degree (6,132) at the same time there were 60% fewer individuals looking for a job and who have a degree than those looking for a job who don’t have a degree (5,532 vs 13,380).

Labor shortages are significant in all industries but higher skill jobs are much harder to fill so more lower skill/wage jobs are being added while higher skill jobs go unfilled, skewing the job growth mix and lowering wage growth trends in the state. Other contributing factors to slower average weekly wage growth in include a small decline in the average number of hours worked per week by employees in many industries.
Categories: job growth, Uncategorized, wages
Tags: job growth, NH economy, wage growth
Comments: 2 Comments
April 2, 2019
For the calendar year 2018, federal corporate tax revenues were about $91.4 billion lower than during calendar year 2017, a decline of about 32%. The federal corp. tax cuts that took effect in 2018 lowered the tax rate from 35% to 21% and are the primary reason that federal revenues were 0.4% lower in calendar year 2018 compared to 2017 (in a strong economy). All banks are required to file detailed financial reports to regulators on a quarterly basis. Examining that data provides an estimate of how banks were affected by the recent federal tax cuts. Comparing the average effective tax rate of banks between 2013 and 2016 (in 2017 banks paid an an anomalously high rate) to the rate in 2018 and applying the difference to the pretax income of banks provides an estimate of the savings banks received from the corp. tax cut. The table below shows that collectively, banks accounted for $31.7 billion or about 1/3rd of the total corp. tax cut savings, with the 9 largest banks saving almost $15 billion or 16% of the total corporate tax savings in 2018 – an average $1.64 billion per bank. I expect banks, and big banks in particular to have an issue with this estimate so I encourage them to point out errors in my simple methodology.
Categories: Banks, corporations, Federal Deficit, tax cuts, Uncategorized
Tags: banks, tax cuts, tax rate
Comments: Be the first to comment
March 14, 2019
The monthly payroll employment report gets a lot of attention. The monthly estimates are based on a survey sample of employers (differing from the monthly survey of households that is the source of unemployment and labor force estimates). Prior year monthly payroll estimates are revised early each year as more complete data (than the sample survey) are analyzed. For a number of reasons (including the fact that newer firms are slow to get included in the survey) NH’s employment estimates more often than not have shown stronger (than first reported) job growth rates. Not this year. The new benchmark numbers have cut the state’s annualized job growth by more than half (to below 1%). The chart below shows the year-over-year growth rate in private sector employment in NH is about 1% (including government employment shows a slightly slower rate of job growth 0.8%).

Early in 2018 I forecast NH’s job growth for 2018 would be about 0.6% (based on labor force constraints – not a weaker economy) and for several months I have been issuing a mea culpa for what looked like a significantly inaccurate employment growth forecast. While my sagacity is less challenged than I originally thought, I was more comfortable with NH’s employment trends when it was.
Categories: Employment Growth, job growth, Labor Force, NH Economy, Uncategorized
Tags: job growth, labor force, NH economy
Comments: Be the first to comment
January 2, 2019
In my economic presentations I often say that I am ‘frequently in error but rarely in doubt.” Still, when in error I admit it, it’s a sign that I am willing to ask myself “why” in order to improve my methodologies. I was wrong when I predicted NH’s job growth would be under 1% in 2018 (it is double that), largely because the labor force was able to grow more than I had forecast (see my previous post on net in-migration to the state). In a letter to Congress over 100 economists asserted that “the macroeconomic feedback generated by the “Tax Cuts and Jobs Act” would be “more than enough to compensate for the static revenue loss,” implying that the bill would be deficit-neutral over time. Federal revenues have a seasonal (monthly) variation, with some months bringing in more revenue than the government spends and vice versa. Comparing similar months over time thus offers some insights into the deficit trends over time and in different economic conditions. As the chart below shows, the November 2018 monthly deficit (the most recent data available) show that during a period of solid economic growth the U.S. ran the highest November monthly deficit in its history.

Proponents of the bill also claimed that we would see enough additional investment to boost growth by 4% per year. That implies an increase in annual investment of roughly $800 billion. But, as this post noted, investment has not jumped to that level, nor does it show signs of doing so anytime soon. The economists who predicted that tax cuts would spur a rapid increase in investment and higher revenues have been proven wrong. They have also remained silent, which suggests that they are not at all surprised to see revenues and investment fall far short of what they promised. Many, if not most, will dismiss the rising deficit (see below) during times of solid economic growth as a function of rising spending.

Rising spending is, in fact, a major but not unexpected contributor to the deficit problem. Stagnant or declining revenues in a strong economy are not the norm, and are the kind of pro-cyclical fiscal policy (cutting taxes in a strong economy instead of filling coffers during a strong economy so that taxes can be cut to stimulate the economy when it is weak) that is going to make the next economic downturn much more difficult to combat.
Categories: Federal Deficit, Federal Spending, Fiscal Policy, Tax Revenue, Uncategorized
Tags: deficit, federal deficit, federal spending, tax cuts, tax revenue
Comments: Be the first to comment
December 28, 2018
There is no more overblown or misunderstood issue in NH than its demographic trends. There are challenges to be sure but almost all of the popular memes don’t withstand solid empirical analysis. NH’s extremely low birthrates among women 15-44 (first or second lowest in the nation over the past many years – again a sign of NH’s successes not failures as it is a result of women in NH having with high levels of educational attainment and who have a high level of participation in the labor force) means the state must rely on net in-migration for labor force and population growth. I have argued for more than a decade that there is nothing that has fundamentally altered NH’s attractiveness as a place to live, despite a number of years recently where more individuals moved out of the state than moved into NH. During times of recession NH tends to lose educated and talented people to places with more opportunity, while the housing crash that prompted the last recession made it especially difficult for NH’s core in-migration demographic (two wage earner, married couple families, ages 30-44, with children) to move into NH because they likely would have had to sell a house with an underwater mortgage and they would also have wanted to buy a house in NH (both of which were much more difficult between 2007 and 2013). Like all rural states, NH also sees a high percentage of young people leave and that has not changed in decades. The good news is that net in-migration to NH is resuming and gaining steam, NH had the 6th highest rate as a % of its population of any state and the demographics of in migrants were a bit younger than prior years. In addition, about 55% of in-migrants to NH over the past five years have a post-secondary degree, adding to the overall skill level of NH’s population.

Still, net in-migration tends to be concentrated in a few areas of the state, the Seacoast, Strafford and Rockingham Counties in particular, and in several communities. While state policymakers worry about statewide demographic trends it is most important to remember that the state and its communities are not monolithic. Trends vary greatly across communities and it is the decisions and policies of local communities that most affect demographic trends. It would be wise for policymakers and local officials to look to the characteristics of communities that are bucking the trends about which policymakers are most concerned (aging, out-migration, etc.) for prescriptions to address their concerns.
Categories: Demographics, in-migration, migration, NH, Uncategorized
Tags: Demogrphics, migration, NH
Comments: 2 Comments
December 21, 2018
Federal corporate tax revenues have fallen about 30 percent on a year-over-year basis since the tax rate w as lowered from 35% to 21% in January.

A lower tax rate increases the return on investment and should provide an incentive to investment. That was the rationale for the recent tax cut. Business investment increased some after the cut but has barely increased (1% not annualized) in the most recent quarter. But here is the thing, businesses won’t make investments if they don’t see profitable opportunities. There are likely to be fewer opportunities for profitable investment as the economic expansion ages. So while a corporate tax cut was needed, the stimulus value of a large tax cut late in the business cycle was questionable.

Enacting some smaller cut, helping the government avoid depleting its coffers during a period of solid economic growth, and saving any additional cuts for a time when the economy is weaker, would have been a better path. For the same reason that very low interest rates in a strong economy limit the ability of the Federal Reserve to stimulate the economy as growth weakens, so too does a large corporate tax cut in an economy with near full employment and with solid economic growth.
Categories: Fiscal Policy, Tax Revenue, Uncategorized
Tags: Business Investment
Comments: Be the first to comment
November 28, 2018
In the last six years the share of light vehicle sales (sedans, station wagons, SUVs, pickups, minvans) in the U.S. that were autos (sedans and station wagons ) versus light trucks (pickups, minivans, SUVs) has declined by 20%. Autos are now about 30% of all light vehicle sales, in 1990 the percentage was 65%. Of the top 5 selling light vehicles in the U.S. in 2017, only the Toyota Camry is a sedan and there was not a single American made sedan in the top 20 selling vehicles. 
By far, the top selling vehicle is the Ford F series pickup, selling more than twice the number of the top selling sedan, and 60% more than the next best selling vehicle (the Chevrolet Silverado pickup). The market has clearly changed, helped by lower gasoline prices, recent changes in CAFÉ (fuel efficiency) standards, and most importantly consumer preferences. GM recently announced the closing of several manufacturing facilities. I worked on 2 energy projects in Lordstown, OH where GM built its (once) popular Chevy Cruz and it is painful to hear that GM will be closing that facility after what was a period of renewed optimism in the region.
Categories: Automobiles, manufacturing, retail sales, Uncategorized
Tags: Auto manufacturing, car sales, consumers
Comments: Be the first to comment
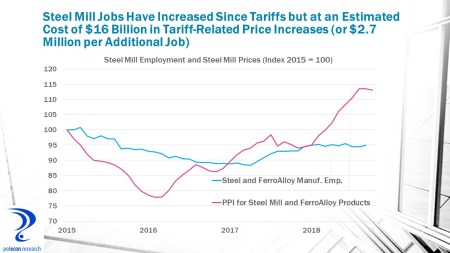
November 16, 2018
There are about 86,000 steel mill jobs in the United States, down from a decade ago when it was about 100,000. At its nadir in early 2017, steel mill jobs were under 81,000. About 6,000 jobs have come back since tariffs were introduced, but the producer price index (PPI) for steel mill products also soared as a result. The value of U.S. steel mill output was about $78 billion before tariffs while the producer price index for steel mill products has risen just over 20% since tariffs . Those numbers imply a cost of tariffs to purchasers of U.S. steel mill products (U.S. companies and governments) of about $16 billion, as well as a cost per job saved of about $2.7 million. If instead of tariffs the U.S. had offered each of the 6,000 laid-off steel mill workers a generous $100,000 stipend per year for 3 years to replace lost pay and benefits and to retrain, it would have cost $1.8 billion, saving U.S. companies and governments $14.2 billion in tariff-related costs. A less than 1% surcharge on imported and U.S. steel mill products could have paid for such a policy without adding to government debt. I’m not arguing for such a policy but that 1% seems like a small price to pay to avoid punishing 20% price hikes.
Categories: International trade, manufacturing, Tariffs, Uncategorized
Tags: employment, Energy prices, imports, Manufacturing, steel, Tariffs
Comments: 1 Comment
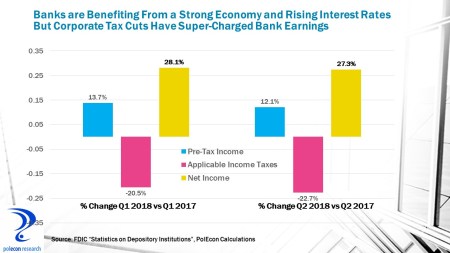
October 15, 2018
It’s a good time to be a bank, well a BIG bank anyway. Bank of America’s Q3 profits are up by 32%, JPMorgan/Chase’s by 24%, Wells Fargo by 32% in the 3rd quarter. Higher interest rates, a strong economy and needed (for smaller banks) regulatory relief have helped but the biggest contributor has been the reduction in the corporate tax rate. Industry-wide Q3 results have not yet been reported but looking at Q2 and Q1 2018 data compared to 2017 shows the impact of tax cuts. While banks pre-tax income was up by 12-13% in 2018, net income was up 27-28% because applicable income taxes (federal & state) were down more than 20%.
The banking industry has been perhaps the biggest beneficiary of the Trump administration’s initiatives. Earlier this year I examined over 400 press releases announcing how companies would be using the proceeds from corporate tax cuts and highlighting employee bonuses, minimum wage hikes, etc. (the releases were remarkable in their similarity as were the benefits accruing to employees – a small percentage but more about that in a future post). Despite banks being only about 1% of all business enterprises thy accounted for just over 30% of the press releases highlighting worker and civic benefits of the tax cut.

Categories: Banks, regulation, tax cuts, Uncategorized
Tags: banks, deregulation, tax cuts, wage growth
Comments: Be the first to comment
October 11, 2018
Repetez moi: “tariffs are stupid.” Our President, who should know better, said the U.S. has collected billions of dollars from China as a result of the tariffs placed on imported goods. Well no, not exactly, actually not even close. Those billions of dollars have been collected from U.S. companies and manufacturers importing products and materials (like aluminum and steel, electronics, etc.) for use in the products and services that they sell. Tariffs have already cost Ford Motor Co. $1 billion in profit. U.S. consumers are also paying, until recently only on a few products (the CPI for laundry equipment was falling for about 10 years but is up 13% over the past year) but who will soon see prices on more products affected, as tariffs are placed on more products. Auto workers who were promised protectionist policies would spur manufacturing job growth must be disappointed as growth has fallen since 2017 and has been negative since mid-2017. Obviously, there are other influences on emp. growth in autos but protectionism isn’t helping. NAFTA version 2 (which looks a lot like NAFTA version 1) is hailed as the next savior for employment. Why not, those protectionist promises have worked-out so well thus far.

Categories: E, Employment Growth, International trade, manufacturing, Uncategorized
Tags: Auto manufacturing, Autoworkers, employment growth, NAFTA, Protectionism, Tariffs
Comments: Be the first to comment


