Archive for February 2013

Where Never is Heard a Discouraging Word

February 27, 2013

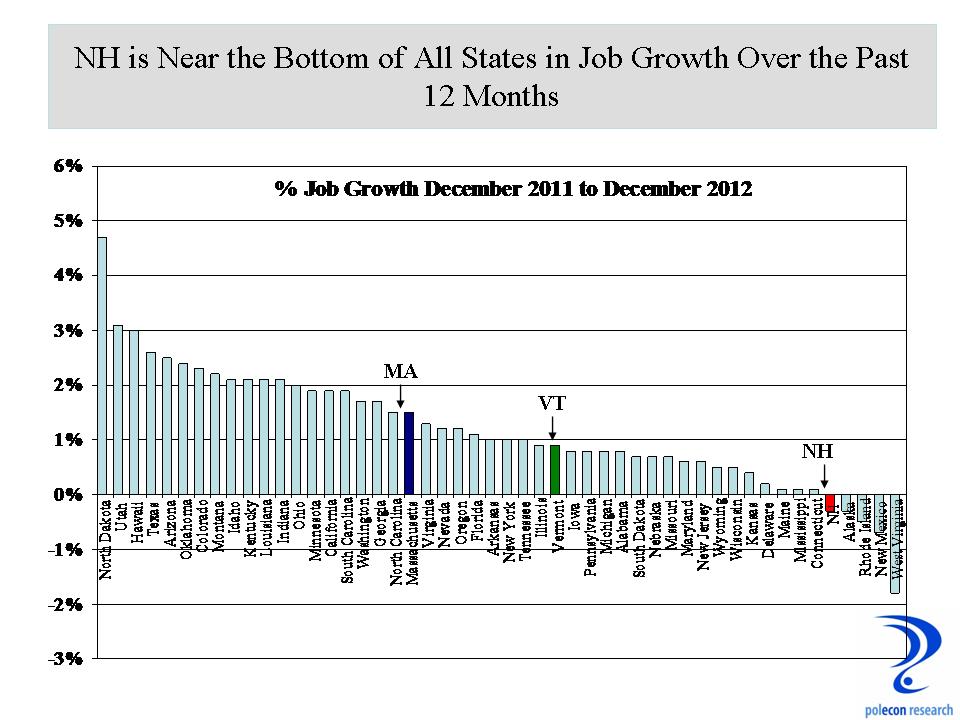
Without an accurate assessment of where you are you can’t chart a course to get to where you want to be.   In the context of efforts to strengthen regional and state economies, however,  plotting your coordinates seems especially difficult.   For decades New Hampshire (including me) has become accustomed to hearing that its economy is “doing better than most other states”  and that we can expect to grow faster than a majority of states and all other states in the Northeast.  I have blogged here several times about how that is not currently the case but because about five people read this blog there isn’t much fallout.  But  when someone like me suggests, in a public forum,  that NH is lagging and that superior growth is not currently the case for the state, you can expect some incredulity and push back.

State 12 Month Job Growth

When you speak in a community and present lots of data that suggests it is lagging even more, then you can expect the push back to more likely come with a closed fist.  And when that community is close to where you live, well  it’s probably best to get an unlisted phone number.  I’m no prophet but if I were I  think it would  probably be impossible to be one in your own land.  I like to be the bearer of good news but when the data doesn’t suggest good news is warranted I don’t change the data or the news about it that I bring.  Long ago I learned that being right too early will feel a lot like being wrong.  I don’t know who was more offended by my presentation yesterday at a local chamber of commerce, people who feel I know nothing about their community, the people who think I know nothing about New Hampshire, the people who think I don’t understand the U.S. economy, or the people who think I know nothing about any of these.   An informal tally to-date suggests about an even split.

I am not a twitter user or follower, I am only marginally able to follow my own thoughts and activities throughout the day, but if I were and if I were able to expand the size of a tweet, this is how it would summarize my remarks at the chamber forum:

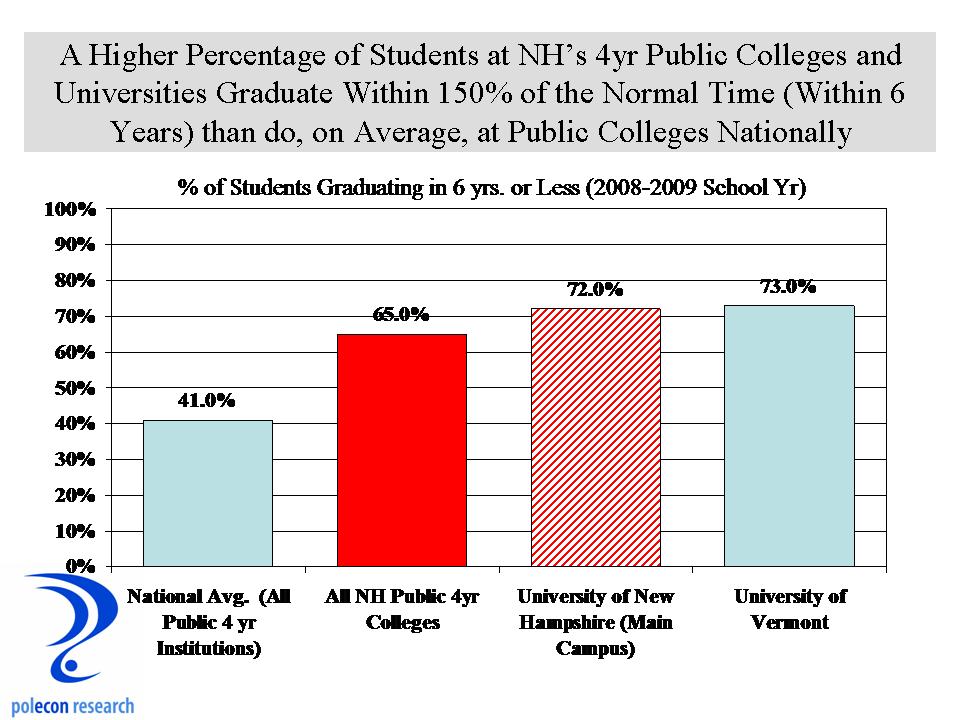
Economic growth is increasingly associated with concentrations of skilled, well-educated individuals and any state’s, region’s, or community’s longer-term prosperity is likely to be correlated with its ability to attract and retain these individuals.  The ability to keep and attract this demographic is as much a requisite for job growth as it is a result so any region’s development strategy should attend to its capacity to appeal to this  demographic and look to leverage the associated economic benefits .  Understanding the direction of these trends in your community or region, likely tells a lot about recent and future economic performance.

If you happen to discover oil or shale gas under your state or community that tweet applies a lot less.  In addition, small communities can see strong growth from just one or two businesses, but with some exceptions and over the longer-term,  I think the summary holds true.   I am a first generation college graduate and my beginning, and likely my ending, doesn’t warrant even a whiff of elitism of any sort.  But making an association between educational attainment and economic growth apparently implies a disparaging of those who are not college graduates, just as the notion that NH’s economy is growing more slowly than some of the states that we are accustomed to regularly outperforming apparently implies an indictment of “the NH way” compared to to other states.

One or two years of weaker economic growth is not a signal of apocalypse, but its not a bad idea to wonder if it is and to consider ways to avoid it.   For me, the apocalyptic story  for NH would be that, over the longer-term, we become a slow employment growth state that is also a higher cost-of-living state.

State Cost of Living

High costs and slow employment growth have characterized too many states in the Northeast as well as California and they have all suffered as a result.  But at least in California you still have nice weather.

Taking Aim at the Data in Gun Policy Debates

February 21, 2013

I have no problem with guns or  most of the people who own them, just like I have no problem with cats or the people who own them, except that maybe I like cats a little less.   Guns are a “hot-button” issue that makes reasoned policy debates difficult.  What makes the debates especially difficult is the relative lack of data available that could increase understanding, help inform  decisions, and which might help reduce the relative importance of emotion, ideology and other non-empirical sources of information in policy making.  I am not advocating anything in this post except for the availability of more data.  There can never be too much garlic, cowbell, or data.

I started this post with the idea of looking at gun sales in the U.S. and some states to look for some correlates of trends in gun sales.  I was surprised to find no publicly available data on gun sales.  Data on background checks is available, and on the number of firearms reported stolen (by state), but no direct sales data.  Because the Celtics were down by as much as 20 points to the Lakers last night I spent more time researching than usual and found some interesting but not quite satisfactory data that tells a story but an incomplete one.  First, production of  small firearms is booming, and has been since just before the last recession (see chart below).

U.S. Gun Production

Was it the election of President Obama and concerns about new gun laws?  Was it a severe worldwide recession  that prompted more “doomsday preparations?”  Or was it the apparently rising probability of a “zombie apocalypse?”   The chart shows that while production doubled between 2002 and 2011, by far the largest increases was in handguns (pistols and revolvers).  Handgun production tripled during the decade.  I know rifles and  assault weapons get most of the attention but when handgun production triples that says to me that concerns about individual safety and security are big reason for the trends (assuming that there has been no fundamental change in the ability of criminals and bad guys to get hand guns during the decade).  Interestingly, according to data from one sportsman’s association, New England owns a smaller percentage of handguns than would be expected given the size of its population, while our rates of rifle and shotgun ownership is at or above what would be expected.  It  does not appear that the increase in production is due to manufacturers exporting more firearms because the percentage of firearms exported has actually dropped slightly during the decade to a low of 3% in 2011.  But it is hard to know what is really happening from this indirect information in the absence of better data on gun sales.  I don’t care about people’s names being associated with the data, just like I don’t when I look at millions of bits of U.S. Census data.

Other data comes in the form of the tax imposed on U.S. gun manufacturers and importers.  Since the early 1990’s, manufacturers and importers of guns have been required to pay 10% or 11% of the sale price of the guns they produce or import.  This data, along with production data, adds some information about concern over an “influx” of imported guns but it still doesn’t capture information about sales at the retail level, including repeat sales.  The chart below shows the volume of gun manufacturer and importer quarterly tax collections on an annualized basis.

Firearms Tax Collections

The data are inflation adjusted to 2012 dollar values using the producer price index for small firearms and ammunition, thus it provides some information about the volume (number of firearms produced) not just the dollar value of what is produced.  But because the mix of guns produced changed over the decade (more handguns produced relative to rifles), it still doesn’t give an accurate reporting of sales, only an indication of trends. The increase in tax collections seems more dramatic than the already dramatic increase in guns manufactured so this could indeed be an indication of  an influx of imports, but it may also just be an indication of the changing mix of guns manufactured and differences in the prices of the  types of guns manufactured or imported.  So who knows what is really happening to gun ownership and by whom?

A lot of people I know clamor for more transparency and openness in the process of public policy making and, like me, they often complain about the ability of the public sector to provide the data and information necessary for the public, lawmakers, and policy nerds to make informed choices.   Many of those same people have no problem with the relative dearth of data related to guns and gun sales.  The absence of data invites suspicion and suspicion invites inquiry and its a surprisingly short trip from inquiry to inquisition .

The Coming Matriarchy in the U.S.

February 12, 2013

I received a great comment/question  about my post “Why Can’t a Man Graduate More Like a Women” asking about the potential impact of Title IX on the rise in the percentage of female college graduates relative to male college graduates.  I didn’t have a good answer or much empirical evidence then but as is my custom I responded as if I did.

Title IX is most often identified with efforts to equalize opportunities to participate in intercollegiate sports for women but its real purpose was to prevent discrimination in education based on sex.  Title IX is a portion of the Education Amendments of 1972 and is also known as the Equal Opportunity in Education Act, it said:

No person in the United States shall, on the basis of sex, be excluded from participation in, be denied the benefits of, or be subjected to discrimination under any education program or activity receiving federal financial assistance…

Rules for its implementation were finalized in 1975 and since it was implemented the number of young women attending college on a full or part-time basis has increased by 138% compared to 47% for young men.

Male Female Enrollment Growth

Since the percentage of young women and young men hasn’t changed much since 1975, the differential growth rate is attributable to increasing enrollment rates for women.   I can’t say  how much of this is attributable to Title IX, a lot of things began to change for young women in the 1970s and female enrollments jumped between 1970 and 1975 as well (see chart below).

Male_Female Pct of Enrollment

Women now comprise about 57 percent of all undergraduate students in this country.  The growth trend seems to have stabilized somewhat in recent years – recessions tend to limit employment opportunities for young men more than for young women and this can prompt greater college enrollment among young men.

Male_female Unemployment Rates

A lot of progress has been made by women in this country since 1975 but it is hard not to see the association between the growth in female college enrollment and implementation of Title IX.  I am sure some readers will note Title IX’s shortcomings and more may object on principle to anything that seeks to equalize opportunities among our citizens.  But ideology often causes temporary or permanent blindness.  I’ve noted my interest in gender issues as the father of daughters and I blog frequently about gender and economics (select  the “gender” category to see some) but the issue has profound implications for the future of this country;  economic, political, as well as social.  Women are increasingly contributing to the quality of  “human capital” in this country.  There are now more women working in New Hampshire than men.  It is a great development that would be even greater absent the disturbing trends among young men.

From a political perspective (isn’t everything political these days?) the feminization of the workforce as I have called it (not pejoratively) along with the relationship between educational attainment (college graduates) and voting for Democratic candidates should prompt leaders of the Republican Party in this country to consider their relatively lack of appeal to women, especially younger women because as I see it, and as my daughters no doubt hope, it won’t be long before women will rule this country.

Tilting at Windmills?

February 11, 2013

“Do you see over yonder, friend Sancho, thirty or forty hulking giants? I intend to do battle with them and slay them. With their spoils we shall begin to be rich for this is a righteous war and the removal of so foul a brood from off the face of the earth is a service God will bless.”     

Don Quixote

I hope I am not, but I probably am, the only person that sees the irony in the fact that the latest wind farm battle in New Hampshire involves a Spanish developer of wind farms (Iberdrola Renewables).   The proposed wind farm near Newfound Lake has many of the residents in that area concerned about the visual and noise impacts of the project.  Electricity generation from wind has grown significantly throughout the country over the past several years and along with this growth has come a concomitant increase in opposition to the projects.

Wind generators accounted for a significant portion of capacity additions since 2007 (see chart below), and were the largest source for generating capacity additions in 2008 and 2009. If all planned wind generators in 2012 come on-line, as reported by industry participants, wind capacity additions could top 12,000 MW for this year. This would account for 45% of total additions and exceed capacity additions from any other fuel source, including natural gas, which was the leading fuel source for electric generating capacity additions in 2010 and 2011.

additionsbytype

The wind energy production tax credit (PTC), along with state-level policies, has boosted the growth of the U.S. wind industry over the past decade and the anticipated expiration of the PTC at the end of 2012 created a rush to complete projects in 2012.  This tax credit was first implemented in 1992, when the United States had less than 1.5 gigawatts (GW) of installed wind capacity. By the end of 2011, wind capacity stood at more than 45 GW, about 4% of U.S. power generating capacity, and provided 3% of total U.S. electricity generation in 2011.

The most recent state level data available on electricity generated from wind (2010) show that less than 1% of NH’s electricity was produced by wind but with recent projects in the state that figure is outdated.

Wind Generation by state

I don’t know what the future of wind power is in New Hampshire.  I have no professional or business stake in the issue. Like everywhere, aesthetic issues and local opposition will play a prominent role in determining its growth but there are other issues that must be considered if policymakers are to make reasoned decisions about its efficacy in meeting the state’s power needs.  The two most often cited concerns about wind as a source of electricity (besides aesthetic and local opposition) seem to be that turbines are so inefficient that they actually increase carbon dioxide emissions, and that they are so unreliable that they require constant backup from conventional coal and gas-fired generators.  Concerns about increased carbon from wind seem misplaced to me.   As electricity demand increases, say on a weekday morning when people are waking up and getting ready to go to work,  power plants increase output to meet it. Plants with the lowest marginal cost – that is, those that can produce additional electricity most cheaply – are selected first by the market. Here wind beats gas and coal, as no fuel is needed to generate electricity.  So in theory at least,  adding wind power to the energy mix should displace coal and gas, and hence cut carbon.  On the important matter of reliability, the obvious worry is that because the wind does not always blow, the system will sometimes not be able to supply electricity when needed.  This seems like common sense.   But the reliability of wind power does not depend on the variability of wind, it depends on how well changes in wind power output can be anticipated. Forecasts of wind farm output are increasingly accurate, and drops in output can be predicted and compensated for using conventional power stations.

I have driven by wind turbines in several states and am in awe of their size visual impacts.  I don’t know how I would feel about living near them,  but I also can’t ignore that the world (especially in the UK) is increasingly using wind power as a way to limit fossil fuel consumption and carbon emissions.

The Lastest 50 State Economic Outlook

February 7, 2013

Back in October I posted about the Federal Reserve Bank of Philadelphia’s leading index for each of the 50 states.  The Fed’s leading index for each state contains the same, six, state and national variables so I think they miss some of key indicators that can affect individual states but they are a great way to quickly compare the trends across states.  It is  also good to get a dispassionate, “outsider’s” view of the direction of every state’s (including your own)  economy.  Below is the latest summary of what each state’s  leading index is saying about the growth prospects over the next six months.

LeadingIndexes1212

Unfortunately, NH is again showing up in the group of states that is expected to lag in economic growth over the short-term.  PolEcon’s NH Leading index contains more NH specific economic indicators than does the Philly Fed’s NH Leading Index but the two indices generally agree on the short-term direction of the NH economy.  Not this time.  PolEcon’s NH leading Index is signalling an uptick in the rate of NH’s employment growth.  As I noted back in October, statistical tests show a stronger relationship between PolEcon’s Leading Index and the rate of NH’s employment growth than the relationship between the Philly Fed NH Index and NH’s employment growth.  I wish I could say I was confident my index was going to be more accurate this time but I can’t.  I do take some comfort in knowing  that whenever I have had the most doubts about the predictive ability of the NH Leading Index it always seems to do the most to confirm its value.

NH Leading Index

The Surest Way to Limit the Cost of College is to Graduate on Time

February 5, 2013

Since my last post on the potential for a student debt crisis I’ve been asked several questions about what is happening in New Hampshire.  I can’t adequately answer those questions here but since it is being reported that the University System of NH is holding-off setting tuition rates until the next state budget is clearer, I thought I would take a quick look at one college cost trend in NH along with what I think is one important metric when considering the cost of college.

It is not an epiphany that the cost of college is rising faster than the cost of most goods and services and it is generally recognized that the cost of college at NH’s public higher education institutions is higher than the national average.  What is surprising is that over the past decade, costs at NH’s public 4 year  institutions have risen less than the national average.  I am not saying that they haven’t risen well above a comfortable rate, just that given the constraints of state support, tuition and fees, as well as total costs for in-state undergraduate students  at NH’s public colleges have risen more slowly than the national average.

Rise in Cost of Public Colleges

It sure didn’t feel that way over the past several years as I have had the pleasure of sending two children to different public universities identified as having among the highest costs of any public universities in the nation (UVM and UNH).  But a lower annual cost doesn’t mean as much if it takes more years for a student to graduate.  Fortunately a higher percentage of students graduate within 150% of “normal time”  at NH’s (and VT’s) public 4 year colleges than they do nationally (see chart below).  So far my students are 2 for 2 in graduating on-time and the next one is in the batters box in North Carolina, what are the chance that we can bat 1000?

Graduates within 6 years

The Looming Crisis in Student Debt

February 1, 2013

Student loan debt has grown much faster than other types of debt.  As the chart below shows, student loan debt has been exploding  and now exceeds both credit card and auto loan debt in the country.

Student debt volume

According to a recent study by Fair Issac Inc. (FICO), newer vintage loans have a much higher risk of default.  Higher debt loads for graduates and non-graduates have combined with protracted weakness in the labor market (especially for recent graduates) to produce a dramatic increase in the volume of  delinquent student loans.  Although the volume of student loan debt has never been close to the volume of mortgage debt in this country (mortgage debt peaked at about $9.3 trillion in 2008 while student loan debt is just now reaching $1 trillion), there is still the potential for rising defaults to have significant impacts on many financial institutions, if not the system as a whole.  The percentage of student loans that are seriously delinquent is currently twice as high as the percentage of mortgage loans that are seriously delinquent.  Despite student loans being a much smaller overall volume of debt than mortgages, the dollar volume of seriously delinquent student debt is over $30 billion and climbing compared to $8o billion of seriously delinquent mortgage debt on an aggregate balance that is nine times the volume of student loan debt.

seriously delinquent student debt


%d bloggers like this: