Archive for March 2013

Electricity Prices Highlight the Benefits of Markets and Choice

March 28, 2013

Four of the six New England states (CT,ME, MA and NH) had lower average retail prices for residential electricity customers in January of 2013 than they did in January of 2012 (chart below).

Chang in Avg Retail Price of Electricity

Most of that is a result of the increasing sales into the region’s electricity market  of electricity generated by natural gas which is priced lower than the electricity generated using other sources.  The decline in the average price in NH is smaller than in some other states but it could have been, and could still be,  larger if retail competition in the residential electricity market takes hold.   The chart below shows the average cost of retail electricity for residential customers in the continental United States in January of 2013.  New Hampshire and all of New England have among the highest average rates but based on the contract information from the largest competitive suppliers of residential electricity in New Hampshire, the average price would be significantly lower (at least until November of 2013) for those who choose the lowest rates available from competitive suppliers (other higher rates are available that let customers choose to purchase a higher percentage of electricity generated from ‘green” sources).

Avg Residential Price of Electrictyby State

I was going to make this a much longer post and include a discussion of why the warnings by some about an “over-reliance” on natural gas in the region are overstated but not inaccurate (the natural gas pipeline limitations to the region are real but more likely to be remedied than not with increased natural gas usage in the region) but I will save that for another day.  The reputation and belief in free(er) markets and competition have taken a beating over the past several years so  for now I am just going to enjoy highlighting  of  one of their recent successes.

Gasoline Taxes, Prices, and Price Differentials

March 27, 2013

Policymakers often assume that sales and excise taxes are the primary reason for variations in the price of goods and they too often assume that consumers consider differences in tax rates across jurisdictions when making purchases rather than differences in the total price (tax plus non-tax price) of a good.  A good example was the $.10 drop in NH’s cigarette tax in 2010.   Some thought the decrease would be a beacon to NH for consumers.  But the decline did nothing to lower the price of cigarettes in NH because manufacturers increased their price by an equivalent amount immediately after the tax decrease (effectively capturing the revenue that would have gone to the State of NH).  I did a fair amount of gloating in an early post as the revenue numbers reflected my predictions. Consumers saw no price break and no major changes occurred in other states so no increases in competitive advantage for retailers occurred in NH (retailers saw no benefit) and the longer-term trend of declining smoking rates (along with a things like higher gasoline prices and fewer visitors to the state) were the primary determinants of sales trends, and thus lower revenues.

The demand for gasoline, like cigarettes, is relatively inelastic so it takes a surprisingly large price increase to change consumption very much but differences in prices among  locations may shift the location of some gasoline sales where consumers can conveniently choose where to make their purchases.  I can buy gasoline as easily in Maine as in NH and with a little more effort I can also buy in MA.  I often can get gasoline as or even a bit cheaper in MA than in the town where I live,  but I can’t get gasoline cheaper in Maine.  I can also get gasoline  cheaper if I drive a few miles to towns just north and south of me, or even to a gasoline station on the other side of town.   These price differences are often $.10 per gallon and occur among retailers of similar types – i.e. gasoline stations with a convenience store, the same brand convenience store selling the same brand of gasoline.   Nevertheless, when I look at the average price of gasoline between neighboring states (with some exceptions like California where environmental regulations have large retail price impacts), the differences in price appear  to be strongly related to differences in state tax rates (r=.82).  Comparing statewide average prices and tax rates for gasoline masks much of the variation in pricing that occurs within states and even within communities.  That is one reason why I think policymakers focus so much on tax rates as the primary reason for price differences.

State Gasoline Prices

Despite all of the attention to gasoline prices and proposals to raise or lower gasoline taxes over the past decade there has been surprisingly little research on the retail price impacts (or “pass-through” effects) of changes in gasoline taxes.  That may be because changes in gasoline taxes are relatively small (usually a few cents) compared to the much larger price changes that occur as a result of  supply/demand issues and variations in the world-wide price of oil.  The chart below shows how gasoline prices in NH have changed since 2004 and it also shows the theoretical price if the state had no excise tax on gasoline.  The red line shows the theoretical prices because, like cigarettes, retail prices may or may not be reduced by an equivalent amount if the gasoline tax were lowered.

Monthly NH Gasoline Prices

The theory of tax incidence suggests that sales and excise taxes should be fully passed on to consumers in competitive markets with constant marginal costs.  Less than full “pass-though” is expected in markets with increasing marginal costs, while the pass-through rate may be less than, or greater than, one-hundred percent in markets that are less competitive.  In addition, tax increases in one state may lead to higher prices across the border as stations there face greater demand.  A study examining a temporary reduction and reinstatement of a 5% gasoline tax in Illinois (sorry I can’t find the reference)  found that that when the 5% tax was eliminated, prices declined by 3% and when the tax was reinstated prices rose by 4%.

Politicos are looking to score big points for their positions on gasoline taxes.  There was a time when whatever marginal changes lawmakers made to gasoline taxes may have meant a lot to changes in prices at the pump.  Right now, and in the future, changes in world-wide oil markets are likely to overwhelm  any impacts from changes in state taxes and  together with the uncertainty over the degree of pass-through, make any predictions about the economic impacts of gasoline tax hikes nearly impossible.

Funding Roads and Bridges to Perdition

March 25, 2013

Gasoline taxes, road tolls and highway infrastructure spending are issues at the forefront of a lot of heated debates in state legislatures across the country.  I am going to write about the issue a couple of times this week.   Some lawmakers want to raise sales or other taxes to pay for infrastructure and others want to increase gasoline taxes and other “user fees” to pay for it.   The highway infrastructure spending and revenue issue can illustrate classic principles of sound fiscal and economic policy so it is too bad that the debates have generally taken the “low road” by framing the issue almost entirely as either one of “who wants to raise taxes and who doesn’t,” or “who wants to makes roads and bridges safe and who doesn’t”.

User fees are a good thing and it is sound fiscal policy to have the users of roads pay for them via gasoline taxes, road tolls, and other fees that reflect an individual’s usage of roads and bridges.  When general revenues are used to pay for roads and bridges people who don’t necessarily use them wind-up paying for a portion of highways and subsidize the usage of roads of those who travel them a lot.  When you subsidize something you can bet you are going to get more of it than you would have gotten without the subsidy and in this case that means more travel on roads which, of course, means there will be more need for roads and spending on roads and that means more subsidy and that approach is surely a road to perdition.

It was nice to see New Hampshire rank high in a recent report (issue brief) by the Tax Foundation on the percentage of  highway spending that is funded by user fees like gasoline taxes, tolls and other fees.  Unfortunately, in making good points about user fees, the Foundation draws the wrong conclusion about the data it uses to make them.  That happens a lot when you use bivariate analysis to draw conclusions in a multivariate world.  Instead, using multivariate (regression) analysis on the data, it becomes clear that it is less the use of good principles of fiscal policy that results in states paying for a higher percentage of the costs of highways with user fees, than it is a function of the volume of federal government grants they receive.  So a cursory look at the Tax Foundation’s report can give NH a sense of superiority in fiscal policy over many states (while I generally think that is true about NH it is not so much in this case),  and especially over Vermont because that state funds just under 20% of its highway spending with user fees compared to NH’s 42%.  The real reason those percentages are what they are is that Vermont receives about 64% more federal highway funds per capita than does NH ($220 to $134 in 2010). The chart below shows the simple relationship between the percentage of highway spending in a state that is funded by gas taxes and user fees and the amount of federal highway funding per capita in each state.

User fees and Fed funds

States like NH that fund a higher percentage of highway expenditures with user fees do generally receives lower amounts of highway funds from the feds (the data point slope downward to the right).  There are even more intervening variables, like the amount of federal highways (by mile) and as a percentage of all highways that are in a state but still, by far, the amount of federal highway funding per capita is the best predictor of the volume of highway spending per capita in each state. The amount of motor vehicle-related user fees per capita were a distant second but still significantly related to highway spending.

Fed Highway per capita

Almost everyone agrees that NH’s (and every other state’s) roads and bridges are in need but I don’t think the debate is ever going to be about the wisdom of user fees versus general revenues in paying for highway infrastructure.  It is too bad because if it were we just might reduce the need for more spending in the future.

E-Commerce’s Small % of Sales Has Big Implications

March 21, 2013

Total retail sales increased modestly last Christmas season (4.0% higher in QIV than in QIV  2011) while e-commerce (Internet) retail sales  increased 15.6% during the same time period.   E-commerce sales are still a relatively small percentage of total retail sales but some of that is a function of the percentage of consumer goods that will never be sold over the Internet (don’t look for free shipping and returns on gasoline or boneless chicken soon).  E-commerce now accounts for about 5.4% of retail sales, a new record.

e commerce sales

E-commerce sales are an interesting issue for a lot of reasons. It portends heavyweight policy battles over the taxation of e-commerce and brick and mortar sales as well as policy debates over taxing the source or destination of sales.  It also has longer-term implications for the demand for commercial real-estate, the usage, mix and look of downtowns, malls, and probably the nature of a good percentage of our socialization and interactions, but that won’t be apparent for some time.   For someone who doesn’t like to shop (and even for those who do), e-commerce essentially reduces the cost (time and travel etc.) of shopping and comparison shopping to near zero, so it has the potential to increase the time available for other activities.   That could be a good thing, but if it reduces the time we spend walking through our downtown or otherwise interacting with our communities so that we can get to know a thousand more people infinitely less well on-line, I ‘m not sure it makes that much of a contribution.   To the upside, e-commerce has given a lot of us yet another  reason not to try-on the clothes or shoes we buy.

The data in the chart above shows that while e-commerce sales dipped during the recession, they continued to increase their percentage of total retail sales.  That means they dipped less than overall retail sales.  There are tremendous long-term implications for the growth in e-commerce and that  prompts more than a few questions in my mind:

  • Are consumers especially motivated to comparison and price shop on-line during recessions or in weaker economic times?  Does a weaker economy convert more sales to e-commerce?  I look at state level data and use quarterly industry earnings data to estimate state-level retail sales in some states and noted that NH’s retail sales fell less than neighboring states during the recession.  A result I attribute, in part, to the 5% or greater savings due to NH’s lack of a retail sales tax, that consumers may be even more motivated to realize during a recession.
  • Can the most attractive elements of e-commerce be combined with brick and mortar retailing to “double the pleasure”.  Which retailer or type is most likely to find the formula?
  • How much different are the demographics of on-line buyers than are those of traditional retailers?  I assume for the most part e-commerce buyers have somewhat higher incomes and are likely to be younger.  If income were the primary difference I would expect that e-commerce sales would probably decline less than total retail sales.  If age is a significant contributor, how much will demographic trends matter?  Its been a while since I’ve been in a mall, have  teenagers forsaken them for on-line social gatherings?
  • How are sales trends affected by differences in the percentage mix  of products sold on-line and at bricks and mortar stores. As an example, furniture stores and home furnishings sales were pummeled during housing market drop and recession and I have to think those items are less representative of e-commerce sales.  Will shopping downtown now mean going to an internet cafe?
  • Is there an e-commerce substitute for “recreational shoppers”?

These are just a few of the questions I will never have time to investigate.  Recent trends are  probably a combination of these factors and more and  no doubt someone who looks and writes about  these trends more thoroughly has answers where I have only questions.  The comment lines are now open.

Between a (Black) Rock and a Hard Place

March 19, 2013

If I am the state’s largest electric utility I have to be hoping that the limited natural gas pipeline infrastructure that supplies the New England market never gets expanded, that shale gas production has even more environmental impacts than it appears to now, or preferably both.  I’ve written probably too many times about the electric power industry (as well as the commercial and industrial sectors) switching to natural gas (primarily at the expense of coal but also oil) because of its lower carbon intensity and significant decline in price over the past decade.  Increased demand for natural gas along with New England’s limited pipeline infrastructure have caused natural gas prices to rise in New England more than in most other parts of the country but I don’t think that is reason to “jump ship” from natural gas.   Natural gas production is increasing and it will likely be sometime early in the next decade before the increase in demand for natural gas in this country outstrips growth in supply (even though it feels like it in New England because of our pipeline limits).  Coal is cheaper and becoming cheaper still for good reason, the demand for coal as a fuel for electricity production is declining rapidly and despite being a lower cost fuel, that doesn’t mean facilities that burn coal can sell electricity more cheaply than can producers using more expensive fuel.

I  briefly noted how electric power gets sold into regional markets in an early post.  The Cliff Notes version of that is this: The suppliers of electricity (generating companies) in a region offer to supply electricity to the market at a given price and the offers are accepted beginning with the lowest cost providers first, until enough energy is supplied to meet expected demand in the region.  The price of electricity offered by the last electricity generator needed to meet the regional demand determines the market price paid by companies that supply the electricity to businesses and consumers.

So here is the rock (black) – our state’s largest utility has a large generating facility that burns cheap coal but because it costs a lot to burn coal in a way that doesn’t make NH look like Beijing on a bad day, the price of that electricity is high relative to other electricity producers in the region who are also offering their electricity in the regional market (primarily natural gas  generators).  The electricity generated by the coal burning facility has increasingly not been sold into the regional market.  As the graph below shows, the longer-term trend indicates that the percentage of New England’s electricity that is generated by Merrimack Station has been cut by more than half.  It is a 12 month moving average to smooth the results and prevent readers from getting nauseous from bouncing lines, but the trend is clear and troubling if you are a generator with a coal-burning facility.

Merrimack Station

The “hard place” is the growing loss of its residential customer base as retail competition finally takes hold.  A lot was made of the financial difficulties of one competitive supplier to NH’s residential market and the resulting return of its customers to the default service provider, but anyone who thinks that is going to stop the train from leaving the station is going to find themselves looking for another way to get to their destination.

When your generating business is weakening and your retail business is declining, all that is really left for growth is your transmission business.

A Hot Topic for a Cold Day

March 18, 2013

Climate change skeptics have to appreciate that there is no better time to talk about the topic and about global warming than during a period of below average temperatures.  I don’t expect anyone to believe anything I say unless I can empirically demonstrate my point so I appreciate those who bring solid empirical evidence to a debate while leaving ideology and polemics out.

In the competition for our time and attention the issue of climate change competes with a lot issues that seem to more directly and immediately impact us.  At least that was the case for me until I heard a presentation on the impacts of climate change on the Piscataqua River Basin/Great Bay region of NH and Maine.  As a guest of a local Rotary Club I heard a presentation by Prof. Cameron Wake of the Institute for Earth, Oceans, and Space at the University of NH.   You can get a copy of the report here.   It is one thing to generically consider an issue like climate change, it is another to consider it in the context of evidence of how it directly impacts those things and those people whom you care deeply about.  I love the Piscataqua and Great Bay and Little Bay region.  I walk with my best friend almost daily there – I took these pictures yesterday.

IMG_20130317_100056IMG_20130317_093300

So when I hear solid empirical evidence of threats to it I listen.  It makes me wish I listened sooner and it also makes me wish similar reports could be written for every region where someone cares about the natural amenities around them that will be affected by climate change.   I regularly work for companies that burn fossil fuels to produce electricity and none of them have been robber-barons unconcerned about the potential impact of carbon on climate change.  They too all have places like the Piscataqua River Basin that they love.

Durham temp proj

I hate anecdotal evidence but it is hard for me not to consider the reduction in cold temperatures and snow during winter months (despite tomorrow’s and this winter’s events) from when I was a youth growing-up along the Canadian border (and successfully defending it against the insufferably polite hordes of the great white north).  The number of extreme rain events and the three or four 100  year floods (just in the past 15 years)  since I arrived in NH (the 1980’s)was not, for me at least,  definitive evidence of climate change until I saw the data in the larger research context presented by the Piscataqua River Basin report. The more dramatic impacts of climate change won’t occur until after I am gone but the forecasts of the change in my region contained in the report and presentation by Professor Wake make clear to me the importance of action now.  If you get a chance, look at the report or better yet, invite Prof. Wake to make a presentation.  The data and information is great but his ability to present it is even better.

extreme precip forecast

Where The U.S. Leads the World (Almost)

March 13, 2013

According to a report by KPMG, the U.S. has the second highest corporate income tax among all nations.   I don’t know what the workforce is like in Vanuatu and I am not certain how I would feel about worshiping at a shrine that is the remnants of a wrecked WWII B17 bomber, but if those aren’t concerns to you they have a 0.0% corporate tax rate.  So also do Bahrain, Georgia, Saba, as well as some well known industrial powerhouses such as the Bahamas, Bermuda, and the Cayman Islands.

That we (the U.S.) have almost the highest statutory corporate tax rate in the world is the focus of a lot of debate in Washington, but what is probably more relevant is the dramatic differences in the effective tax rates of different industries in the U.S..  Aswath Damodaran, Professor of Finance at the Stern School of Business at New York University, calculated the average tax rate of various business sectors using public financial statements.  The chart below illustrates the disparity between the average tax rates  paid by different sectors of the U.S. economy and includes only the highest and lowest twenty industries.  My purpose isn’t to single-out any industry or group of industries so the chart isn’t a commentary on the merits of any particular industry, I’ll let readers make their own assessments about the implications of varying rates on different industries.    The chart shows the average rate based on the public filings of over 6,000 publicly traded companies and includes only the rates  for profitable companies.    Effective marginal rates would be better to show but public data does not allow for that estimation.

Tax rates by industry

Unfortunately, it does not seem that the high level of concern about the world  ranking of  the U.S. corporate tax rate is matched by a concern about the large differences in effective rates by industry.  A lot of people are all for reducing the statutory corporate rate in the U.S., they just aren’t so keen on reducing or eliminating  the $100 billion + in preferences and breaks that could pay for it without adding to the nation’s deficit.

Small Business is Not Booming

March 12, 2013

The National Federation of Independent Businesses just released its monthly report on the condition of  small businesses nationally.  The report is based on a national survey and state-level results are not available.  However you feel about NFIB or their advocacy positions their monthly report is a valuable source of  information about the issues and factors affecting small businesses.

Robust economic growth does not occur unless small businesses are confident, healthy, and hiring.  That seems especially true in NH and is one reason NH’s job growth has been slower than the national average.  I especially pay attention to the headline portion of the NFIB’s monthly survey,  it’s “Small Business Optimism Index”,  because it seems to be a pretty good indicator of near-term job growth in the U.S. and NH.  The simple correlation between the NFIB Small Business Optimism Index (lagged 3 months because it takes some time for optimism/confidence to affect hiring plans) and U.S. Job Growth  is about .68, while the correlation between the NFIB Index and NH employment growth is about .74.   Thus the relationship is slightly stronger between the Index and job growth in NH than it is for the U.S. as a whole.  The NFIB Index inched-up in February, but overall it remains relatively low, suggesting that small businesses aren’t yet ready to provide the boost to hiring that typically occurs in a strong recovery from recession.

NFIB Index and Job Growth


A more troubling indicator of the health of small businesses (and thus hiring plans) comes from the Experian/Moody’s Analytics Small Business Credit Index.  This quarterly assessment of the financial health of small businesses suggests the balance sheets of small businesses (in the aggregate) deteriorated in the fourth quarter of 2012.   According to the quarterly report:

“Delinquent balances rose, pushing the share of delinquent dollars higher to 9.7 percent from the prior quarter’s 9.4 percent. A slowdown in personal income growth led to sluggish retail sales, hurting small-business revenues. Though small firms have worked to trim their labor costs in recent months, sales have fallen more quickly, forcing many small companies to borrow funds to cover their payroll expenses…..The next six to nine months likely will be lean ones for small businesses as rising taxes strain household budgets  and nervous firms of all sizes postpone hiring, thereby stunting the jobs recovery. Consumer sentiment is likely to remain subdued, and spending will be underwhelming, which will keep pressure on small-business balance sheets.”

Experian Moodys  Credit Conditions


Even A Broken Clock is Accurate Twice a Day

March 8, 2013

I am frequently in error but rarely in doubt, so when I am right I have to make sure someone notices.  Good news was reported today  on job growth nationally, as an estimated 236,000 jobs were added across the country in February.   I hate to sound jaded but in each of the prior two years job growth looked to be accelerating early in the year only to experience a significant mid-year  slump.  For now, however,  it is a positive sign.  I have been especially and uncharacteristically gloomy in my characterization of NH’s economy but there was some little reported good news on that front released last week.  The annual benchmark employment revisions showed that NH has 9,600 more jobs than originally estimated.  I won’t get into why the revisions are necessary and can result in some significant changes in the numbers  but in my very first post in this blog back in October I highlighted the disconnect between the volume of  help-wanted advertising in NH and estimates of job growth in the state.

“In the first ever Trend Lines blog post I begin by asking a basic question:  Could the most recent job growth picture in NH be distorted by numbers that will later be revised?”

I also suggested that growth trends in reported wages and salaries  in the state were also inconsistent with estimated job growth trends. In that post and in subsequent  posts (here and here) and others as well, I talked about a potential “skills gap” as a contributor to the disconnect between help-wanted ads and NH’s reported job growth.  I think a “skills gap” is a contributing factor  but as I argued in my first and subsequent  posts –  my money is on job growth being revised upward.  It is nice to be right but it really doesn’t change the overall theme of NH’s economy- that it continues to under perform relative to states it typically outperforms.  That was also predictable:

“…that the jobs data is wrong and will be revised upward early next year, is real,  but that doesn’t mean the revisions will show NH is again outperforming its neighbors or the nation.  It just means we will look less bad over the past year or so than we do right now.”

Five months later I think that still  sums-up my feelings about the revisions, its good to know we have more jobs but we are still in a growth mode that is too slow.  With the revised job numbers for NH the relationship between help-wanted advertising and reported job growth looks more appropriate.

NH Revised Emp

The revised job numbers also are more consistent with PolEcon’s NH Leading Index which had been signalling stronger employment growth in NH than was first reported.  The revised job numbers are more consistent with the signals provided by the Leading Index.   That may not mean much to anyone but to me it means I won’t have to spend a lot of time re-calibrating the Index and that means a more enjoyable weekend.  Enjoy yours.

Leading index and revised emp

Betting on Gambling Assumptions

March 5, 2013

The gambling debate in NH is as hot as it has ever been as the NH Senate just passed a casino gambling bill.  Since I have no dog in the fight (or more appropriate to the debate – no pony in the race) I’ll use this blog to add my $.02.   I think the issue will be decided largely on the basis of something other than the impact casino gambling would  have on state revenues, but to the extent that fiscal impacts are a part of  policymaker’s decision process I’d like to see them have access to the best information and tools with which to make their decision.   Public policy analysis is not physics, there aren’t formulas with constants that govern  behaviors today the same way they did one million years ago.   Policy research is mostly social science that relies on a combination of disciplines like economics, sociology, and demography, and others.  The goal of policy analysis isn’t to prove anything or have something published in an academic journal (a fact usually lost on academics)  it is to improve the information in the debate and to marginally improve the decision-making process.  Policy research is best when it not only provides information, but also when it increases policy maker’s understanding of the issue and how even small changes in policy proposals might affect the ultimate impact of a proposal.   A lot of lobbyists want to provide the one “answer” to what will be the impact of this or that proposal or what will be its fiscal costs or benefits.  A lot of lawmakers want a single “point estimate” of impacts as well, when in fact there is always a range of likely impacts (some more likely than others) and usually they depend on a set of assumptions.   I’ve done a lot of policy research and I never assume anyone will agree with any of the assumptions I include in my policy models so I always design them for policy makers to insert their own assumptions in order to calculate the impacts of policy proposals.  That both increases the confidence policy makers have in their decision-making by helping them understand the sensitivities of estimates to different assumptions and the key determinants or levers that produce different impacts, and it reduces concerns that my analyses are using unrealistic assumption or “cooking” the numbers.  But what it really does is provide a ‘tool” for policy makers to use rather than giving them my “answer” to any policy question.  I usually do have my preferred answer but it doesn’t do any good unless lawmakers can see that it isn’t just “my preferred answer” bu the result of some pretty sound empirical analysis, even when it can be interpreted differently.  Invariably I offer to make my models available to policy makers but to date at least, only a few have every taken my up on it.

With that long preface I’d like to suggest that all sides of the gambling debate make their models and assumptions available and allow policy makers to get a better understanding of the sensitivities of their estimates to different assumptions.  My friend Dennis Delay at the NH Center for Public Policy Studies  is about the best there is at shooting straight and trying to develop the best estimates possible but while he does the analysis I don’t think he does all of the report writing so I would like to see more attention in their analysis of gambling to demonstrating likely impacts under a range of assumptions because it seems that not everyone agrees with theirs.  I haven’t seen any detailed analyses by gambling proponents and think they need to provide their assumptions and models for estimating revenues and impacts as well if they want lawmakers to adopt their proposals (they may have done this I just haven’t seen any analysis).

To demonstrate how important assumptions are in estimating revenues I developed a small model of gambling revenue in NH (not including any social costs).  The model results presented below assume one casino in Southern NH with 5,000 slot machines (or video lottery terminals) but any number of slots can be entered as a variable.  The base for state revenues (on which a state tax would be applied) is estimated using  per slot machine revenue data from Connecticut Casinos for the most recent year (2012).  This seems like the most similar market but again, a different per slot figure can be entered into the model to yield different results.  In addition, different tax rates and different impacts from Massachusetts casinos can be entered into the model.  I’m not trying to estimate revenues here but I am trying to highlight just how important model assumptions can be in determining fiscal impacts and until all sides show how their estimates are affected by their assumptions I think it is hard for lawmakers to make reasoned decisions based on fiscal impacts.  As the chart below shows, estimated state revenues vary greatly when even a few assumptions change.  The “Y” or left, vertical  axis shows estimated state revenues, and the “X”  or bottom, horizontal axis shows increasing tax rates from left to right.  Each colored line on the graph shows estimated state revenue at each tax rate and each  colored line represents a different assumption about the impact on revenues depending on how much casinos in Massachusetts affect casino revenues in NH.

Sensitivity of Revenue Estimates

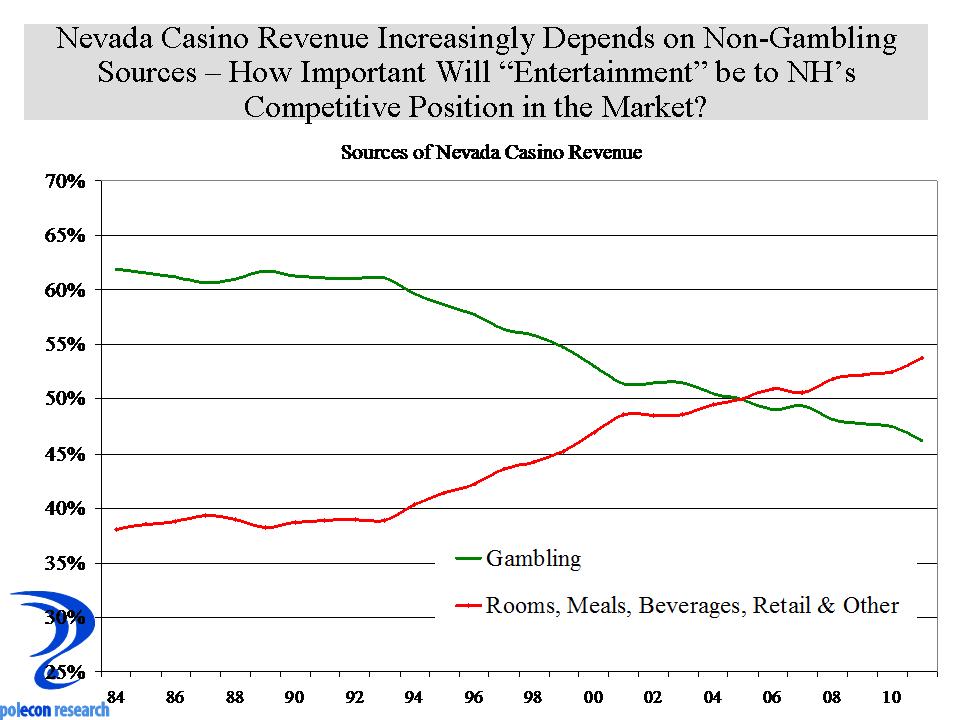
Finally, I would like someone to articulate and provide some data on how  casinos in NH would perform in a competitive market depending on the type of experience they provide.  That seems to me to be a question best answered by the industry.  I think it is important in understanding the impacts of an increasingly competitive gambling market and the data I have looked at suggest that, at least in Nevada (see below), casinos have derived an increasing share of their revenues from rooms, meals, beverages, retail and shows.  Entertainment seems to play a larger role in the business models of casinos in that state and I wonder if that will be true in NH or in Massachusetts and what are the implications if it isn’t in either, both, or if it is in just one state.

Sources of Casino Revenue


%d bloggers like this: