Posted tagged ‘NH’
December 5, 2012
A lot of analysts, me included, have been looking for reasons why employment growth has been slower much of this recovery. That prompts questions about whether the slow recovery from recession is the result of cyclical factors (related to swings in the business cycle) or structural factors that fundamentally and longer-term alter the ability of NH and the nation to create jobs. While some wait for cyclical factors to improve job growth, in NH there is a lot of talk about demographics, migration, and too often (by me at least) the skills gap or mismatch between job openings and the skills of job seekers. Much of the demographic story, especially concerns about NH’s ability to attract people from other states, is relevant – except perhaps for the overblown concerns about NH’s “aging” (more about that in future posts). I believe demographics and things like the skills gap play an important role in the slow recovery and more general downward trend in job growth, both before and following the recession. But today, I offer another, simpler thesis, but one that may be no less troubling. If you look at job growth trends in NH by industry, you see that since the recession, employment weakness has really been most concentrated in three sectors of the economy; construction, government, and financial services. The chart below shows job growth trends over the past several years for total non-agricultural employment in NH, as well as total employment minus construction, government, and financial services. Absent the three hardest hit sectors of the economy, job growth following the recession (until recently that is) didn’t look that much different than the recovery from the briefer, milder recession of the early part of the last decade.

I know construction, government, and financial services are important but they still represent just over 20 percent of employment in the state, so the weakness in employment isn’t as broad-based as pessimists (including me at times) suggest. But what is more troubling is that the weakness in these sectors are more structural than cyclical and thus we may be waiting for a rebound that may never occur. I don’t think that is true for construction, where at least some rebound will occur as the housing market improves, as business investment strengthens, and whenever the fiscal health of governments improve enough for infrastructure spending to pick up. But weakness in government and financial services employment is likely more structural. New financial services regulations are likely to be an impediment to job growth in that industry for some time and there is no end in site for the budgetary impediments that will likely continue to weigh on job growth in the government sector. I, and others, will continue to look at the implications of such things as demographics and skills gaps on recent and prospective job growth, but we can’t fail to recognize that sometimes answers are less complex than the questions.
Categories: employment, job growth, NH Economy
Tags: construction, economic recovery, Financial services, government, job growth, NH, recession
Comments: Be the first to comment
December 4, 2012
(Update: An astute reader has suggested that if gambling is more likely then, in fact, the “odds have gone down” – I’ve added a question mark to the title to reflect my uncertainty.)
With a newly elected governor open to this possibility of introducing casino gambling in NH and a state senate that has been similarly inclined in recent years, by all accounts casino gambling will be a hot topic in the legislature this year. Because this blog attempts to address timely issues, this is the first of what will be a number of posts that take an empirical (as opposed to moral or ideological) look at the fiscal and economic impacts of casino gambling in NH. First, a disclosure: I am not now nor have I ever been involved in debates regarding expanded gambling in New Hampshire or anywhere, either professionally or personally. I only point this out because so much of the debate is framed by advocates or opponents, the information from each is often discounted by some percentage because of their advocacy. There may be other reasons to discount the information I offer here but my position as an advocate or opponent ought not be one. Most of what I will be posting here are aspects of casino gambling that interest me, and thus may not be the most important or most relevant from a public policy perspective. If there are issues you think I ought to examine, feel free to let me know.

Looking at the basics, casino gambling provides substantial revenues to the three states I examined for this post. The chart above shows the state government revenues provided by casino gambling revenues of CT, NJ, and Nevada. For Nevada, the revenues do not include casino gambling related revenues such as taxes on rooms or meals and for each state the figures do not include any licensing revenues. Revenues in Connecticut are the “cleanest” to interpret, they represent the state’s 25% share of the “win” from slot machines at both Foxwoods and Mohegan Sun. I don’t know (yet) the revenue formula for Nevada or New Jersey but I do know that slots are important regardless. In Nevada, slot machines represent about 65% of casino revenue (61% at publicly traded – larger- casinos). A key question from the chart is whether the decline in state revenues is cyclical, or structural. Cyclical involves changes resulting from economic conditions, while structural involves issues such as competition (the increase in gambling locations) and perhaps the 800 pound gorilla, internet gambling. Either way, the decline in gambling revenue has been especially dramatic in New Jersey, which likely reflects a combination of increased competition (especially from new Pennsylvania casinos) as well as economic conditions. It will be interesting to see how CT and NJ fare with the impending opening of casinos in Massachusetts.
Casino gambling revenues come from the discretionary spending of consumers. Discretionary income suffered significantly during the recent recession. In NH, the revenue source probably most dependent on discretionary spending is the state’s meals and rooms tax. A significant percentage of the meals and rooms tax is related to entertainment and recreation spending, similar to casino gambling (although the meals and rooms tax is also a function of business conditions and expenditures). A quick comparison of gambling and meals and rooms tax revenues shows that the meals and rooms tax (adjusted for rate changes) declined during the recession but has been a more stable source of revenue for NH than has casino gambling revenues has been for other states. Another interesting fact is that revenue from NH’s meals and rooms tax was about $237 million in FY 2012, while casino gambling revenues in NJ were about $238 million.
Categories: casinos, Gambling
Tags: casinos, ct, gambling, NH, state revenues
Comments: 2 Comments
December 3, 2012
Online help-wanted ads in New Hampshire declined again in November according to the Conference-Board, although the number of ads remains substantially higher than it was in November of 2011. All occupational categories saw a decline in help-wanted ads with the exception of construction, production and transportation workers. This is consistent with anecdotal and some empirical evidence about the demand for production workers impacting employment growth as discussed in a November 21 post. For the second month in a row the largest percentage decline in ads was in professional, technical, and scientific occupations, although this broad occupational grouping still has the largest year-over-year increase in help-wanted ads in New Hampshire between November of 2011 and November of 2012.

The chart shows recent trends in help-wanted advertising in New Hampshire, along with the ratio of unemployed workers in New Hampshire to the number of help-wanted ads, the “supply-demand ratio” for labor in the state. After falling to about 1.4 unemployed persons for every help-wanted ad in the state, the ratio has been slowly rising and now stands at about 1.7 unemployed for every help-wanted ad. Of course this ratio says nothing about the match between the occupations of job seekers and the occupations advertised in the help-wanted ads, but regular readers know it won’t likely be long before I offer another “skills gap” post that discusses that issue.
Categories: Help Wanted, Labor, Unemployment
Tags: help-wanted, labor demand, labor supply, NH, unemployment
Comments: Be the first to comment
November 29, 2012
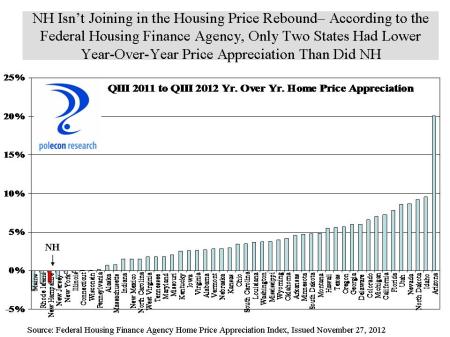
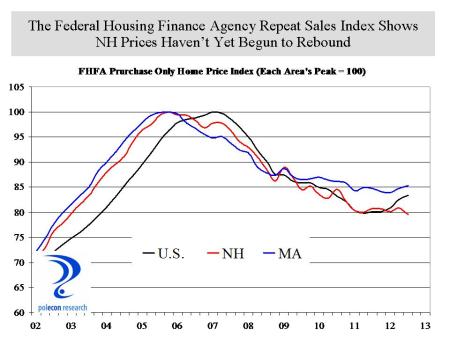
The Federal Housing Finance Agency released its latest home price appreciation index on Tuesday and while the data support the belief that housing is bouncing back across the country, and is now becoming a positive influence on economic activity rather than a drag, the news is not good for New Hampshire. The FHFA’ s repeat sales home price index shows that NH is one of only a few states that had price depreciation between the third quarter of 2011 and the third quarter of 2012 and only two states (Maine and Rhodes Island) had lower appreciation rates than did New Hampshire.
Repeat sales indices are the only accurate way to measure changes in home prices. Simply examining median sales prices doesn’t account for the fact that the characteristics of the houses sold may be different (location, size, type, etc.) unless the repeat sales method is used. I am by nature an optimist. I am rooting for the housing market because its rebound is important for the prospects of the NH economy and its not so bad for my balance sheet either. I am also not looking for yet another reason for realtors to take exception to some of my analyses. I am, however, a believer in the wisdom of markets (most of the time) but a lot of what happens in markets is driven by pure stupidity – or, rather, inattention, misinformation about fundamentals, and an exaggerated focus on currently circulating stories (the housing market is back, Mitt Romney has got the momentum in the swing states). At least one of those stories is true , the housing market is coming back as a whole in the nation, just not everywhere.
As I have noted in prior posts, no amount of exhortation and cheer leading about housing can overcome the fact that values are determined by fundamental underlying demand for housing which includes population and job growth, the formation of new households, and the need to replace older housing units. Both NH’s job and population growth have been weak relative to a majority of states over the past couple of years. Regressing job and population growth over the past year in each state on the FHFA’s home price index-based change in home prices in each state shows a highly significant relationship (R=.603) accounting for about 40 percent of the variation in home price appreciation across states. There are variations in markets within each state, and this analysis is an oversimplification, but nevertheless it is important to remember that home price appreciation cannot, for long at least, outpace the fundamental determinants of the demand for housing – job, population and household formation growth, and the need to replace obsolete structures.
Categories: House Prices, Housing, Real Estate
Tags: appreciation, home prices, home sales, Housing, job growth, NH, population growth
Comments: 2 Comments
November 28, 2012
Small businesses fared the worst during the recent recession and hiring by small businesses has been slower to recover after this recession than it was following past recessions. Robust economic growth does not occur unless small businesses are confident, healthy, and hiring. With a fragile national recovery from recession that has not quickly helped to repair the balance sheets of most small businesses, and with a number of important public policies (regulatory, tax, health care etc.) still uncertain, it is not surprising that small businesses have been less than sanguine about the prospects for the economy and reluctant to hire. That may be changing, however, as the NFIB’s national index of small business optimism has begun to increase. The NFIB index is a pretty good predictor of the direction of job growth in NH and its latest up-tick is consistent with last month’s increase in payroll employment in New Hampshire.

Categories: job growth, NH Economy, Small Business
Tags: employment growth, NFIB, NH, optimism, Small businesses
Comments: Be the first to comment
November 26, 2012
I started this analysis wondering if the percentage of jobs in professional, technical, and scientific industries in NH that are held by females is greater among younger workers in the industry than older workers. I became sidetracked by the unexpected finding that the percentage of workers in those industries is about evenly divided between men and women (and as a spoiler the percentage that is female is larger at younger age groups – consistent with my “‘feminization of the NH workforce” theme from an earlier post). One caveat before proclaiming gender equity in professional and scientific fields, the data do not account for the specific occupations in the industries. That is, it is possible that the conventional wisdom that women are less employed in those industries is not supported, but the fact may remain that the more professional, scientific, and technical occupations in those industries (as opposed to the management, support and other occupations) may still be dominated by males. Unfortunately there is data from different datasets that supports this thesis, although it does appear to be changing.
The chart below shows that women comprise about half of the employment in the broad industry grouping of professional, scientific, and technical industries.

The real kicker in the data is that it shows that reductions in employment in those industries came largely at the expense of female workers. Again, this may just be a function of the reductions in those industries occurring in specific occupations more likely to be populated by females, a viable interpretation. It may also be related to an increase in female employment among younger and newer workers in the industry who’s employment may be most vulnerable in a recession. Nevertheless, such a high percentage of decline in those industries coming at the expense of female workers is well beyond what would be expected based on probability and chance alone.
Categories: Gender, Unemployment
Tags: female, job growth, NH, professional, recession, scientific, technical, unemployment, workforce
Comments: 1 Comment
November 21, 2012
A quick review: The “skills gap” explanation for slower employment growth this recovery posits that there are large numbers of jobs waiting to be filled but hiring is sub-par after the recession because of a lack of qualified candidates to fill those positions. Twice I have presented some evidence on the issue, here and here. Most of the concern and evidence about the existence of a skills gap addresses very high-skill technical, scientific, computer, and engineering occupations because our nation, and by extension our state, seem to perpetually be unable to produce enough individuals in those fields to satisfy industry demand. As a result we “import” a lot of that talent from foreign countries (more about this – I promise – in a future post). There is some evidence of this in NH. As the chart below shows, professional, scientific, and technology occupations are the largest, broad category of help wanted ads in the state. But they have also evidenced the smallest increase (a decrease actually) since the recession. There is still a significant demand but it may be that an inability to find qualified applicants has companies in need of those occupations from considering more hiring in the Granite State. A quick review of data for Massachusetts shows that demand for professional, scientific and technical occupations has increased during the same time period.

But more direct evidence of a skills gap comes from the demand for construction and production workers. I am especially interested in the potential skills gap for production workers. The chart above shows that demand for construction, production, and transportation workers has increased significantly since the recession. Although still a much smaller category of help-wanted ads than professional and technical jobs, the increased demand is consistent with anecdotal evidence I heard this week at a roundtable discussion of the Seacoast economy. At that discussion, representatives from industry, higher education, and economic development organizations cited specific examples of companies frustrated at their ability to hire skilled production workers. Some are forming partnerships with NH’s community college system to increase the supply of needed occupations. Those initiatives show promise and I hope the state’s four-year colleges and universities develop more partnerships to address the skills gap in professional, scientific and technical occupations as well because, increasingly, job growth in NH appears to depend on it.
Categories: Help Wanted, job growth, NH Economy, Skills Gap
Tags: help-wanted, job growth, NH, occupation, occupational demand, Skills gap
Comments: 1 Comment
November 20, 2012
The U.S. Bureau of Labor Statistics released its monthly report on state and local employment today and the good news is that, preliminarily, New Hampshire added 1,000 jobs in October. The bad news is that this is just 1,200 more jobs than the state had one year earlier in October of 2011. For optimists, the most recent trend is likely to be the most important and the monthly report is consistent with the rise in PolEcon’s NH Leading Index.

Nevertheless, the longer-term job growth trend in NH has been weak. Looking at growth in just private sector employment, the situation is no better for NH. As I have noted here, I believe job growth in NH is being underestimated but even if that is true, it is hard to see how the recent past will be revised enough to make NH’s job growth picture look comparable to that of our neighbor to the south or the U.S. as a whole.

Categories: job growth, NH Economy, U,S, Economy
Tags: employment, employment growth, job growth, jobs, NH
Comments: 2 Comments
November 19, 2012
The rise in natural gas production in the U.S., along with the volume of proved reserves available in the future because of new technologies, could fundamentally change the energy landscape in the U.S. in a way that the significant and beneficial rise in U.S. oil production can not. Both trends are good news for the country and further efforts toward U.S. energy independence, but the lower prices and increased stability in supply of natural gas also have the potential to alter the energy fuel mix in this country. The use of natural gas has yet to make significant inroads in the transportation sector but it is hard to imagine how a fuel supply that (unlike gasoline) is, or could be, available directly at a majority of U.S. households at reasonable prices, will not eventually fuel a much higher percentage of vehicles in this country. In the electric power industry, the transition to natural gas is already occurring, in part because of the lower and more stable price environment for natural gas, but also because of the environmental advantages of natural gas.

The chart above shows that the price of natural gas used by the electric power industry for generation has fallen by almost 60 percent since 2005. Although that trend will not continue, production and proved reserves in the U.S. have created a much more predictable and stable price environment for natural gas as evidenced by forecasts by the U.S. Energy Information Agency and by commodity futures markets. The electric power industry is already changing to reflect the new realities of natural gas markets. As the chart below shows, in just the past decade electricity generated using natural gas has gone from 15 percent of the electricity generated by coal fired power plants to 31 percent.

That trend is continuing. Just one company (First Energy), recently announced the closing of six coal fired power plants in Ohio, Michigan, Pennsylvania, and Maryland, noting that the costs of environmental compliance upgrades made the plants not economically viable to continue to operate.
Categories: Electricity Generation, Energy, Natural Gas, Uncategorized
Tags: coal, electric power, electricity generation, Energy, Natural Gas, NH
Comments: 1 Comment
November 16, 2012
The rate of home ownership increased significantly in the U.S. and in New Hampshire from the middle of the 1990’s until the housing market crash in the late 2000s. The increased availability of financing (sometimes exotic) played a significant role, as it did in the ultimate unwinding of the housing boom (nearly taking the nation’s financial system down along the way). Home ownership rates are returning to levels closer to historical standards in the U.S., but not before a lot of household wealth in the form of homeowners equity was lost. That has had a large impact on our recovery from recession. One rule of thumb is that for every one dollar of household net worth lost, consumption expenditures by households will decline by 3-5 cents (the so called “wealth-effect”. Using the lower figure (3 cents), implies that across the country, consumer expenditures were about $180 billion lower between 2007 and 2011 as a result of the housing market crash, than they would have otherwise have been.

In NH, home ownership rates are higher than for the U.S. and they have yet to significantly move back toward their historical levels in the state. They may never, but I have to think that until they do, putting a true value on houses in the state is going to be difficult. In the meantime, home price depreciation has had the same negative effect on household net worth in the Granite State and thus a substantial negative impact on consumer expenditures via the “wealth-effect”.

Categories: Homeownership, Household Finances, Housing, Real Estate
Tags: financial crisis, homeownership, homeownership rates, housing market, housing market bust, NH
Comments: Be the first to comment


