Posted tagged ‘home prices’

How Much of Housing’s Recovery Depends on Interest Rates?

October 11, 2013

Low interest rates did much to float the housing bubble of the 2000s, but like all bubbles the higher pressure inside the bubble eventually caused it to burst as it rose higher and encountered the  thinner atmosphere at high elevations.  Recently, even lower interest rates (lower than those that helped create the bubble) have significantly helped the housing recovery .Median price and Mortgage Rates

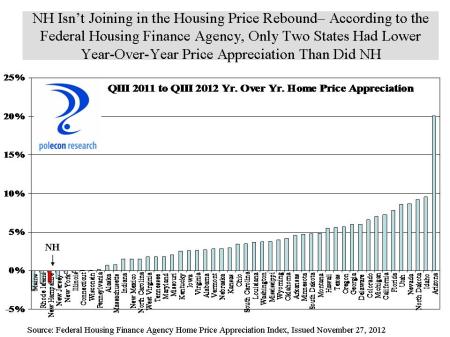
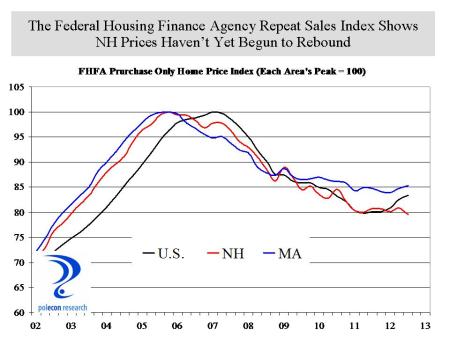
I haven’t written about the housing market lately because you can only jump off the “booming housing market” bandwagon so many times before people start wishing it causes you a fatal injury.   I won’t jump off the housing recovery bandwagon this post so much as I will move to the back of the wagon.  There is a nice modest recovery occurring in New Hampshire’s housing market.  It is not the boom that some national headlines indicate,  or even as strong as some data on median sales prices in New Hampshire would suggest, but the market is recovering.  CoreLogic’s home price indices show New Hampshire prices appreciated at about 5% over the past year.  Not bad but still 30 states had greater home price appreciation.  Home prices in the Granite state remain almost 17% below their peak levels and in only 12 states to prices remain  further below their peak levels.

Population growth (largely through in-migration) appears to be resuming again in New Hampshire and as household formations and job growth accelerate the market should improve at a faster rate.  Housing affordability is as high as it has been in decades.  The chart below shows a housing affordability index, or how  the monthly income of a NH household at the median income in the state relates to the monthly principal and interest costs of buying a home at the median price in the state.  When the index is above one, the index shows that the “typical” household with income at the state median, has more than enough income to cover monthly principal and interest costs (it says nothing about whether they have enough to make a 10 or 20% down payment to make the purchase or the ability to qualify for a mortgage).  The chart also shows how affordability changes at higher interest rates, indicating that for every 1% rise in mortgage interest rates, affordability declines by about 10%.

affordability index

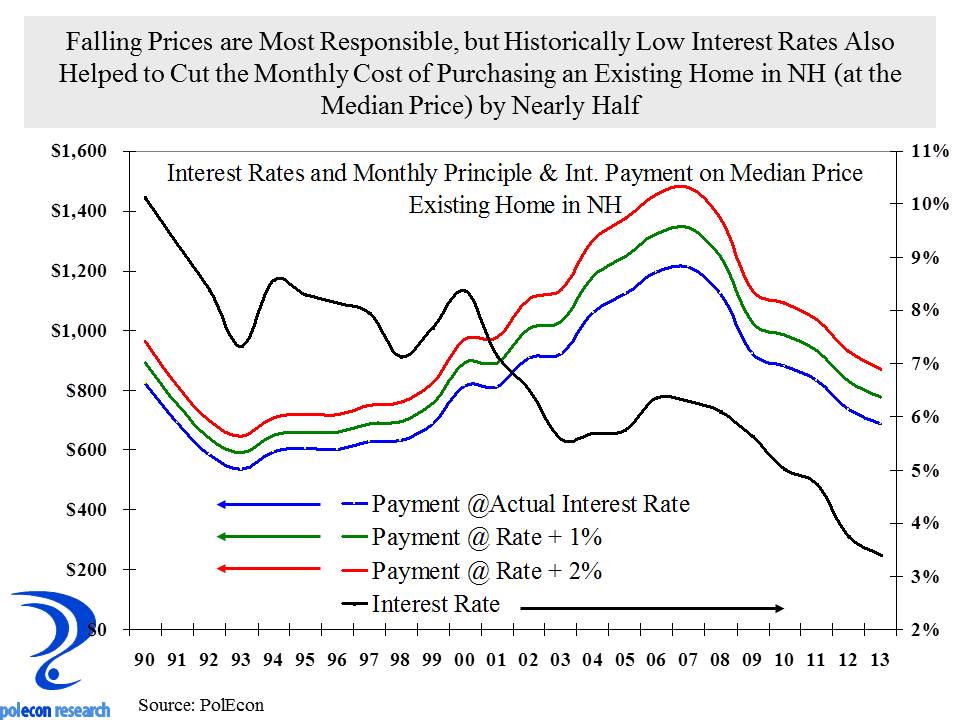
The final chart shows how dramatically the combination of lower prices and falling interest rates affects the monthly principal and interest payments required to purchase a home in New Hampshire at the median purchase price and prevailing interest rates.   The chart also shows how the monthly principal and interest payments on a median priced home in NH would have been affected by interest rates that were 1% and 2% higher than they actually were.  The chart shows how significant changes in monthly payments can be at higher interest rates.  The impact of interest rates on monthly payments is more dramatic when home prices are higher so lower prices in this case suggest that an uptick in rates may have  somewhat less  of an impact than in the past.  Nevertheless the impact on affordability and prices of higher interest rates will be clear.

monthly pruchase costs and interest rates

A key question is how much of the recent rise in prices is the result of a genuine increase in effective demand for homes and how much is the result of the capitalization of interest rates into the purchase price (when rates are low sellers can get higher prices and still keep housing affordable but when mortgage rates are higher sellers must charge less to keep the same level of affordability).  For certain we know that more homes are being purchased, what we will find out, if interest rates continue to rise, is how much of that and sales prices are driven by low interest rates.  In new Hampshire this is especially critical because we have a relatively high percentage of homeowners with negative or near negative equity in their homes and changes in interest rates may determine whether or not they can sell their homes without incurring a loss.

Improving Household Net Worth and Cash Flow Bode Well for Spending

April 1, 2013

Improvements in the balance sheets and cash flow of households along with continued if not robust improvement in the labor market bode well for consumer spending  as the year progresses, helping the economy overcome the negative impacts of  payroll and other tax increases.

Home equity is a strong driver of the buying power and spending decisions of households.  Home prices are rebounding across the country and even New Hampshire is beginning to show some strengthening according to Core Logic’s Home Price Appreciation Index.  Appreciation in NH remains below a majority of states and well below the 15% suggested by the industry in the state.

January HPI

While home prices are still off from their 2006 peak, the rise in home prices has raised homeowners’ equity $1.6 trillion over the past year. This is the second largest nominal gain on record since 2005 when homeowners’ equity was up $2.0 trillion. In percentage terms, owners’ equity as a share of household real estate rose to 46.6% last year compared to 40.5% in 2011—the previous cyclical peak was 59.6% in 2005—and an all-time record low of 37.3% in 2009.

Private retirement and pension accounts represent a much smaller component of the net worth of households but they are key contributor to households’ sense of  financial “well-being” and a contributor to the “wealth effect” that impacts household confidence and their willingness to spend.

Private Pensions

The equity of homeowners is the largest contributor to the improvement in household net worth but the value of  the private pension accounts of households along with the rise in the value of the stock market are adding to consumer’s willingness to spend.  Lower interest rates, lower levels of debt, and improvements in wage and salary income are also improving the cash flow of households.  In combination, the outlook for consumer buying power and spending in 2013 looks like it could be stronger than the growth in the underlying economy would suggest.

Household Net Worth

This Crash Was Different

December 13, 2012

This is my second housing market crash since I’ve been in NH and old enough to know anything about them.  The first was the great crash of the late 1980s and early 1990s that took with it the five largest banks in NH and many of the largest banks in New England.  But that crash was fundamentally different and was largely the result of tremendous overbuilding of housing in the state and the region during the mid and late 1980s (see graph below).  Even the recent crash was, in large part, the result of over-building in many of the hardest hit states like Nevada, Florida, and Arizona.  Where overbuilding occurs, downturns are a more dramatic combination of excess supply and and a retreat from irrational expectations of price appreciation.  Again, because NH didn’t overbuild this time, our price declines weren’t as dramatic as many areas of the country and our rebound likely won’t be as dramatic either.  If values have fallen 50 percent as they did in some states, you can get pretty large jumps in appreciation quickly as things stabilize – even though a 10% price appreciation still means values are down 40%.

NH Housing Permits

In NH we don’t have years of excess housing supply to work off before prices can begin to recover.  This time around recovery in prices and new construction will be about the fundamentals that drive the demand for housing, population and job growth, new household formations, and the need to replace old units – I’ve noted that  before (and here).  I wish people would look to job growth in NH instead of what is happening to home prices in other states if they want a clue as to where NH prices are going.  One of the great unknowns is whether the recent troubles in the housing markets nationally and in NH have fundamentally altered perceptions of the value and desirability of homeownership.  I don’t have an answer to that but one indicator could be the percentage of new construction that is for single units versus the percentage for multi-unit structures.  The chart below does suggest that the percentage of building permits for single units in NH did trend lower as the market began to decline, and is likely an indicator of developer’s responding to a lower level of demand for single family housing compared to multi-unit.  Whether this is just temporary or a longer-term adjustment in the attractiveness of single family housing remains to be seen.

NH Single Unot Housing Permits

The Home Price Rebound That Wasn’t

November 29, 2012

The Federal Housing Finance Agency released its latest home price appreciation index on Tuesday and while the data support the belief that housing is bouncing back across the country, and is now becoming a positive influence on economic activity rather than a drag,  the news is not good for New Hampshire.   The FHFA’ s repeat sales home price index shows that NH is one of only a few states that had price depreciation between the third quarter of 2011 and the third quarter of 2012 and only two states (Maine and Rhodes Island) had lower appreciation rates than did New Hampshire.

Repeat sales indices are the only accurate way to measure changes in home prices.  Simply examining median sales prices doesn’t account for the fact that the characteristics of the houses sold may be different (location, size, type, etc.) unless the repeat sales method is used.  I am by nature an optimist.   I am rooting for the housing market because its rebound is important for the prospects of the NH economy and its not so bad for my balance sheet either.   I am also not looking for yet another reason for realtors to take exception to some of my analyses.   I am, however,  a believer in the wisdom of markets (most of the time) but a lot of what happens in markets is driven by pure stupidity – or, rather, inattention, misinformation about fundamentals, and an exaggerated focus on currently circulating stories (the housing market is back, Mitt Romney has got the momentum in the swing states).  At least one of those stories is true , the housing market is coming back as a whole in the nation, just not everywhere.

As I have noted in prior posts, no amount of exhortation and cheer leading about housing can overcome the fact that values are determined by fundamental underlying demand for housing which includes population and job growth, the formation of new households, and the need to replace older housing units.   Both NH’s job and population growth have been weak relative to a majority of states over the past couple of years.  Regressing  job and population growth over the past year in each state on the FHFA’s home price index-based change in home prices in each state shows a highly significant relationship (R=.603) accounting for about 40 percent of the variation in home price appreciation across states.  There are variations in markets within each state, and this analysis is an oversimplification, but nevertheless it is important to remember that home price appreciation cannot, for long at least, outpace the fundamental determinants of the demand for housing – job, population and  household formation growth, and the need to replace obsolete structures.

%d bloggers like this: