Whether or not New Hampshire’s largest electric utility should divest its generating facilities is a hot topic again. The NH Public Utilities Commission issued a preliminary report last week which concluded that it is in the economic interests of PSNH’s retail customers for the company to divest its generating assets. The report was less sanguine about the economic impacts on customers not purchasing electricity from PSNH, but that depends on how the stranded costs are allocated in any divestiture.
“Staff continues to believe that over the long term, PSNH’s default service rate will be substantially higher than market prices resulting in continued upward pressure on default service rates. Based on La Capra’s forecast of wholesale prices in New Hampshire and adjusted for retail, Staff’s rate analysis indicates that PSNH’s default service customers would be better off under a divestiture of the PSNH assets if the stranded costs were recovered from all customers. Customers who do not receive default service from PSNH, however, would see rate increases through the imposition of a stranded cost charge. While we recognize the volatility in today’s energy markets, the value of PSNH’s “hedge” will likely diminish over the long term and will continue to be at risk due to potential environmental legislation.”
There are also smart and well-meaning people in New Hampshire who argue that that PSNH’s generating assets provide a valuable ‘hedge” given the volatility of fuel (primarily natural gas) prices and the impending retirement of several regional electricity generating facilities. But the value of that hedge depends, in part, on the price paid for it. This winter’s cold snap and concomitant spike in natural gas prices are times when the PSNH hedge did provide some benefits. But even in those instances, the net electricity generated by PSNH was below what it was in the early and mid-2000s (the latest available data is for January of 2014 so this may change with February and March data). The figure below shows the capacity utilization of PSNH’s coal-fired generating units on a monthly basis during three separate time periods. Capacity factors are the ratio of net electricity actually generated to the total potential electricity that could be generated by a facility (for this analysis I used the average of winter and summer coal-fired capacity for each facility -Merrimack and Schiller stations – rather than the nameplate capacity).
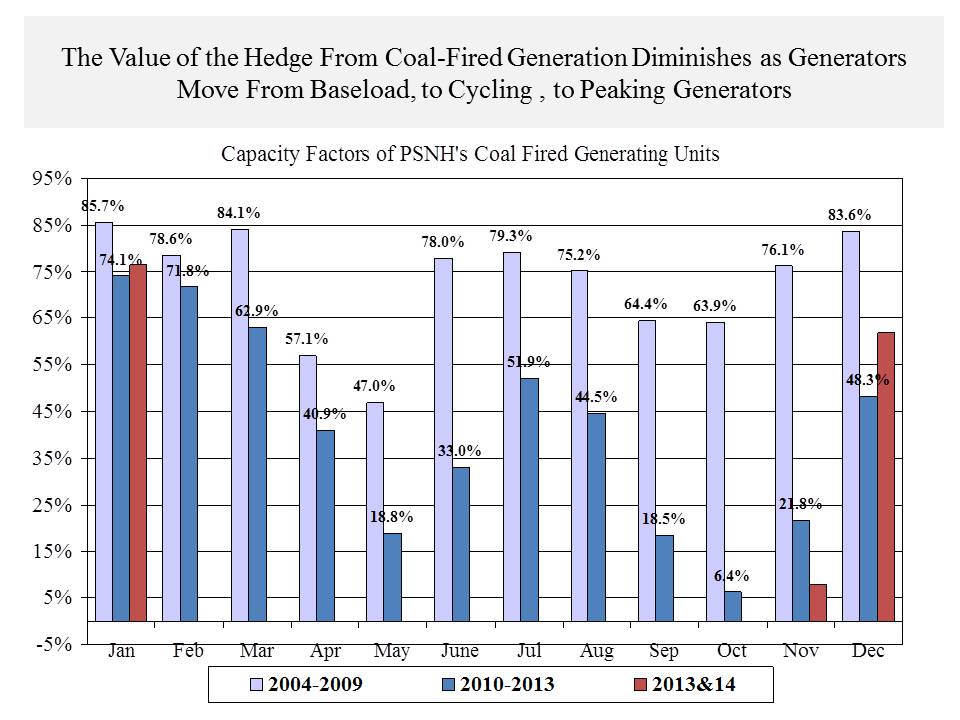
The chart shows that from 2004 to 2009, PSNH’s coal-fired generating units were primarily ‘baseload” generators, operating at 60% of capacity or higher. I have previously written about how electricity gets sold into the regional market and which generators will provide that electricity (which determines their capacity utilization) so I won’t cover that again here. Baseload generating units typically operate 24 hours per day year-round baring maintenance outages. At the other end of the spectrum are peaking generators, which mainly operate when hourly electricity load demand is at its highest (think the hottest summer and coldest winter days). Intermediate (or cycling generating units) operate between base load and peaking generators, varying their output to adapt as demand for electricity changes over the course of the day and year. After 2009 the decline in natural gas prices along with higher generating costs, including environmental, associated with PSNH’s coal facilities have resulted in the price at which it can supply electricity to the regional grid being higher than many other generators. As long as their generating cost remain higher, except for times of peak demand, limited capacity by other generators, or when events like the spike in natural gas prices occur, PSNH’s coal-fired units will produce little electricity for sale to the regional grid. During 2013 alone, there were six months when the coal units operated at less than 10% of capacity. PSNH’s coal-fired units have gone from baseload, to intermediate generators and as the chart below shows, when averaged over 12 months, they are looking a lot more like peaking units. Whether this pattern will continue is the heart of the debate over whether PSNH should be required to divest its generating assets.
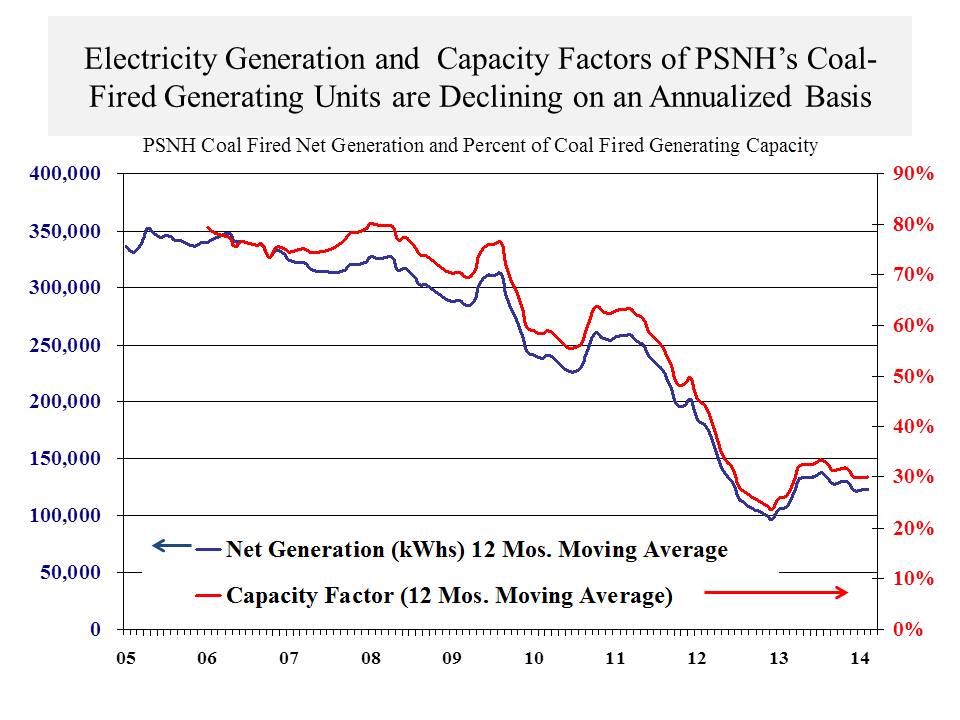
It becomes a lot harder to amortize the costs of generating units as their capacity utilization is lowered. There may be times when the hedge provided by PSNH’s generating assets provides a benefit and that would be truer if the units were baseload generators. But even with the extremes of this winter’s cold, price spike in natural gas, and high demand for electricity, the chart above shows, over the course of a year, the facilities have moved from baseload generators, to intermediate, and are trending toward peaking units. The NH Public Utilities Commission, its consultants, and a lot of other knowledgeable people think that, despite current market conditions and the uncertainties surrounding regional generating capacity and natural gas supply and price, these trends will continue.


