Archive for the ‘Labor’ category

Maximizing Costs and Benefits of the Minimum Wage

April 1, 2014

Note: Links updated and some errors corrected at 6:23 pm

Lawmakers want to do the right thing on the minimum wage issue and even if some don’t, the issue is a highly symbolic indicator of one’s position on a number of important policy issues. That’s too bad because it reduces the probability that the issue will be decided entirely on its merits (benefits versus costs). With so much hyperbole on both sides of the debate it is difficult to know what the “right thing” is and raising wages for those at the bottom of the wage scale has a lot of appeal as an easier and faster way to augment income than is increasing the productivity and educational attainment of individuals.
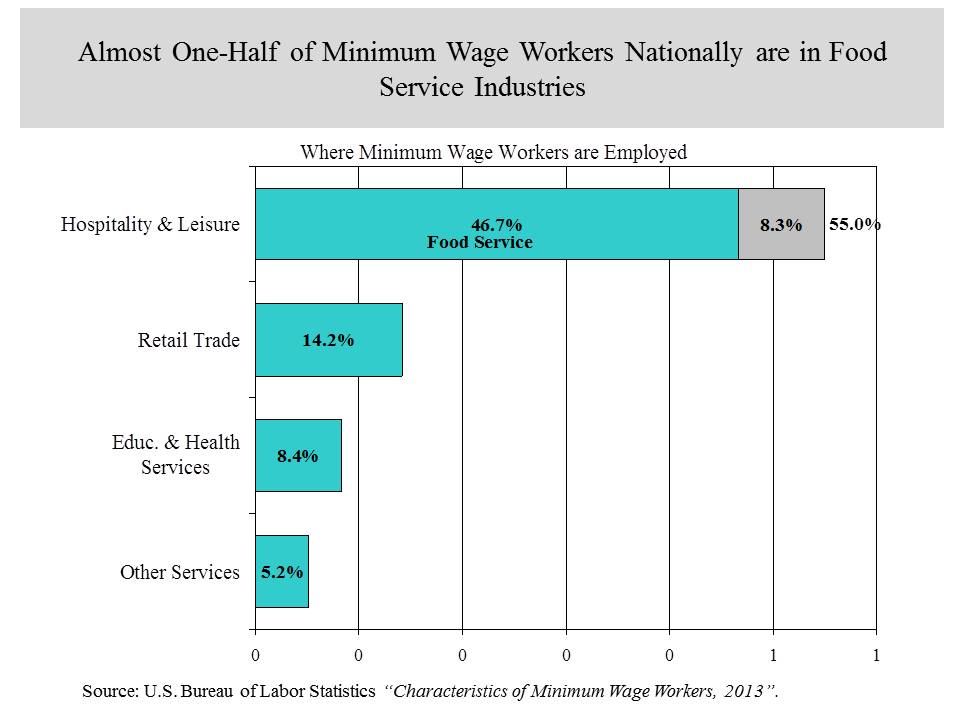
This month the U.S. Bureau of Labor Statistics (BLS) issued a brief report on minimum wage workers. Anyone interested in the policy debates about minimum wage should at least peruse “Characteristics of Minimum Wage Workers, 2013.”  According to the BLS, about 59 percent of workers in this country are paid on an hourly basis and the percentage of that group that is working at or below the minimum wage declined to 4.3 percent last year. Thus about 2.6 percent of all workers (those paid hourly and those on salary) are paid at or below the minimum wage. Most of those workers are employed in a few industries, led by the food service industry which employs nearly one-half of all workers making at or below the minimum wage.
min wage industries

New Hampshire is immersed in its own debate over raising the state’s minimum wage. In what was largely a symbolic measure, the prior legislature repealed the minimum wage and the current legislature looks to reinstate and raise the minimum wage in the state. My analysis of data from the U.S. Census and BLS’s “Current Population Survey” (CPS) indicates that about 10,000 workers in NH earn at or below the national minimum wage of $7.25 (this number is slightly below the 11,000 estimate in the BLS report, but that report rounds the NH estimate so the discrepancy is probably less and well within the CPS’s sampling error).

number of min wage workers
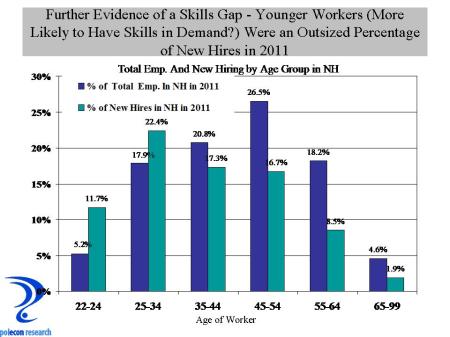
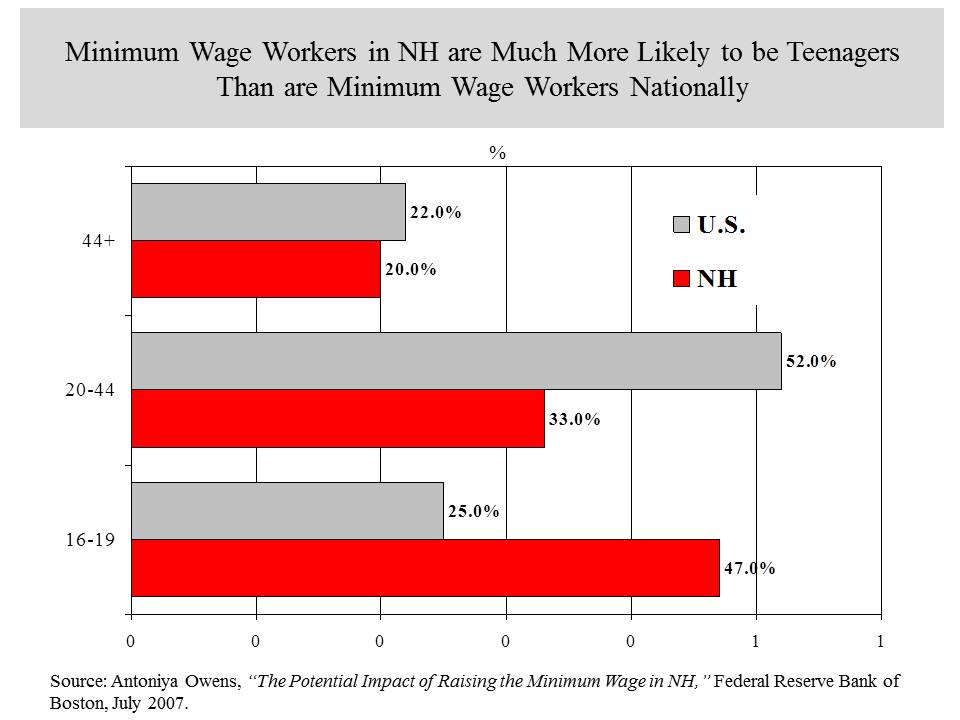
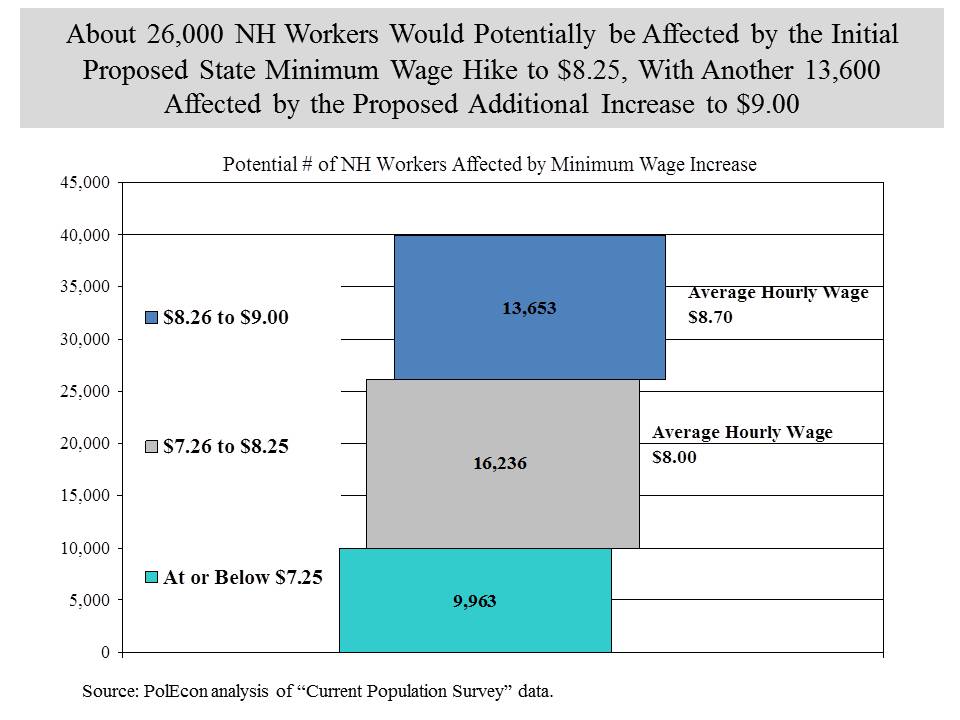
Another 16,200 earn between $7.25 and the proposed new state minimum of $8.25. Thus about 26,000 hourly workers, about two-thirds of whom are mostly in the food services and retail industries, would be affected by a $8.25 minimum wage. A second proposed increase to $9.00 would affect another 13,600 workers. So all told, about 40,000 workers or about six percent of all workers in the state could be affected. I did not analyze the age composition of NH’s minimum wage workers but a 2007 study by the Federal Reserve Bank of Boston did and they conclude that younger workers comprise a larger portion of minimum wage workers in NH than in the U.S. as a whole. Almost one-half of workers at the minimum in NH are teenagers age 16-19 (chart below).

age of min wage workersWhatever the result of NH’s minimum wage debate, a lot of people earning far more than minimum are working to influence the outcome. I have no personal or professional stake in the minimum wage debate but I like the issue because it is a documentary on highly-charged policy fights, combining real and perceived forces of good and darkness: economics, emotion, populism, ideology, compassion, greed, idealism, labor versus management, as well as wealth versus want. The minimum wage debate also provides some of the clearest examples of the tradeoffs involved in public policy choices. In this case, the tradeoff is raising wages for some while reducing the employment opportunities (hours or jobs) for others. Despite what the media say, and the President’s statement that “there’s no solid evidence that a higher minimum wage costs jobs,” most economists do agree that minimum wage increases result in some economic damages (reducing employment). They don’t agree on everything about the impacts of the minimum wage, however, and a good number of reasonable economists believe that the negative employment impacts from minimum wages are offset or even outweighed by the benefits. The negative employment impacts are substantial but do not appear, to me at least, to be dramatic, which of course is a fairly insensitive view that could only be held by someone not negatively impacted by an increase in the minimum wage (who are likely to be the least skilled and with the fewest economic opportunities among us).

In any case, having some negative impacts is not, in itself, enough to reject a policy. Most people, me included, accept the fact that the tradeoff for a compassionate policy that provides a minimal cushion against the ravages of unemployment (unemployment compensation) is some increase in the rate of unemployment. There are just as many or more policies that benefit some businesses or industries but also have some negative competitive impacts or costs to consumers.

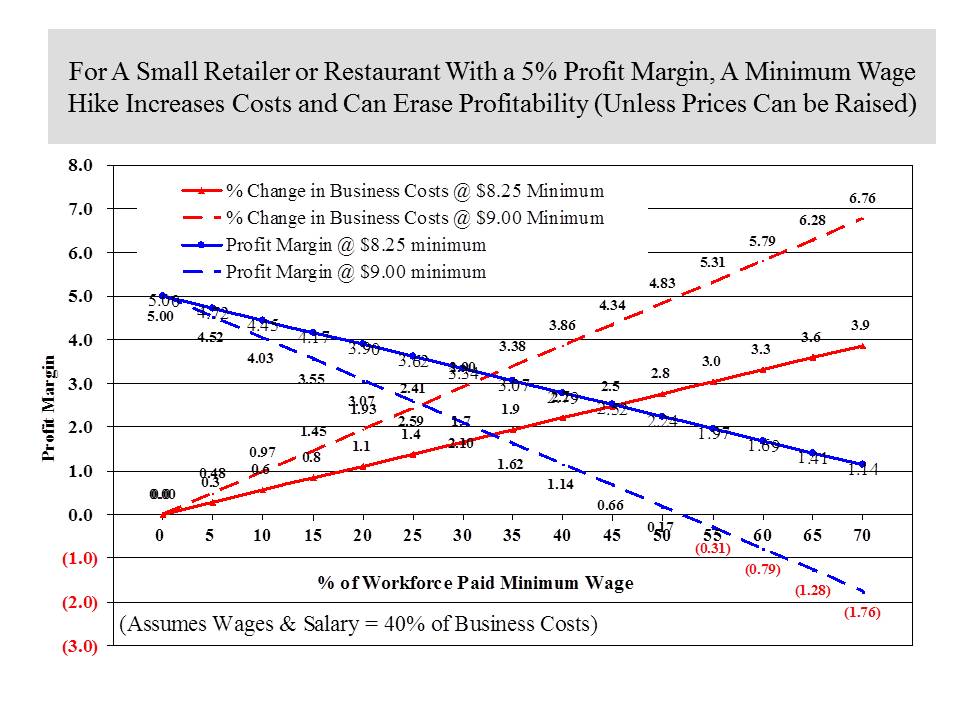
I don’t have strong feelings either way about re-establishing and raising the state’s minimum wage. Raising the state’s minimum wage will cost some businesses and/or consumers more and reduce and have some negative impact on employment and hours worked (see the Boston Fed’s study here if you don’t trust me). The chart below demonstrates (too busily) the impacts on a business of an increase in the minimum wage assuming they can’t or don’t raise prices and any increase in the minimum wage comes at the expense of profitability (that is increases is efficiencies can’t offset wage increases). Wages comprise close to 40 percent of business costs for both food service and retail businesses and the high-end of profit margin in those industries is about 5 percent so the chart also incorporates those two assumptions. Depending on what percentage of the businesses’ workforce is currently at or below the minimum wage, the chart shows how business costs increases for both the $8.25 and $9.00 increases (the red lines), as well as how profitability is affected (the blue lines). It may use simplifying assumptions but I think the chart demonstrates why businesses in affected industries are so opposed to a minimum wage increase. While expenses appear to rise modestly, profit margins can quickly erode.

business impactsMy issues with raising the minimum wage tend to be more about the distribution of the impacts than with their magnitude. Freedom from want for working Americans should be a national goal. If augmenting the income of individuals with the least earning power (because of experience, skills, education, etc.) is a national goal, it is it is hard to see why that responsibility should fall only on a few industries that employ these individuals, especially when doing so will only decrease the opportunities for employment.  That seems to be the philosophy behind the Earned Income Tax Credit.  There are other distributional impacts as well.   Those with the least opportunities bear the greatest negative employment impacts even as they also receive some benefits.   Big companies are more able to absorb higher costs and in any case are less likely to pay minimum wage, so smaller, local businesses already at a cost disadvantage can be put at even more of a competitive disadvantage.   This is especially true in rural areas. Small, rural towns have lower costs, especially for real estate, so an increase in the minimum wage gives cities and big companies competitive advantages at the expense of small and rural employers.

As is the case with most policy debates, proponents of a minimum wage increase maximize benefits and minimize costs while opponents minimize the benefits while maximizing the costs.

Can “Paycheck Equity” be Mandated?

January 28, 2014

For decades, one of the most salient features of women’s status in the labor market was their tendency to work in a fairly small number of relatively low-paying, predominantly female jobs. That has changed and as it has differences in aggregate average wages between men and women (the most often cited data on the “wage gap”) have narrowed. Still, the aggregate average wages of women are  almost 20 percent lower than the aggregate average for men.  But that data say almost nothing about whether employers compensate men and women in similar positions differently.  Only a thin veneer of empiricism covers what seems to me to be fundamentally ideological arguments in the public debate on what, if anything, government should do to address the gender wage gap issue.  Proponents of “paycheck equity” measures don’t often acknowledge that research shows that differences in labor force participation, occupation, experience, etc. account for the majority of the difference between the average wages of men and women. While those who believe markets (including labor markets) operate perfectly, and who reject almost all government interjections into markets, fail to note that even accounting for differences in occupations etc., there is still a significant portion of the pay differences between men and women that is unaccounted for or “unexplained.”  The unexplained portion of the wage gap is probably 8 percent or less and whether this difference in wages is the result of biases or discrimination that can be remedied by legislation is the fundamental public policy at issue.

Living with four, smart, talented, women with strong opinions makes me approach this subject with trepidation.  It is possible that one or more of them may talk to me even less than they do now  (I am comforted knowing that it gets incrementally more difficult for this to occur as the amount approaches zero) if my interpretation of the issue is in error in their eyes.  Still, as the father of daughters, I want to know if there are any biases in the labor market that may constrain their earnings and limit their ability to care for me in my dotage.

To truly know whether biases or discrimination (intentional or not) contribute to the wage gap you have to do the impossible, you have to compare the wages of men and women with identical ages, education, qualifications, experience, motivations, work habits etc., in identical jobs, working for identical companies, and you have to do it for the entire male and female workforce (across all occupations).  Nobody can do that so in the absence of a Boston Celtics, Boston Bruins, or UNH hockey game on television this past Saturday evening I undertook a smaller task to gain the kind of first-hand insight into the issue that only analyzing data can provide.

My goal was to compare the wages and salaries of full-time working men and women who are as similar in education, age, experience, occupation and other factors (marriage, children etc.) as possible, to see if wage and salary difference exist when as many key characteristics of individuals are as similar as possible.  The 2009 March Supplement of the U.S. Census Bureau’s “Current Population Survey” contains information on the college majors of those who have earned degrees, in addition to the usual labor force, earnings, and demographic information it provides about survey respondents.  I extracted microdata for over 5,000 survey respondents nationally whose highest educational attainment was a bachelor’s degree in accounting and who were employed full-time as  accountants or auditors.  Focusing on just one occupation and one level of educational attainment limits the ability to generalize my results (that is, results and conclusions may not apply to other occupations or to other levels of educational attainment) but choosing just one occupation that has a relatively equal employment distribution between men and women, and just one education level is likely to provide the cleanest evidence or lack thereof for the wage gap.

Many factors contribute to gender wage differences between men and women in the same occupation.  In the end, like other researches, my analysis showed that under 10 percent of the difference between the wages and salaries of men and women (in accounting) cannot be explained by difference in hours worked, the presence of children etc.  This little exercise cannot say whether those “unexplained” or unaccounted for factors mean discrimination or bias or less pernicious forces that are not captured or measured with available variables.  Regardless, the results were fascinating (to me at least) for a number of economic and sociological reasons.

At all age levels, women in accounting worked (on average) fewer hours weekly than did men (Figure below).  This was true for women with and without children and whether they were married or not.  Regression models show that each additional hour worked per week actually added more to the annual wage and salary of women than to men ($641 to $568).  This suggest to me that women are rewarded equally for additional labor and that some of the wage gap in accounting is simply attributable to the longer (on average) hours worked by men.

hours workedChild birth and care is associated with lower labor force participation among women but on average, women in accounting worked fewer hours than did men whether or not they had children.  This is not an epiphany because child care responsibilities still disproportionately fall on women.  The presence of children, however, does have a much more negative impact on hours worked for women than it does for men. The effect on hours worked diminishes by age for women – presumably because children are more likely to be older and in need of less care.  Interestingly, among younger men, the presence of children reduces hours worked (not as much as it does for women) but among older men, the presence of children is associated with small increases in hours worked.  I hope this implies larger roles in child care among younger men that will contribute to a further narrowing of the wage gap.

Impact of Children on Hours workedWages grow with age and experience (typically for most individuals into their late fifties) but among accountants with bachelor’s degrees, they grow less, on average, annually for women than for men.  The cumulative effects of hours worked, breaks in labor force participation among women for child care, and other factors can account for some of this.  But key factors that can determine how much wages grow over time (getting promotions, asking for raises, motivation etc.) cannot be discerned from the data.  If women aren’t promoted as readily or don’t seek raises as often or as large,  their annual wage growth would be expected to be lower.

The figure below shows some of the wage and salary impacts for men and women of different variables.  Interestingly, marriage seems to have a much more positive impact on the earnings of men  than it does for women,  adding $3,415 to earnings of men but just $920 for women when controlling for other variables (i.e. age and hours worked, children,  etc.).

wage and salary impactsApparently some stereotypes are based in reality and it makes me wonder what aggregate economic and societal implications this may be having as more young men seem to resist or delay marriage or long-term relationships.  The big take away for me was the impact that marriage as well as the “unexplained” difference attributable to gender had on wages and salaries when earnings were not “constrained,” meaning that the data included the earnings from the highest earners, the “outliers” or top 15 percent who earn much higher salaries than typically earned in the occupation.  For most of my analyses I selected data for individuals whose wages and salaries were between the 15th and 85th percentile of all earners among accountants.  But I also ran the same analyses using data that was not constrained at the top of the earnings scale.  This would likely include business owners and individuals in higher level positions.   When data was not constrained based on wages and salaries, the impact of marriage on the wages and salaries of women was significantly negative in contrast to the wage and salary constrained data where it was positive (albeit a much smaller relationship with earnings than for males).  The unexplained difference attributable to gender was also disproportionately large compared to the constrained data set.  What this says to me is that the largest evidence of a gender wage gap occurs at the upper end of wages and salaries and may be more attributable to lower percentages of women in higher positions (a “glass ceiling” effect) than a paycheck fairness effect.  Does this mean that women are at a disadvantage in becoming high earners if they are married, and if so, is it the result of personal choices or does the labor market systemically punish them relative to men?  Does being married necessarily mean that a woman will be less likely to rise to the top of their occupation?   These results do suggest a glass ceiling that contributes to the wage gap and this should trouble all fathers of daughters, brothers,  husbands and even friends.  Unfortunately, it doesn’t say much about what we can do about it.

We do have laws that prevent wage and salary discrimination based on race and gender and yet the wage gap persists (even as it has shrunk).  As more women populate higher levels of occupations and organizations (it will happen as I suggest here and here and in several other posts), it is likely that whatever unexplained gender-based differences in wages and salaries (that are not based on occupation, education, experience etc.) will decline rapidly.  To me, addressing why more women don’t reach higher positions in organizations  is likely to be a much more effective prescription for whatever gender gap continues to exist than are mandates that seek to compensate for factors that we aren’t even sure contribute to wage and salary differentials between genders.

Give Me Your Huddled, Talented Masses

April 19, 2013

This is a week that reminds us of how many people from around the world  want to harm the U.S.  and just how easy it can be.  This is a day when a daughter who was supposed to be coming home for the weekend  is unable to leave her apartment, catch the “T”  or even get a cab to North or South Station where no trains or buses are leaving the city of Boston anyway.  For me at least, its not an easy time to be rationale and analytical.  That is precisely why this is an especially good afternoon to highlight, in one small way, how much the presence in the U.S. of individuals from the rest of the world contributes to our economy, communities, and society.

A lot of attention is focused on the relative inability of the U.S. to produce enough individuals with the education and training needed to fill critical  openings in scientific, technology engineering and mathematics (STEM) fields.  Why that is is the subject for another (or many other) posts.  There aren’t enough individuals in this country with STEM degrees to meet existing demand according to businesses that employ them.  Looking at unemployment rates for individuals with science, tech, engineering and math degrees seems to validate that belief.   But the U.S. would be even further from meeting the demand if it were not able to tap a global labor market.

I’ve been looking at trends that affect recent college graduates so I will focus on the importance of foreign-born individuals to the supply of skilled workers among recent college graduates and younger workers in the U.S..  I sorted data on individuals in the U.S. workforce,  age 24-29, with a Bachelor’s degree or higher, according to the college major of their first college degree, and then by the percentage of individuals in each major that were foreign-born.  The results are striking.  Overall, about 13.6 percent of all workers age 24-29, with at least a Bachelor’s, are foreign-born.  However, the percentage in STEM majors is dramatically higher, comprising  30, 40, to as much as 50 percent of young people and recent graduates in some major fields of study.  By far, the majors with the highest percentage of individuals that are foreign-born are STEM majors.

Foreign Born STEM Grads

The data make clear how important the rest of the world is, and will continue to be, in meeting our economy’s demand for skilled workers.  On an afternoon, in a day, during a week, like this one, data doesn’t have much influence on our thoughts or maybe just not on mine, and that is all the more reason to look closely at it.

It Seems You Can’t Turn White Collars Blue

January 8, 2013

Two contradictory trends are occurring in NH’s labor market and as Ricky Ricardo would say “somebody’s got some splaining to do”.   I see no other hands up in the room so I will take a brief stab at it.  The chart below shows that help wanted ads in NH rose modestly this year but the rate of employment growth in the state has been declining.

Help wanted and Emp Growth iin NH

It is easy to rest things on, and to take things off, the top of a flat head so here are a few off the top of mine that could be influencing these trends: 1) It could be that more jobs are being advertised in NH but are for companies with multiple locations – including NH and nearby states (I think this is not likely to be having much affect), 2) advertised jobs are not being filled because there are not enough applicants companies want to hire – “the skills gap” again (I think this is significant based on conversations I’ve had with companies), 3) the job growth numbers in NH could be revised upward with the upcoming benchmark revisions (I think this is likely but it may not be as significant as I thought a few months ago).

Regular readers know I write too often about the skills gap.  I like the issue because it gets at so many issues of fundamental importance to the future of NH’s and the nation’s economy – education and training, k-12 and post-secondary education, young people and their guidance and direction etc.  The skills gap is most often associated with very skilled scientific and technical occupations but in NH at least, any skills gap may be more pronounced in production and skilled “blue collar” occupations.  Based on the volume of  help wanted advertising in the state since the recession, the demand for those occupations has increased significantly compared to management, financial, business, technical and scientific occupations.

Help Wanted by Occup Since Recession

Despite the large percentage increase in help wanted ads in production and skilled blue collar occupations, employment in industries that employ those occupations has grown little.  It may be that there is a lot of ‘churning” in those industries (some businesses hiring and some contracting) resulting in little net employment gain but the anecdotal evidence (I am reluctant to rely on such evidence but it is the best we have at the moment) is that many businesses who would hire production and skilled, blue collar workers are unable to find individuals to fill their positions.

It has been a relatively recent (over the last several decades) transition for NH to a more technology intensive economy that relies less on production and skilled, blue collar labor.  Once the core of the NH economy it has been a long while since NH was seen a a land of opportunity for those who worked with machines and tools (other than just  computers) and once you have moved on  it can be very hard to go back – even when there is a reward for doing so.

Hiring by Age: More Evidence of a Skills Gap?

December 10, 2012

I know its a tough labor market for young people and recent college grads, but they still represented a larger portion of new hires in NH in 2011 than would be expected based on the percentage of employment by age in the state.  The chart below shows the age distribution of  employment in NH in 2011 along with the percentage of new hires in the state by age group.   Although job growth has been slow this recovery, the chart still shows that among those who have been hired for a new job (that is the hiring that is not a “call back” of a previously laid-off worker), younger workers make up a disproportionate number of the new hires.

Emp by age

This could be more evidence of, as well as a subset of,  the “skills gap” debate.  Many employers complain that the skills that young workers and recent grads posses don’t match their needs, and this is true for many occupations, but what this data also seems to suggest is that the mismatch between the demands of employers and those seeking work among the existing workforce is even greater than that for younger workers and new entrants to the labor force.  It suggests a bigger problem than just getting kids into the right majors and training programs (although that is a big part of it).  It points to a larger problem of a fundamental change in the types of occupations in demand (or the skills required of the same occupations) as well as a “twist” in the labor market that results in differences in the occupational make-up of industries.  It is a much more difficult , slower, and likely painful process to have the existing workforce adapt to these changes in order to increase their employment prospects than it is to begin with the next generation of workers, although both will challenge future employment and economic growth for some time.

Of course it is possible that employers just prefer younger and perhaps less expensive workers and that is what accounts for their outsized share of recent new hires.  Or it could be a function of the type of industries that were hiring in 2011 (I will be examining this hypothesis).  It may be more comforting to view labor market trends from those perspectives but it won’t get us any closer to taking the personal and policy actions necessary to create greater alignment between the skills of our workforce and the skills needed for a more prosperous economy.

Help Wanted Ads Drop, Labor Supply-Demand Ratio Rises

December 3, 2012

Online help-wanted ads in New Hampshire declined again in November according to the Conference-Board,  although the number of ads remains substantially higher than it was in November of 2011.  All occupational categories saw a decline in help-wanted ads with the exception of construction, production and transportation workers.  This is consistent with anecdotal and some empirical evidence about the demand for production workers impacting employment growth as discussed in a November 21 post.  For the second month in a row the largest percentage decline in ads was in professional, technical, and scientific occupations, although this broad occupational grouping still has the largest year-over-year increase in help-wanted ads in New Hampshire  between November of 2011 and November of 2012.

Help Wanted and Unemp

The chart shows recent trends in help-wanted advertising in New Hampshire, along with the ratio of unemployed workers in New Hampshire to the number of help-wanted ads, the “supply-demand ratio” for labor in the state.  After falling to about 1.4 unemployed persons for every help-wanted ad in the state, the ratio has been slowly rising and now stands at about 1.7 unemployed for every help-wanted ad.  Of course this ratio says nothing about the match between the occupations of job seekers and the occupations advertised in the help-wanted ads, but regular readers know it won’t likely be long before I offer another “skills gap” post that discusses that issue.

The Feminization of NH’s Workforce

October 22, 2012

Nothing gets you thinking about gender equity issues more than being the father of three daughters, except maybe being the father of four or more daughters.  In my upcoming October edition of  “Trends Lines” I am looking at trends in NH’s labor force.  One of the more significant trends is the increasing percentage of women employed at businesses in NH.  Despite the fact that men participate in NH’s (and the nation’s) labor force at higher rates (about 9% higher in NH) than do women, women now are a slight majority of employees at businesses in NH.  Women comprised 51% of employees covered by unemployment insurance during the third quarter of 2011 – the most recent data available.   Only in Hillsborough and Sullivan Counties are men a majority (and by less than 1%) of employees at NH businesses.

Among workers with the highest level of educational attainment, those with a bachelor’s degree or higher, women comprise 52% of those employed by NH businesses.   Moreover, the percentage of NH workers with the highest levels of educational attainment who are women is likely to increase because the percentage of new hires (not including recalls of  layoffs), with at least a bachelors degree, who are women, is now even higher (53% – see chart below).  These differences don’t seem large, but over time  they have tremendous implications for the economy and for society.

I don’t know if this data says more about the changing nature of the workplace or the changing nature of the male workforce, but as the father of three daughters, my anecdotal experience leads me to believe it is more about the latter.

The Skills Gap Debate – Round 1

October 18, 2012

Two charts may tell an important story about New Hampshire’s labor market and perhaps trends in the economy.  Help-wanted advertising has been rising in NH and as I’ve written before, it suggests job growth should be higher in NH  based on the long-term relationship between help-wanted ads and employment growth in the state.  A “skills gap” is one explanation for the divergence between help-wanted and job growth in NH, but I also offered that the divergence, along with trends in aggregate wage growth in NH  may mean employment numbers will be revised upward.   My money is still on an upward revision of job growth, with the skills gap playing an important  role for some industries and occupations, because NH has more help-wanted ads per 100 individuals in the labor force than all but 10 states – job growth should be higher (chart below).

I would be more convinced of the skills gap being broadly responsible for slow growth in the state  if a high percentage  of help-wanted ads in New Hampshire were for the highest skill occupations (professional, technical, scientific and management), but as the chart below shows, NH ranks well down the list of states on the percentage of help-wanted advertising that is for the highest skill occupations.  A skills gap could still exist between available jobs and available labor for occupations requiring specialized skills and training, even if they are not in professional, technical , or managerial occupations.  Anecdotal evidence suggest many employers are having difficulty finding workers with the right skills.  The skills gap demands further investigation, right now I am more concerned about what the relatively lower demand in NH for the highest skill occupations implies about our state’s economy.

Manufacturing’s Toughest Sell

October 12, 2012

The percentage of younger workers in the workforce is declining in NH, as it is across the country, but the trends are different for specific industries and occupations (more about that in a later post).  Simply put, some industries are capturing a larger share of a smaller cohort of younger workers and the key for any industry or occupation is to have appeal for younger workers and students.  How does an industry capture more younger workers?   Is it because the industry is perceived as being desirable or “cool,” or do younger workers respond to signals about the opportunities in an industry or an occupation?

Manufacturing is one industry that has been capturing a smaller share of younger workers (government and utilities are others).   The chart below shows that over the past 15 years the share of younger workers (age 25-34) declined in NH’s workforce (age 25-64).  But the chart also shows that the drop was more pronounced in manufacturing than in the workforce overall.

Government employment hasn’t been perceived as cool for some time but job opportunities have grown or remained steady (except in very recent years) over the years suggesting that “coolness” is a factor in the career choices of younger workers.  For manufacturing it is likely to be a combination o cool and opportunities.  While manufacturers now have good opportunities for young workers, that perception must overcome  decade s of    labor market signals showing large declines in manufacturing employment.  The decline in younger workers in manufacturing roughly corresponds to the change in manufacturing employment in the state (chart below).

Manufacturing employers are in a difficult position.  Fewer households have workers with a history of manufacturing employment, limiting the legacy effects that can contribute to career choices.  A “twist”  (changing occupational makeup) in the manufacturing labor market mean that much of the public and almost no  high school guidance personnel have an understanding of the types of jobs in manufacturing. A general lack of “coolness,” perceived lack of opportunities, and  limited understanding of the opportunities that exist in the industry all mean that manufacturing will have a tough time capturing a larger share of the younger workforce, but it is important to do so for a number of reasons. I just don’t know if manufacturers can do it alone.


%d bloggers like this: