Archive for the ‘Gender’ category

Can “Paycheck Equity” be Mandated?

January 28, 2014

For decades, one of the most salient features of women’s status in the labor market was their tendency to work in a fairly small number of relatively low-paying, predominantly female jobs. That has changed and as it has differences in aggregate average wages between men and women (the most often cited data on the “wage gap”) have narrowed. Still, the aggregate average wages of women are  almost 20 percent lower than the aggregate average for men.  But that data say almost nothing about whether employers compensate men and women in similar positions differently.  Only a thin veneer of empiricism covers what seems to me to be fundamentally ideological arguments in the public debate on what, if anything, government should do to address the gender wage gap issue.  Proponents of “paycheck equity” measures don’t often acknowledge that research shows that differences in labor force participation, occupation, experience, etc. account for the majority of the difference between the average wages of men and women. While those who believe markets (including labor markets) operate perfectly, and who reject almost all government interjections into markets, fail to note that even accounting for differences in occupations etc., there is still a significant portion of the pay differences between men and women that is unaccounted for or “unexplained.”  The unexplained portion of the wage gap is probably 8 percent or less and whether this difference in wages is the result of biases or discrimination that can be remedied by legislation is the fundamental public policy at issue.

Living with four, smart, talented, women with strong opinions makes me approach this subject with trepidation.  It is possible that one or more of them may talk to me even less than they do now  (I am comforted knowing that it gets incrementally more difficult for this to occur as the amount approaches zero) if my interpretation of the issue is in error in their eyes.  Still, as the father of daughters, I want to know if there are any biases in the labor market that may constrain their earnings and limit their ability to care for me in my dotage.

To truly know whether biases or discrimination (intentional or not) contribute to the wage gap you have to do the impossible, you have to compare the wages of men and women with identical ages, education, qualifications, experience, motivations, work habits etc., in identical jobs, working for identical companies, and you have to do it for the entire male and female workforce (across all occupations).  Nobody can do that so in the absence of a Boston Celtics, Boston Bruins, or UNH hockey game on television this past Saturday evening I undertook a smaller task to gain the kind of first-hand insight into the issue that only analyzing data can provide.

My goal was to compare the wages and salaries of full-time working men and women who are as similar in education, age, experience, occupation and other factors (marriage, children etc.) as possible, to see if wage and salary difference exist when as many key characteristics of individuals are as similar as possible.  The 2009 March Supplement of the U.S. Census Bureau’s “Current Population Survey” contains information on the college majors of those who have earned degrees, in addition to the usual labor force, earnings, and demographic information it provides about survey respondents.  I extracted microdata for over 5,000 survey respondents nationally whose highest educational attainment was a bachelor’s degree in accounting and who were employed full-time as  accountants or auditors.  Focusing on just one occupation and one level of educational attainment limits the ability to generalize my results (that is, results and conclusions may not apply to other occupations or to other levels of educational attainment) but choosing just one occupation that has a relatively equal employment distribution between men and women, and just one education level is likely to provide the cleanest evidence or lack thereof for the wage gap.

Many factors contribute to gender wage differences between men and women in the same occupation.  In the end, like other researches, my analysis showed that under 10 percent of the difference between the wages and salaries of men and women (in accounting) cannot be explained by difference in hours worked, the presence of children etc.  This little exercise cannot say whether those “unexplained” or unaccounted for factors mean discrimination or bias or less pernicious forces that are not captured or measured with available variables.  Regardless, the results were fascinating (to me at least) for a number of economic and sociological reasons.

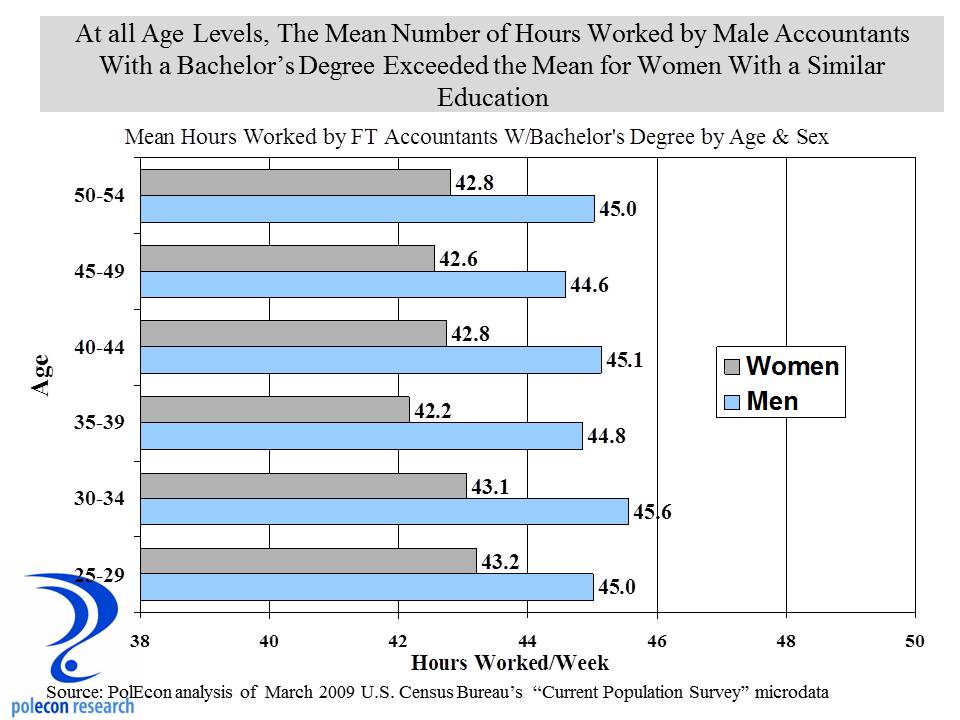
At all age levels, women in accounting worked (on average) fewer hours weekly than did men (Figure below).  This was true for women with and without children and whether they were married or not.  Regression models show that each additional hour worked per week actually added more to the annual wage and salary of women than to men ($641 to $568).  This suggest to me that women are rewarded equally for additional labor and that some of the wage gap in accounting is simply attributable to the longer (on average) hours worked by men.

hours worked
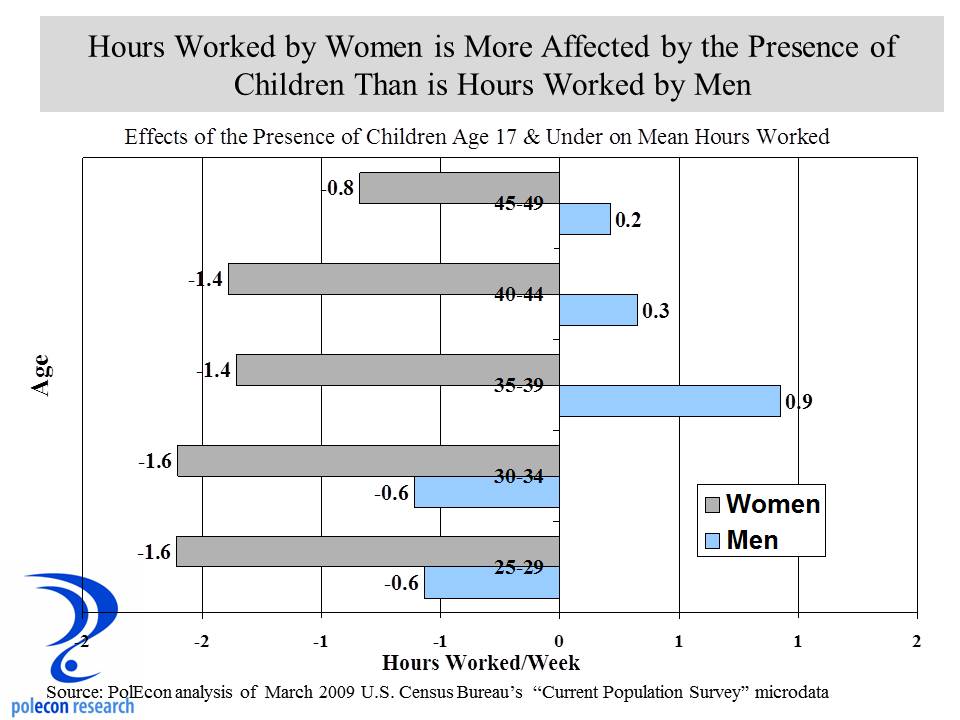
Child birth and care is associated with lower labor force participation among women but on average, women in accounting worked fewer hours than did men whether or not they had children.  This is not an epiphany because child care responsibilities still disproportionately fall on women.  The presence of children, however, does have a much more negative impact on hours worked for women than it does for men. The effect on hours worked diminishes by age for women – presumably because children are more likely to be older and in need of less care.  Interestingly, among younger men, the presence of children reduces hours worked (not as much as it does for women) but among older men, the presence of children is associated with small increases in hours worked.  I hope this implies larger roles in child care among younger men that will contribute to a further narrowing of the wage gap.

Impact of Children on Hours workedWages grow with age and experience (typically for most individuals into their late fifties) but among accountants with bachelor’s degrees, they grow less, on average, annually for women than for men.  The cumulative effects of hours worked, breaks in labor force participation among women for child care, and other factors can account for some of this.  But key factors that can determine how much wages grow over time (getting promotions, asking for raises, motivation etc.) cannot be discerned from the data.  If women aren’t promoted as readily or don’t seek raises as often or as large,  their annual wage growth would be expected to be lower.

The figure below shows some of the wage and salary impacts for men and women of different variables.  Interestingly, marriage seems to have a much more positive impact on the earnings of men  than it does for women,  adding $3,415 to earnings of men but just $920 for women when controlling for other variables (i.e. age and hours worked, children,  etc.).

wage and salary impacts
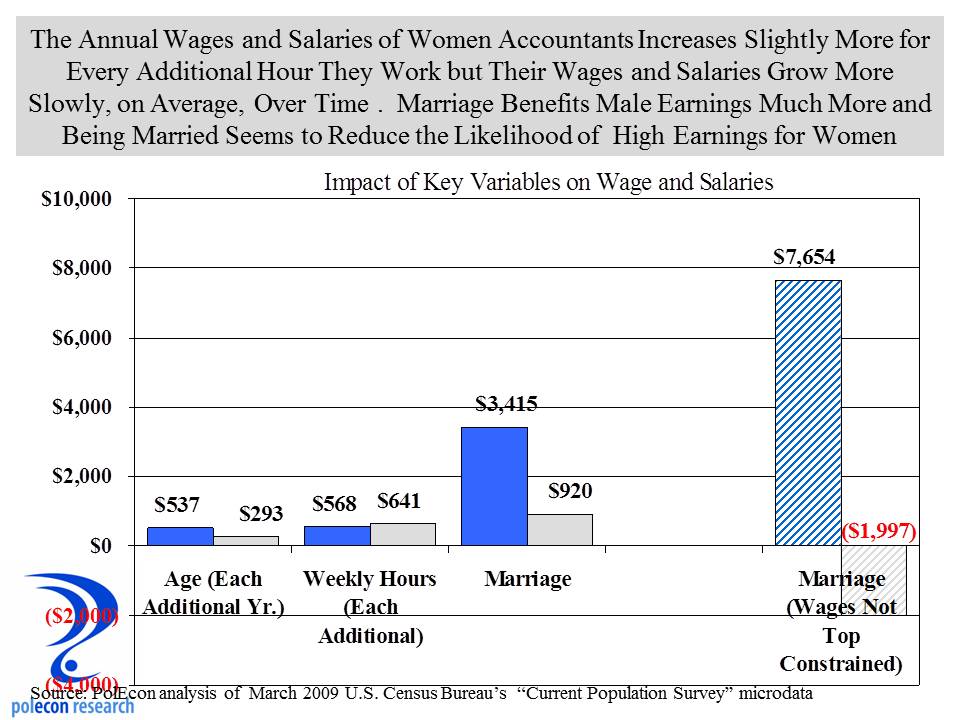
Apparently some stereotypes are based in reality and it makes me wonder what aggregate economic and societal implications this may be having as more young men seem to resist or delay marriage or long-term relationships.  The big take away for me was the impact that marriage as well as the “unexplained” difference attributable to gender had on wages and salaries when earnings were not “constrained,” meaning that the data included the earnings from the highest earners, the “outliers” or top 15 percent who earn much higher salaries than typically earned in the occupation.  For most of my analyses I selected data for individuals whose wages and salaries were between the 15th and 85th percentile of all earners among accountants.  But I also ran the same analyses using data that was not constrained at the top of the earnings scale.  This would likely include business owners and individuals in higher level positions.   When data was not constrained based on wages and salaries, the impact of marriage on the wages and salaries of women was significantly negative in contrast to the wage and salary constrained data where it was positive (albeit a much smaller relationship with earnings than for males).  The unexplained difference attributable to gender was also disproportionately large compared to the constrained data set.  What this says to me is that the largest evidence of a gender wage gap occurs at the upper end of wages and salaries and may be more attributable to lower percentages of women in higher positions (a “glass ceiling” effect) than a paycheck fairness effect.  Does this mean that women are at a disadvantage in becoming high earners if they are married, and if so, is it the result of personal choices or does the labor market systemically punish them relative to men?  Does being married necessarily mean that a woman will be less likely to rise to the top of their occupation?   These results do suggest a glass ceiling that contributes to the wage gap and this should trouble all fathers of daughters, brothers,  husbands and even friends.  Unfortunately, it doesn’t say much about what we can do about it.

We do have laws that prevent wage and salary discrimination based on race and gender and yet the wage gap persists (even as it has shrunk).  As more women populate higher levels of occupations and organizations (it will happen as I suggest here and here and in several other posts), it is likely that whatever unexplained gender-based differences in wages and salaries (that are not based on occupation, education, experience etc.) will decline rapidly.  To me, addressing why more women don’t reach higher positions in organizations  is likely to be a much more effective prescription for whatever gender gap continues to exist than are mandates that seek to compensate for factors that we aren’t even sure contribute to wage and salary differentials between genders.

The Incredible Shrinking Labor Force

January 10, 2014

The employment growth report released today by the U.S. Bureau of Labor Statistics was disappointing for sure (74,000 job growth when 200,000 was the consensus estimate) but December employment numbers are more prone to seasonal adjustment errors because of the large amount of hiring that occurs prior to the holidays and this year presented even more issues because of the shortened time between Thanksgiving and Christmas (Thanksgiving was on the 28th, its latest possible date).  December’s employment growth may still be disappointing but my bet is that December’s numbers will be revised up in future months.  Help wanted ads have been increasing for the past six months and the labor supply/demand ratio has been falling.  Unless there is an even bigger “skills gap” than many think, that implies stronger job growth than was reported in December.

The best thing about the report was that it helps focus more attention on the nation’s incredible shrinking labor force, a problem that significantly lowers the potential economic growth of our nation’s economy.  Too many media reports on the nation’s and NH’s economy focus almost entirely on the unemployment rate.  That is especially true in New Hampshire where, because of our demographics (a lower percentage of harder to employ populations are in our state’s labor force), we always have a lower unemployment rate than the U.S.   No matter how weak job growth is in New Hampshire, many will cite our lower than the U.S. unemployment rate as a sign of economic strength.  Some reporters (hat tip to John Nolan of the Rochester Times) have avoided confusing job growth with the unemployment rate but too many in our state confuse the two.

The problem of smaller or slower growing labor force is an important and vexing one for New Hampshire and the entire U.S. A smaller or slower growing labor force implies slower economic growth because the output of the economy grows when more people are producing, when more capital (equipment and machinery) allows the same number of people to produce more, or when knowledge/technology/skill levels improve and allow greater productivity per worker. So unless productivity is increasing to compensate, a shrinking or slow growth labor force means slower economic growth.

There are several reasons a labor force can shrink or grow more slowly. Some related to economic conditions, some related to demographics, and some (such as the current situation) seem to have an unexplained element. Nationally, population trends have meant slower labor force growth as lower birth rates over the past few decades and as baby boomers reach ages where labor force participation starts to decline. NH benefited from strong population growth in the 70’s and especially 80’s and 90’s. That provided a strong boost to our economy, especially since much of that pop. growth was the result of in-migration from other states by skilled, well-educated individuals (a good characterization of our in-migrants from other states is a two wage earner, married couple family, probably both college educated with children). That migration added tremendous talent to our labor force and made NH an attractive location for many business looking to employ skilled workers.

The labor force grows or shrinks by population growth in the working age population, or by changes in labor force participation (those of working age who choose to be in the labor market or not). NH and the U.S. have seen slower population growth in the working age pop., but more disturbingly, both have seen a decline in the labor force participation rate.  Yes NH still has a relatively higher participation rate but the trend decline is similar to the U.S.  The graph below shows the decline in participation among individuals aged 25-64 (to minimize schooling and retirement decisions as possible causes).

nh us labor force particpation 25-64

If your working age population isn’t growing, having high labor force participation rates is critical for economic growth.   NH has had very high participation rates compared to the U.S. because of our favorable demographics (few people who traditionally have lower levels of participation – minorities, those without a high school diploma etc., and because our population overall has higher levels of educational attainment that is associated with labor force participation).  Women in NH especially tend to have higher participation because of higher levels of education and lower fertility rates (child-bearing lowers labor force participation).  I have written many times on gender and employment (search on gender in this blog) and the “feminization of the workforce” is a theme (non-pejoratively as the father of daughters) I believe is continuing.   As the chart below shows, virtually all of the decline in the labor force participation rate in NH is a result of a reduction in the rate among males.

male female labor force participation

Labor force participation always drops during recessions as workers get discouraged and drop out.  What is especially troubling today is that labor force participation continues to be weaker even as the economy has improved. Some has to do with demographics as more of the working age population ages into groups with lower participation rates although participation among those with higher levels of educational attainment seems to have held-up best. The best explanation of why labor force participation has continued to be lower than in the past is that the skills required by the economy have been changing, making many workers less qualified than before and creating more discouraged workers. I think that is part of the issue but I don’t think the “skills gap” could have so abruptly hit the labor market to cause participation rates to fall so much over the last half-decade. The skills gap has been a more slowly growing phenomenon.  Among older men without a post-secondary degree, participation has been declining for decades.  The skills mismatch between the supply of labor among males and the demand has been ongoing for decades.  Did it peak so suddenly in the past decade to create a permanent decline in the male workforce?  I don’t think so, additional factors are contributing.  I remember in the 70’s when the first real oil crises hit (related to Middle East wars) and a lot of job losses resulted, especially in mill towns like the one I festered in as a youth.  Someone whom I thought was wrong about almost everything said to me at that time “a man should never be ashamed of any job he takes to feed his family.”   I didn’t think much about that back then, but today it seems especially appropriate, even as it appears to be increasingly a relic of an outdated ethic.  Economic conditions today aren’t the result of people not wanting to work and a labor market where many individuals are working at jobs that don’t fully utilize their skills is not desirable.  Changes in and the performance of the economy are  obviously largely responsible for declining labor force participation.   Still, with so many troubling indicators for males  – especially younger males (educational performance and attainment, household formations etc.)  emerging over the past decade or more , I can’t help wonder how much of the decline is the result of a lost ethic among my gender.

The Coming Matriarchy in the U.S.

February 12, 2013

I received a great comment/question  about my post “Why Can’t a Man Graduate More Like a Women” asking about the potential impact of Title IX on the rise in the percentage of female college graduates relative to male college graduates.  I didn’t have a good answer or much empirical evidence then but as is my custom I responded as if I did.

Title IX is most often identified with efforts to equalize opportunities to participate in intercollegiate sports for women but its real purpose was to prevent discrimination in education based on sex.  Title IX is a portion of the Education Amendments of 1972 and is also known as the Equal Opportunity in Education Act, it said:

No person in the United States shall, on the basis of sex, be excluded from participation in, be denied the benefits of, or be subjected to discrimination under any education program or activity receiving federal financial assistance…

Rules for its implementation were finalized in 1975 and since it was implemented the number of young women attending college on a full or part-time basis has increased by 138% compared to 47% for young men.

Male Female Enrollment Growth

Since the percentage of young women and young men hasn’t changed much since 1975, the differential growth rate is attributable to increasing enrollment rates for women.   I can’t say  how much of this is attributable to Title IX, a lot of things began to change for young women in the 1970s and female enrollments jumped between 1970 and 1975 as well (see chart below).

Male_Female Pct of Enrollment

Women now comprise about 57 percent of all undergraduate students in this country.  The growth trend seems to have stabilized somewhat in recent years – recessions tend to limit employment opportunities for young men more than for young women and this can prompt greater college enrollment among young men.

Male_female Unemployment Rates

A lot of progress has been made by women in this country since 1975 but it is hard not to see the association between the growth in female college enrollment and implementation of Title IX.  I am sure some readers will note Title IX’s shortcomings and more may object on principle to anything that seeks to equalize opportunities among our citizens.  But ideology often causes temporary or permanent blindness.  I’ve noted my interest in gender issues as the father of daughters and I blog frequently about gender and economics (select  the “gender” category to see some) but the issue has profound implications for the future of this country;  economic, political, as well as social.  Women are increasingly contributing to the quality of  “human capital” in this country.  There are now more women working in New Hampshire than men.  It is a great development that would be even greater absent the disturbing trends among young men.

From a political perspective (isn’t everything political these days?) the feminization of the workforce as I have called it (not pejoratively) along with the relationship between educational attainment (college graduates) and voting for Democratic candidates should prompt leaders of the Republican Party in this country to consider their relatively lack of appeal to women, especially younger women because as I see it, and as my daughters no doubt hope, it won’t be long before women will rule this country.

Why Can’t a Man Graduate More Like a Woman?

January 31, 2013

Brains are the most valuable resource in the 21st century.  Unless your state or region sits on top of a recently discovered oil or natural gas formation, skilled, well-educated individuals are the key source of competitive economic advantage throughout the U.S..   NH’s stellar growth in a slow growth region during the 1980’s and 1990’s and early part of the 2000’s was primarily driven by the increased concentration of “talent” in the Granite State.  A great state to live and work, with access to a regional labor market with a major metropolitan area that is home to world-class companies and institutions, and facilitated by NH public policies that increased the returns to education (by allowing individuals to keep more of the fruits of the education and labor) are largely responsible.  But in NH, as in the nation, half of the population appears  not to be contributing as much as they could be to a concentration of  talent that can provide us with a competitive advantage.  Females are now both entering and graduating from higher education institutions at rates that significantly exceed those of males.  I don’t know what is wrong with young males in this country, but as the father of young females, I didn’t need to look at a lot of data to know that young males have been a disappointment for some time now.

In NH, an increase in individuals with the highest levels of educational attainment  has largely been the result of an increase in the number of females in our state with at least a BA degree.  Increasing in numbers, females with at least a BA degree in NH now comprise more than 50% of NH’s labor force aged 25-64 with at least a BA degree.

Growth in Females with BA

I am pleased that the number of women with higher levels of educational attainment in NH is increasing, but I would be just as pleased if the number of males was increasing similarly, so that the growth in “talent” in NH didn’t depend so much on just continuing the positive trends among women.  Unfortunately, it doesn’t look like that is going to happen soon.  As the chart below shows, the trends in the educational attainment of NH’s younger labor force (age 25-34) shows that the number of males with at least a BA degree has been stagnating, while the number of females has risen substantially.

Age 25 to 34 With BA

I’ve got no particular insights into reasons for these trends and I have no direct experience with the decision and thought processes of  young males,  for most of the past several years its been my job to hate them, but  I could probably overcome some of that if they started contributing more to the concentration of skill and talent among us.

Entrepreneurship and Gender Equity

January 16, 2013

I’ve written a couple of times (here and here) about gender equity issues in employment and unemployment.  I have an interest in almost all labor market issues but on this one I have three terrific and personal reasons for my interest.  One of them is a scientist in training and in a few years will be confronting the labor market issues I  examine  here.

My initial hypothesis was that larger businesses in NH would likely have more extensive policies and recruiting  efforts that would result in a higher percentage of women being employed in larger businesses in professional, scientific and technical industries in the state.  These industries include things like legal, architectural, engineering, laboratory, computer programming, accounting and scientific firms as well as veterinary services but not human medical services). As the chart below shows, that is not the case, as the smallest firms have a higher percentage of their employees who are women.   These industries also have the highest percentages of employees (male or female) with at least a BA degree.  Again, as the chart shows, smaller firms had the highest percentage of women among the employees with the highest levels of educational attainment.

Female Emp in Prof and Tech Industries

My new hypothesis is this – I don’t think (or at least I hope) that larger firms have any preference for hiring men over women.  Rather, it is that a higher percentage of the smaller firms in these industries are likely to be women owned and newer businesses started, owned, or managed by women.  I think the fact that the percentage of all women employees at larger firms, who have at least a BA degree or higher is greater than it is at smaller firms suggests that larger firms don’t just hire females predominately for lower-skilled occupations.  Women still represent a smaller percentage of graduates from many professional, scientific and technical programs (although that is changing) and thus present a smaller percentage of the potential workforce for many industries.  For smaller prof./scientific and tech. firms that are started, owned or operated by women,  female employment with the highest levels of educational attainment could, however,  be expected to be higher than at larger firms.

Anyway, that’s my story and until I get more evidence, I’m sticking to it.  More than just my interest as a parent, I think the issue has larger implications for policies to support gender equity and to increase the supply of highly skilled workers.   It may be that promoting entrepreneurship among women is among the best approaches to both.

Equity in Unemployment

November 26, 2012

I started this analysis wondering if the percentage of jobs in professional, technical, and scientific industries in NH that are held by females is greater among younger workers in the industry than older workers.  I became sidetracked by the unexpected finding that the percentage of workers in those industries is about evenly divided between men and women (and as a spoiler the percentage that is female is larger at younger age groups – consistent with my “‘feminization of the NH workforce” theme from an earlier post).  One caveat before proclaiming gender equity in professional and scientific fields, the data do not account for the specific occupations in the industries.  That is, it is possible that the conventional wisdom that women are less employed in those industries is not supported, but the fact may remain that the more professional, scientific, and technical occupations in those industries (as opposed to the management, support and other occupations) may still be dominated by males.  Unfortunately there is data from different datasets that supports this thesis, although it does appear to be changing.

The chart below shows that women comprise about half of the employment in the broad industry grouping of professional, scientific, and technical industries.

The real kicker in the data is that it shows that reductions in employment in those industries came largely at the expense of female workers.  Again, this may just be a function of the reductions in those industries occurring in specific occupations more likely to be populated by females, a viable interpretation.  It may also be related to an increase in female employment among younger and newer workers in the industry who’s employment  may be most vulnerable in a recession.  Nevertheless, such a high percentage of  decline in those industries coming at the expense of female workers is well beyond what would be expected based on probability and chance alone.

The Feminization of NH’s Workforce

October 22, 2012

Nothing gets you thinking about gender equity issues more than being the father of three daughters, except maybe being the father of four or more daughters.  In my upcoming October edition of  “Trends Lines” I am looking at trends in NH’s labor force.  One of the more significant trends is the increasing percentage of women employed at businesses in NH.  Despite the fact that men participate in NH’s (and the nation’s) labor force at higher rates (about 9% higher in NH) than do women, women now are a slight majority of employees at businesses in NH.  Women comprised 51% of employees covered by unemployment insurance during the third quarter of 2011 – the most recent data available.   Only in Hillsborough and Sullivan Counties are men a majority (and by less than 1%) of employees at NH businesses.

Among workers with the highest level of educational attainment, those with a bachelor’s degree or higher, women comprise 52% of those employed by NH businesses.   Moreover, the percentage of NH workers with the highest levels of educational attainment who are women is likely to increase because the percentage of new hires (not including recalls of  layoffs), with at least a bachelors degree, who are women, is now even higher (53% – see chart below).  These differences don’t seem large, but over time  they have tremendous implications for the economy and for society.

I don’t know if this data says more about the changing nature of the workplace or the changing nature of the male workforce, but as the father of three daughters, my anecdotal experience leads me to believe it is more about the latter.


%d bloggers like this: