Archive for the ‘Skills Gap’ category

Is Your State Overrated?

May 24, 2013

My penance (and your burden) for being an absent blogger over the past week or so is a longer post with extra graphics today.

A lot of people, including me, are accustomed to assessing the overall skill level of a state’s or a region’s workforce (and thus its potential to capture growing industries that rely on more highly educated workers) based largely on the percentage of the workforce with a college degree.  It is simple, intuitive,  and more than a  little lazy.  It is also becoming a  less useful indicator of the supply of labor that is in demand by businesses.   Populations with higher levels of educational attainment confer a lot of benefits on a state or region but today, having a high percentage of a state’s or region’s population with at least a BA degree probably says as much about the state’s political and cultural sensibilities (as well is its “demand” for services rather than its “need” for services but that is another post)  than it does about its economic performance and potential.

The sense of self-satisfaction we in New England and in New Hampshire enjoy about  having a population with among the highest levels of educational attainment in the country is palpable, but the reality is that more states are increasing their levels of educational attainment and New England and the Northeast stand-out far less than in the past.  Moreover, in an economy that is increasingly rewarding particular skills and degrees more  than  just high educational attainment, it is not as clear that much of the region still has an edge  on the one resource that  it has that is always in demand – talent.

Much of New England and the Northeast has a high percentage of its adult population with a four-year college degree or higher (see chart below).

% With BA or Higher

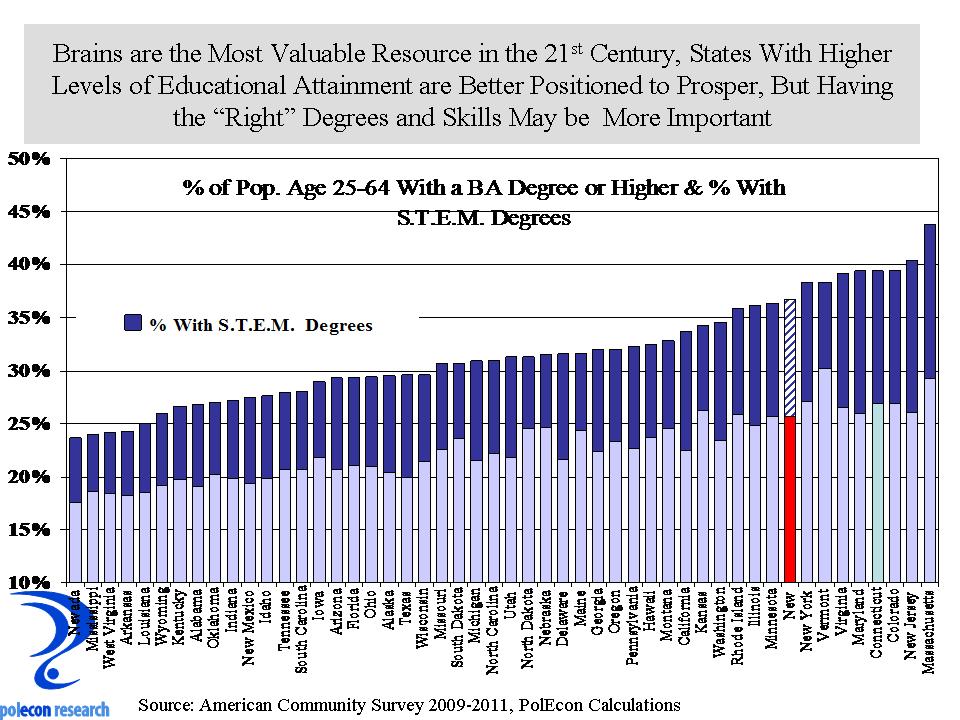
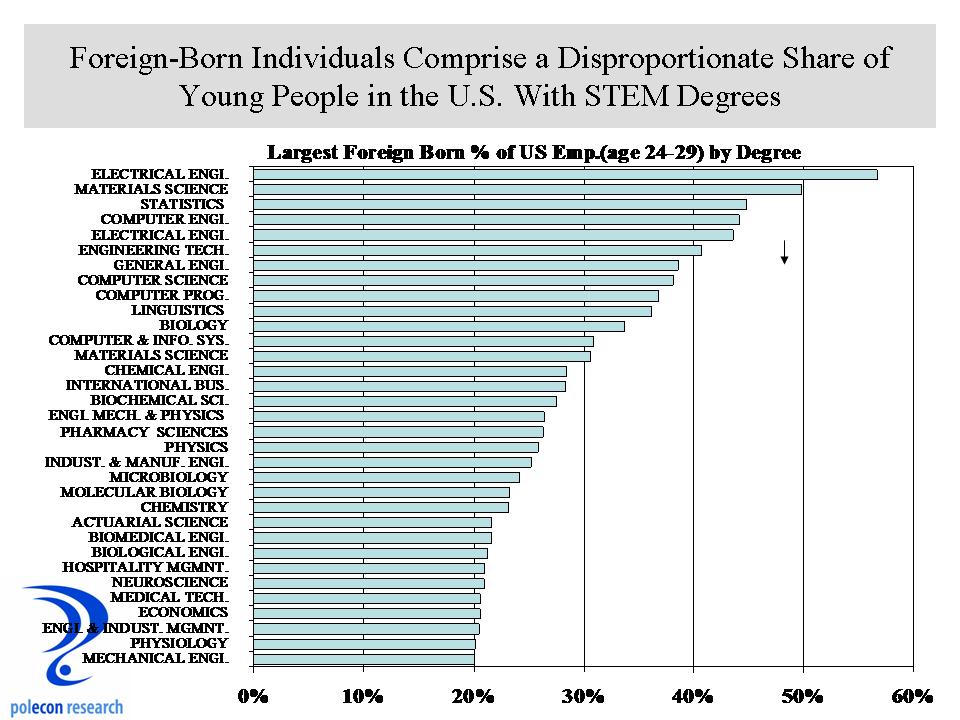
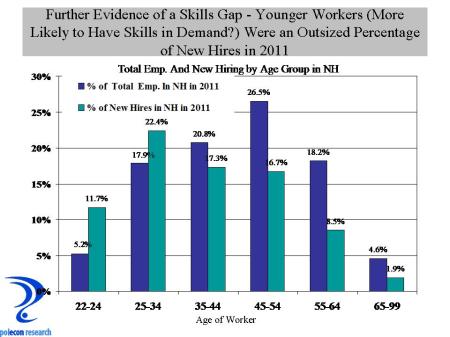
Just looking at levels of educational attainment tells only part of the story.  I can’t blog for too long without talking about the “skills-gap”  so here goes.  Much of the demand for college-trained labor is in fields that require scientific, technical, engineering,  or mathematical (STEM) skills and degrees.  The percentage of a state’s population with a BA or higher degree tells a lot about the availability of STEM skills but for a number of states it tells a lot less.  I calculated the percentage of a state’s population with a STEM degree (based on first college degree earned) and included it above as the dark blue portion of the bar graph.  The official listing of STEM fields is maintained, surprisingly, by the Dept. of Homeland Security ( I categorized 171 college degrees into STEM and non-STEM degrees and I think my listing is close but not a perfect match).  If you compare  the percentage of the population with a four-year or higher STEM degree (chart below) with the percentage of the population with a BA degree or higher (chart above) it shows a large change in the relative rankings of a number of states, and a some in New England in particular.

% with STEM degrees

The final chart makes just that comparison, it shows the change in ranking  between a state’s position on the percentage of its adult working population with at least a BA degree and the percentage of its population with a STEM degree.  The chart highlights states that may be over and underrated on the skill level (at least skills in demand) of their workforce.   Vermont stands out as having the biggest drop in rankings between the percentage of its population with at least a BA degree and its ranking on the percentage of the population with a STEM degree.  Maine also fares poorly.  But New Hampshire, Rhode Island, and Connecticut also drop in rankings when measuring “talent in-demand” among the workforce.  Only Massachusetts does not  drop in ranking  ( it is ranked number one on both measures so there is no way it could show anything but a drop in relative rankings).   On the other hand, states that are often derided by Northeastern “elites”, such as Texas, Arizona, Florida and Alabama  have a smaller percentage of college-trained labor but more of them (on a percentage basis) are trained in the STEM fields most in demand.  Still, they  don’t have as high a percentage of their adult populations with a STEM degree as do some New England and some other states, but with population and migration trends, and as more individuals with those skills and more companies that want access to them agglomerate in those states, how long before some take the lead in “talent”?   I don’t think Massachusetts has as much to worry about as do other states in  New England because of their unique higher-education assets.  The question for the rest of us is, can we continue to “beggar our neighbor” and benefit from the Bay State’s ability to churn-out and attract individuals with the degrees and skills in demand?

over and under rated states

As New Jersey, New York, and Connecticut show, having a lot of “talent” in your workforce doesn’t guarantee strong economic growth.  The business, political, environmental, and even cultural and social climates also play an important role in promoting prosperity.  I look at states with a relatively higher  percentage of their college trained workforces  in STEM fields as “up-and-comers.”   Most don’t have the history of high educational attainment in their populations that New England does, so their overall ranking on educational attainment tends to be lower.  Some, like Texas and Arizona also have had a large influx of individuals with traditionally lower levels of educational attainment.  Nevertheless, they are accumulating and growing a larger portion of the nation’s “talent” in STEM fields and over the long-haul, that is the biggest threat to New England’s most valuable and most in-demand resource, and thus the biggest threat to its prosperity.

Give Me Your Huddled, Talented Masses

April 19, 2013

This is a week that reminds us of how many people from around the world  want to harm the U.S.  and just how easy it can be.  This is a day when a daughter who was supposed to be coming home for the weekend  is unable to leave her apartment, catch the “T”  or even get a cab to North or South Station where no trains or buses are leaving the city of Boston anyway.  For me at least, its not an easy time to be rationale and analytical.  That is precisely why this is an especially good afternoon to highlight, in one small way, how much the presence in the U.S. of individuals from the rest of the world contributes to our economy, communities, and society.

A lot of attention is focused on the relative inability of the U.S. to produce enough individuals with the education and training needed to fill critical  openings in scientific, technology engineering and mathematics (STEM) fields.  Why that is is the subject for another (or many other) posts.  There aren’t enough individuals in this country with STEM degrees to meet existing demand according to businesses that employ them.  Looking at unemployment rates for individuals with science, tech, engineering and math degrees seems to validate that belief.   But the U.S. would be even further from meeting the demand if it were not able to tap a global labor market.

I’ve been looking at trends that affect recent college graduates so I will focus on the importance of foreign-born individuals to the supply of skilled workers among recent college graduates and younger workers in the U.S..  I sorted data on individuals in the U.S. workforce,  age 24-29, with a Bachelor’s degree or higher, according to the college major of their first college degree, and then by the percentage of individuals in each major that were foreign-born.  The results are striking.  Overall, about 13.6 percent of all workers age 24-29, with at least a Bachelor’s, are foreign-born.  However, the percentage in STEM majors is dramatically higher, comprising  30, 40, to as much as 50 percent of young people and recent graduates in some major fields of study.  By far, the majors with the highest percentage of individuals that are foreign-born are STEM majors.

Foreign Born STEM Grads

The data make clear how important the rest of the world is, and will continue to be, in meeting our economy’s demand for skilled workers.  On an afternoon, in a day, during a week, like this one, data doesn’t have much influence on our thoughts or maybe just not on mine, and that is all the more reason to look closely at it.

What Do Help Wanted Ads Say About the “Skills Gap”?

April 18, 2013

It has been quite a while since I wrote about some of my favorite topics, the “skills gap” and occupational supply and demand.  But since there are recent media reports about the issue and more and new or renewed groups in NH looking to influence the debates and discussions on the issue, let me once again add my $.02.

I’ve made the plea for empirical rather than anecdotal or ideological evidence on the issue and produced a little evidence myself that both points to a skills gap as a contributor to slower than desired employment growth as well as evidence that suggests the issue may not be as prominent an explanation for slower job growth as some believe.  I’ve also noted the larger economic policy debate that engulfs the skills gap issue.  The data I’ve presented in this blog only hints at  answers to the fundamental question of whether slower job growth is more of a problem of labor supply (the number and/or quality available workers with the education, skills and training desitred by employers), or one more of labor demand (not enough employers looking to hire qualified, educated and skilled workers in NH).  I think the charts below  again provide some clues to labor supply and demand trends in NH and also illustrate some bigger trends in the NH economy.

The first chart most directly addresses the skills gap issue.  It shows that in terms of broad occupational groupings, professional and technical job openings are the largest component of on-line help wanted advertisements in NH.  Because these tend to be among the most-skilled and highest-paying jobs we assume that if there were a sufficient supply of labor then job growth in the industries that most employee these occupations would be relatively strong.  In fact, one  industry grouping – business and professional services  – employs a lot of professional and technical occupations and it is growing almost twice as fast as is overall private sector employment in NH.

The crux of the skills gap issue is this: “would a larger or better qualified supply of individuals in these occupations result in faster job growth in NH, or are there other or complimentary factors that also need to contribute to faster growth?”   How you define the problem of slower job growth also largely defines the range of your solutions. Increasingly, and I think somewhat disappointingly,  it also seems to define your ideology (if you have one).

March 2013 HW

The chart  below is less sanguine.  It shows that compared to the same month in 2012, March 2013 help wanted ads in NH for professional and technical ads declined by more than 10 percent.  One month isn’t a trend but recent months have shown more weakness than strength in this indicator.  The chart also shows that the largest improvements in labor demand are not among the most skilled occupations, although changes in the occupational make-up of manufacturing industries makes it increasingly likely that production workers will  have higher levels of education, training and skills.

Pct Change in HW in March


It Seems You Can’t Turn White Collars Blue

January 8, 2013

Two contradictory trends are occurring in NH’s labor market and as Ricky Ricardo would say “somebody’s got some splaining to do”.   I see no other hands up in the room so I will take a brief stab at it.  The chart below shows that help wanted ads in NH rose modestly this year but the rate of employment growth in the state has been declining.

Help wanted and Emp Growth iin NH

It is easy to rest things on, and to take things off, the top of a flat head so here are a few off the top of mine that could be influencing these trends: 1) It could be that more jobs are being advertised in NH but are for companies with multiple locations – including NH and nearby states (I think this is not likely to be having much affect), 2) advertised jobs are not being filled because there are not enough applicants companies want to hire – “the skills gap” again (I think this is significant based on conversations I’ve had with companies), 3) the job growth numbers in NH could be revised upward with the upcoming benchmark revisions (I think this is likely but it may not be as significant as I thought a few months ago).

Regular readers know I write too often about the skills gap.  I like the issue because it gets at so many issues of fundamental importance to the future of NH’s and the nation’s economy – education and training, k-12 and post-secondary education, young people and their guidance and direction etc.  The skills gap is most often associated with very skilled scientific and technical occupations but in NH at least, any skills gap may be more pronounced in production and skilled “blue collar” occupations.  Based on the volume of  help wanted advertising in the state since the recession, the demand for those occupations has increased significantly compared to management, financial, business, technical and scientific occupations.

Help Wanted by Occup Since Recession

Despite the large percentage increase in help wanted ads in production and skilled blue collar occupations, employment in industries that employ those occupations has grown little.  It may be that there is a lot of ‘churning” in those industries (some businesses hiring and some contracting) resulting in little net employment gain but the anecdotal evidence (I am reluctant to rely on such evidence but it is the best we have at the moment) is that many businesses who would hire production and skilled, blue collar workers are unable to find individuals to fill their positions.

It has been a relatively recent (over the last several decades) transition for NH to a more technology intensive economy that relies less on production and skilled, blue collar labor.  Once the core of the NH economy it has been a long while since NH was seen a a land of opportunity for those who worked with machines and tools (other than just  computers) and once you have moved on  it can be very hard to go back – even when there is a reward for doing so.

The Most Important Ideological Debate of 2013

January 2, 2013

It is hard to fix a problem that you don’t  know you have.  That seems to be the case in NH where I still hear “NH has fared better than most states since the recession.”  I disagree and the U.S. Bureau of Labor Statistics is on my side.   Just before Christmas the Bureau of Labor Statistics issued its  monthly report on November employment and unemployment in  the 50 states.  Once again the news was not good for New Hampshire.  Most media reports chose to report that NH’s unemployment rate dropped slightly during the month without noting that the number of jobs located in the state declined in November (John Nolan of the Foster’s Daily Democrat and Rochester Times was a notable exception).

Nov 2011 to Nov 2012 Job Growth

Compared to employment in November 0f 2011,  November 2012 employment in NH was lower by1,700 on a seasonally adjusted basis and lower by 2,500 on a not seasonally adjusted basis.  Only five states have fewer jobs located in their state in November of 2012 than they had in November of 2011.  As I have suggested before, NH’s job growth goes a long way toward explaining why the state’s housing market isn’t seeing the same recovery in prices that appears to be occurring in many other states.

50 state Job Growth Nov 11 to Nov 12

I am hoping that in 2013 policymakers focus much of their debates (ideological or otherwise) on policies that strengthen the NH economy.  I hope that most of those debates encourage the introduction of solid empirical evidence in support or opposition to any proposals (I tried last year but could not find any data or methodology to determine the impact that allowing pistol duels in the statehouse would have on job growth) and are absent the vitriol and ad hominems that characterized so many debates last year.  Policies that can influence job growth can easily accommodate the needs of the two-party system to make the  sort of ideological arguments and distinctions that they feel are needed to influence elections.

Whether job growth is slower now than in the past because employers are not willing to add additional workers (supply side arguments) or because they are not able to find enough or enough qualified workers  (the human capital and “skills gap” argument) is among the most important issues to understand in setting both national and state-level economic policies.  If employers are unwilling to add employees that are readily available,  then the efforts to spur job growth focus more on factors affecting businesses (tax rates, regulations, costs etc.).  If job growth is constrained because employers are unable to find enough or enough qualified workers to fill open positions, then the focus of efforts to spur job growth will be more effective if they look to influence demographic trends, increase the skills of the labor force, and/or better match the skills of workers  to the needs of employers.  In reality this is not an either or question because inadequate attention to the needs of either employers or the workforce will produce sub-optimal economic growth. I’ve tried in this blog to introduce some evidence related to the human capital argument for job growth trends and I will bring some supply side evidence in the future as well.
Ideological or not, respectful and civil or not, recent trends in NH’s job growth and the implications for future growth have to be the first and most important policy debate of 2013.

Hiring by Age: More Evidence of a Skills Gap?

December 10, 2012

I know its a tough labor market for young people and recent college grads, but they still represented a larger portion of new hires in NH in 2011 than would be expected based on the percentage of employment by age in the state.  The chart below shows the age distribution of  employment in NH in 2011 along with the percentage of new hires in the state by age group.   Although job growth has been slow this recovery, the chart still shows that among those who have been hired for a new job (that is the hiring that is not a “call back” of a previously laid-off worker), younger workers make up a disproportionate number of the new hires.

Emp by age

This could be more evidence of, as well as a subset of,  the “skills gap” debate.  Many employers complain that the skills that young workers and recent grads posses don’t match their needs, and this is true for many occupations, but what this data also seems to suggest is that the mismatch between the demands of employers and those seeking work among the existing workforce is even greater than that for younger workers and new entrants to the labor force.  It suggests a bigger problem than just getting kids into the right majors and training programs (although that is a big part of it).  It points to a larger problem of a fundamental change in the types of occupations in demand (or the skills required of the same occupations) as well as a “twist” in the labor market that results in differences in the occupational make-up of industries.  It is a much more difficult , slower, and likely painful process to have the existing workforce adapt to these changes in order to increase their employment prospects than it is to begin with the next generation of workers, although both will challenge future employment and economic growth for some time.

Of course it is possible that employers just prefer younger and perhaps less expensive workers and that is what accounts for their outsized share of recent new hires.  Or it could be a function of the type of industries that were hiring in 2011 (I will be examining this hypothesis).  It may be more comforting to view labor market trends from those perspectives but it won’t get us any closer to taking the personal and policy actions necessary to create greater alignment between the skills of our workforce and the skills needed for a more prosperous economy.

Job Growth May Depend on Narrowing the “Skills Gap”

November 21, 2012

A quick review:  The “skills gap” explanation for slower employment growth this recovery posits that there are large numbers of jobs waiting to be filled but hiring is sub-par after the recession because of a lack of qualified candidates to fill those positions.  Twice I have presented some evidence on the issue, here and here.  Most of the concern and evidence about the existence of a skills gap addresses very high-skill technical, scientific, computer, and engineering occupations because our nation, and by extension our state, seem to perpetually be unable to produce enough individuals in those fields to satisfy industry demand.  As  a result we “import” a lot of that talent from foreign countries (more about this – I promise – in a future post).  There is some evidence of this in NH.  As the chart below shows, professional, scientific, and technology occupations are the largest,  broad category of help wanted ads in the state.  But they have also evidenced the smallest increase (a decrease actually) since the recession.  There is still a significant demand but it may be that an inability to find qualified applicants has companies in need of those occupations from considering more hiring in the Granite State.  A quick review of data for Massachusetts shows that demand for professional, scientific and technical occupations has increased during the same time period.

But  more direct evidence of a skills gap comes from the demand for construction and production workers.  I am especially interested in the potential skills gap for production workers.  The chart above shows that demand for construction, production, and transportation workers has increased significantly since the recession.  Although still a much smaller category of help-wanted ads than professional and technical jobs, the increased demand is consistent with anecdotal evidence I heard this week at a roundtable discussion of the Seacoast economy.  At that discussion, representatives from industry, higher education, and economic development organizations cited specific examples of companies frustrated at their ability to hire skilled production workers.   Some are forming partnerships with NH’s community college system to increase the supply of needed occupations.  Those initiatives show promise and I hope the state’s four-year colleges and universities develop more partnerships to address the skills gap in professional, scientific and technical occupations as well because, increasingly, job growth in NH appears to depend on it.

The Skills Gap Part Deux: Some Evidence and Who’s Fault is it Anyway?

November 2, 2012

A good national job growth report  was released today that showed private sector job growth was up 184,000 in October.  With government job losses at -13,000, total employment increased nationally by 171,000.   We  have to wait a few weeks to see NH’s job growth for the month but regardless of the number, the underlying causes of the state’s relatively slow recent  job growth still need to be debated .  A solid and empirically-based understanding of the  factors influencing job growth rates is the only way to formulate effective economic  policy in the state.  I am on record as saying (probably too often) that I believe NH’s job growth numbers will be revised upward at some point (probably with the annual revisions released early next year).  But even if that is true (errr, when it is conformed to be true),  by historical standards, recent job growth in NH will still have underperformed.   Whether job growth is slower now than in the past because employers are not willing to add additional workers or because they are not able to find qualified workers  (the “skills gap” argument) is among the most important issues to understand in setting both national and state-level economic policies.  If employers are unwilling to add employees that are readily available,  then the efforts to spur job growth focus more on factors affecting businesses (tax rates, regulations, costs etc.).  If job growth is constrained because employers are unable to find qualified workers to fill open positions, then the focus of efforts to spur job growth will be more effective if they look to increase the skills of the labor force, and/or better match them to the needs of employers.  In reality this is not an either or question because inadequate attention to the needs of either employers or the workforce will produce sub-optimal economic growth.  But in today’s polarized policy environment whatever light is shed on these issues is too often separated by an ideological prism that produces policy proposals aimed at either the needs of business or the needs of the workforce to the exclusion of the other.   If job growth is slowed because there are too few qualified workers to meet the needs of businesses then it is not policy maker’s  fault  but they can help alleviate the problem by adopting more “human capital” policies.  Businesses bear some of responsibility for any skills gap because studies have shown that businesses spend less time and money training workers than they did decades ago, and that more of the training that does occur is concentrated on management positions rather than mid- and lower- level positions.  In an age when job turnover has accelerated, and the tenure of workers with one businesses continues to decline, it is understandable that businesses would be less willing to invest in workers who may only be with their firm for a short while.  But who is more responsible for the decline in employer-employer loyalty and tenure?  The labor market has been signaling strong demand increases in many occupations – especially technical and scientific  occupations and increasingly skilled production occupations.  Older and experienced workers may have difficulty responding to these demands if their experience, education or training is in occupations in less demand but why are younger and new entrants to the labor market not responding  to these labor market signals by selecting the majors or training programs that would qualify them for more occupations in demand?  One reason is that regardless of whether or not the labor market is signaling many job opportunities in technical and scientific occupations (or skilled production occupations), if large numbers of the emerging workforce don’t have the intellectual and academic rigor to study these subjects the positions will increasingly go unfilled, go elsewhere, or as I will document in a later post, be filled by foreign born workers.

Ok, that was a bit of a rant, now back to the core issue.  Is there evidence of a skills gap in NH that is constraining job growth?  The answer of course, as it is with almost all economic issues,  is both yes and no and also something in-between and with a twist.  I will share this evidence across several postings, today I offer one, small bit of evidence that suggests the skills gap is playing a larger role in disappointing job growth trends.  I noted in an earlier post that help-wanted advertising has generally been on the rise in NH, while job growth has not.  Some of this will be corrected with job growth revisions, but evidence that a skills gap is playing a role comes in the form of the percentage of help-wanted ads each month that are “new ads”.  If help-wanted ads are rising and the number or percentage of new ads is rising similarly each month,  that means positions are being filled at a fairly consistent rate, but if the number of ads is increasing, but the percentage of ads that are “new ads” is declining, that suggest that positions are not being filled or taking longer to fill – perhaps suggesting employers are having a harder time filling the positions or a skills gap.  The chart below shows that indeed, the percentage of monthly help-wanted ads in NH that are :new ads” for the month has been slowly declining, providing some small bit of support for the skills gap explanation for job growth.  A lot more evidence is needed, but given the importance of the issue in policy making, it is worth the effort to find or refute it.

The Skills Gap Debate – Round 1

October 18, 2012

Two charts may tell an important story about New Hampshire’s labor market and perhaps trends in the economy.  Help-wanted advertising has been rising in NH and as I’ve written before, it suggests job growth should be higher in NH  based on the long-term relationship between help-wanted ads and employment growth in the state.  A “skills gap” is one explanation for the divergence between help-wanted and job growth in NH, but I also offered that the divergence, along with trends in aggregate wage growth in NH  may mean employment numbers will be revised upward.   My money is still on an upward revision of job growth, with the skills gap playing an important  role for some industries and occupations, because NH has more help-wanted ads per 100 individuals in the labor force than all but 10 states – job growth should be higher (chart below).

I would be more convinced of the skills gap being broadly responsible for slow growth in the state  if a high percentage  of help-wanted ads in New Hampshire were for the highest skill occupations (professional, technical, scientific and management), but as the chart below shows, NH ranks well down the list of states on the percentage of help-wanted advertising that is for the highest skill occupations.  A skills gap could still exist between available jobs and available labor for occupations requiring specialized skills and training, even if they are not in professional, technical , or managerial occupations.  Anecdotal evidence suggest many employers are having difficulty finding workers with the right skills.  The skills gap demands further investigation, right now I am more concerned about what the relatively lower demand in NH for the highest skill occupations implies about our state’s economy.

Manufacturing’s Toughest Sell

October 12, 2012

The percentage of younger workers in the workforce is declining in NH, as it is across the country, but the trends are different for specific industries and occupations (more about that in a later post).  Simply put, some industries are capturing a larger share of a smaller cohort of younger workers and the key for any industry or occupation is to have appeal for younger workers and students.  How does an industry capture more younger workers?   Is it because the industry is perceived as being desirable or “cool,” or do younger workers respond to signals about the opportunities in an industry or an occupation?

Manufacturing is one industry that has been capturing a smaller share of younger workers (government and utilities are others).   The chart below shows that over the past 15 years the share of younger workers (age 25-34) declined in NH’s workforce (age 25-64).  But the chart also shows that the drop was more pronounced in manufacturing than in the workforce overall.

Government employment hasn’t been perceived as cool for some time but job opportunities have grown or remained steady (except in very recent years) over the years suggesting that “coolness” is a factor in the career choices of younger workers.  For manufacturing it is likely to be a combination o cool and opportunities.  While manufacturers now have good opportunities for young workers, that perception must overcome  decade s of    labor market signals showing large declines in manufacturing employment.  The decline in younger workers in manufacturing roughly corresponds to the change in manufacturing employment in the state (chart below).

Manufacturing employers are in a difficult position.  Fewer households have workers with a history of manufacturing employment, limiting the legacy effects that can contribute to career choices.  A “twist”  (changing occupational makeup) in the manufacturing labor market mean that much of the public and almost no  high school guidance personnel have an understanding of the types of jobs in manufacturing. A general lack of “coolness,” perceived lack of opportunities, and  limited understanding of the opportunities that exist in the industry all mean that manufacturing will have a tough time capturing a larger share of the younger workforce, but it is important to do so for a number of reasons. I just don’t know if manufacturers can do it alone.


%d bloggers like this: