Posted tagged ‘NH’
January 9, 2013
It is no secret that the price of electricity in New Hampshire in relation to prices in most of the U.S. is high. That is true for all types of consumers of electricity, residential, commercial, and industrial, but prices for industrial customers were especially high compared to prices across the country. New England is known for high energy prices but New Hampshire’s electricity prices compare more favorably to the region than they do to other regions and states. Industrial consumers of electricity in NH, however, seemed to pay relatively higher prices in comparison to industrial consumers across New England. Over the last half of the past decade that changed. Either because of competition for industrial customers, special rates, or other reasons, the relative price of electricity for industrial customers in NH fell significantly in relation to average prices in New England and are now (through 2011) just below the regional average. For residential consumers price trends are different. Compared to the New England average, prices per kwh were relatively low for NH’s residential consumers, but they have been rising and are now (through 2011) just above the New England average.

The price competition that has benefited industrial consumers of electricity in NH is likely partially responsible for the rising prices and higher relative prices facing residential customers. Prices for residential consumers seemed to rise more just as prices for industrial consumers fell. As a result, as is being reported in a number of media outlets, competition is becoming more robust in NH for residential consumers of electricity. That will eventually result in lower or more slowly growing average electricity prices for NH’s residential customers. Competition does lower prices but it will only do so for those who actively participate in the competitive market. Just like a car dealer, electric utilities will look for someone to pay the full “sticker price” for every consumer who gets a “deal”.
Categories: Electricity, Energy, New Hampshire, prices
Tags: competition, consumers, Electricity, NH, prices
Comments: 2 Comments
January 7, 2013
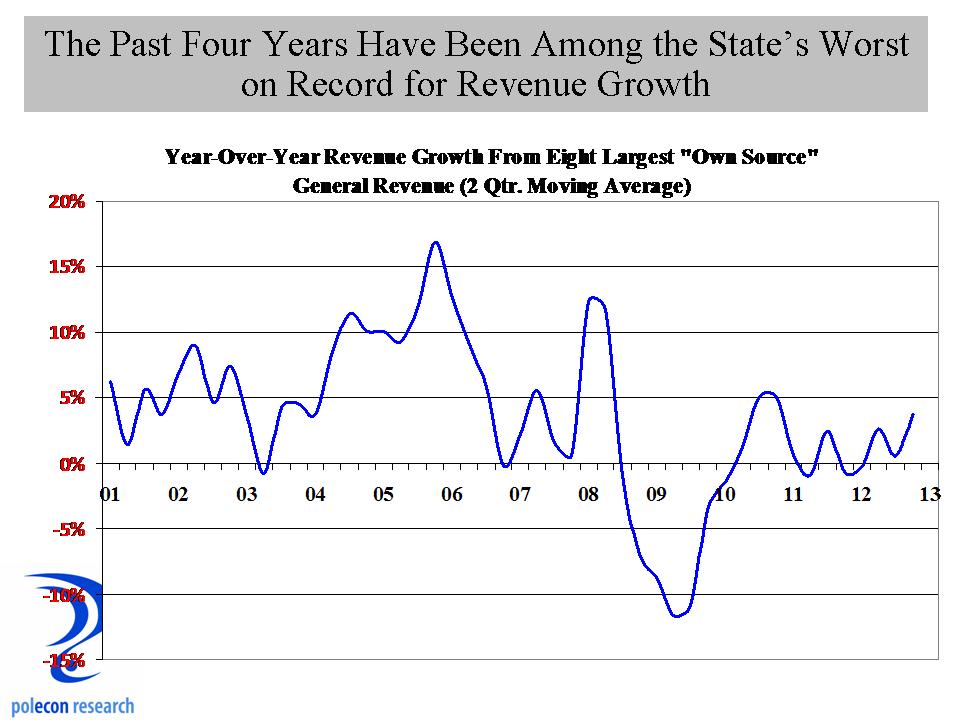
Tomorrow I will have the opportunity, along with several people a lot smarter than me, to address the NH House Committee on Ways and Means to talk about some of the forces and factors affecting revenue growth at the state level. I’ve forecasted (pretty accurately I think) the impacts of policy changes on state revenues for a number of clients and projects (here is one example I’ve written about in this blog). Things like energy and gasoline prices that affect the disposable income of NH residents and the willingness of out-of-state residents to travel to NH for recreation or shopping (energy prices can affect the price differential calculus for an out-of-stater coming to NH to purchase goods or avoiding travel costs by purchasing higher-priced goods in their home states) are just a couple of examples that can make the difficult task of revenue estimation that much more difficult for NH lawmakers. It’s a tough and thankless job and if I can help I am happy to. It is especially difficult these days because the news on revenues is rarely good, as the chart below shows, year-over-year quarterly state revenue growth ( from the state’s 8 largest “own source” revenues) has performed more poorly, for a longer period of time, than at any time over the past decade.
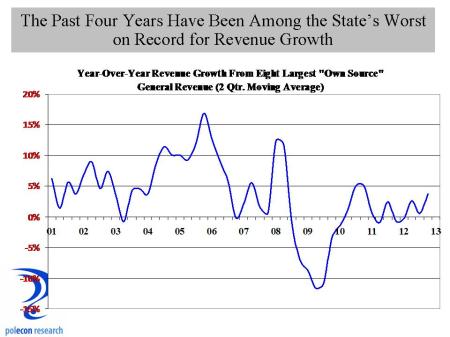
Some policy actions contributed to that (the decrease in the cigarette tax is an example – although that was only a small contributor to slower revenue growth) but the biggest reason is weak economic and job growth.
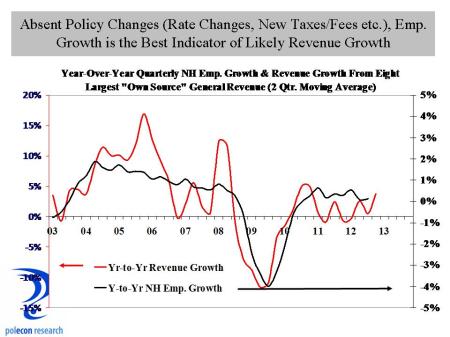
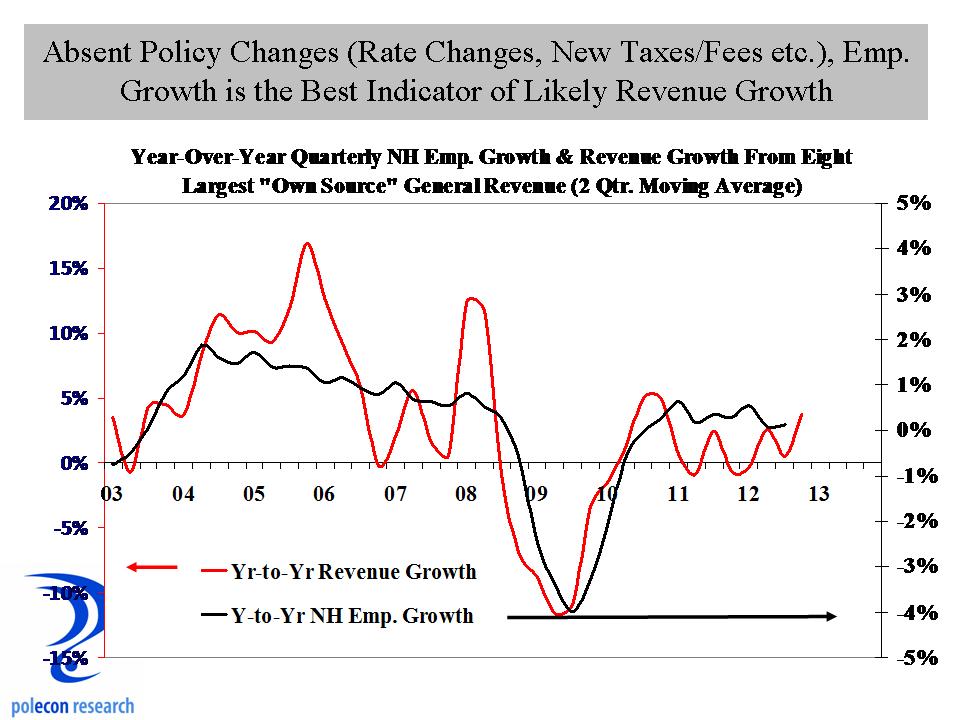
Tomorrow I will present a number of charts and talk about a number of factors that influence various revenue sources but the bottom line is this: until we have more than tepid employment growth, revenues aren’t going to grow significantly and forcing them to grow (via a major policy change) will not contribute to stronger job growth. That isn’t the same thing as saying “any policy change (rate adjustment etc.) will harm job growth and revenue growth in the long run.” NH’s unique fiscal system has survived far longer than many thought possible (and longer than many wanted it to survive) because of balance – those on the left of the political spectrum had to be satisfied with the state doing what it “needed to do” rather than what it “wanted to do” and those on the right had to be willing to allow for some adjustments in tax rates and revenues to keep call for major policy changes at bay. I think that worked pretty well for a long time but it only works when their is a modicum of flexibility and compromise in the policymaking process. That, in fact, may be the best estimator of revenue growth moving forward and you don’t need an expert panel of wonks and nerds to tell you that.
Categories: Fiscal Policy, job growth, Tax Revenue
Tags: fiscal policy, NH, tax revenue
Comments: Be the first to comment
January 4, 2013
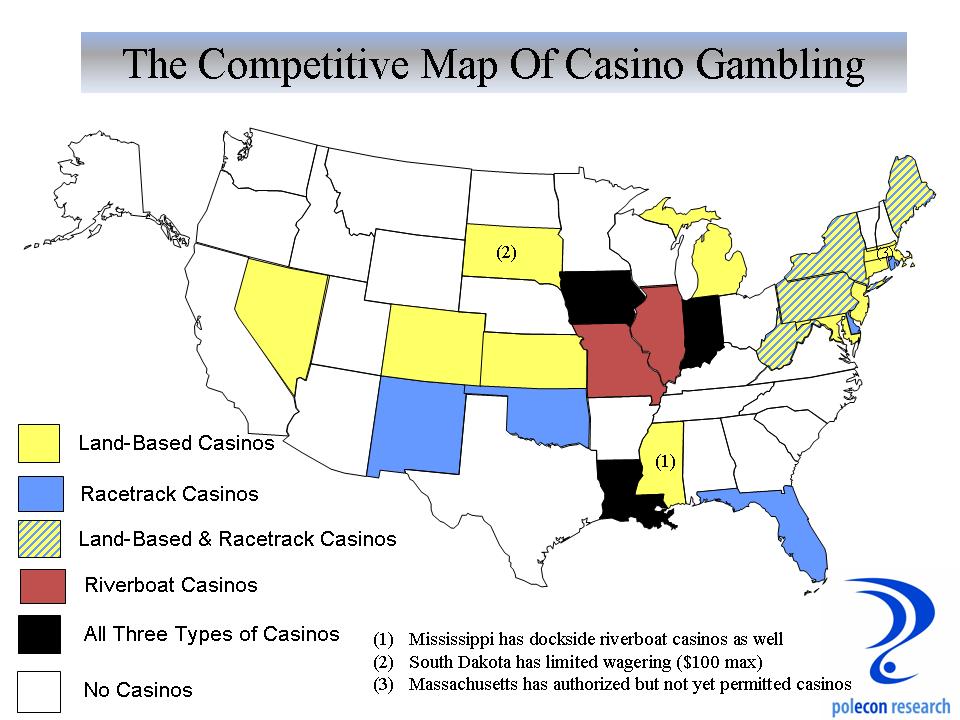
I was surprised to see the number of states that have allowed casino gambling. In a prior post I focused on what I thought were the states that are perhaps most identified with casino gambling (Nevada, New Jersey, and Connecticut). Twenty three (23) states and five since 2005 (if you count Massachusetts) now allow some type of casino gambling. As the map below shows, the Northeast region of the country is the king of casinos. I don’t know what that says about the Northeast but Vermont and New Hampshire are now the only states in the region that do not have some form of casino gambling. (a note about the data in the charts below: I have taken reasonable steps in the limited time I allocate to this blog to provide accurate information – if anything appears inaccurate please let me know).
Note: Map is Updated thanks Curtis!

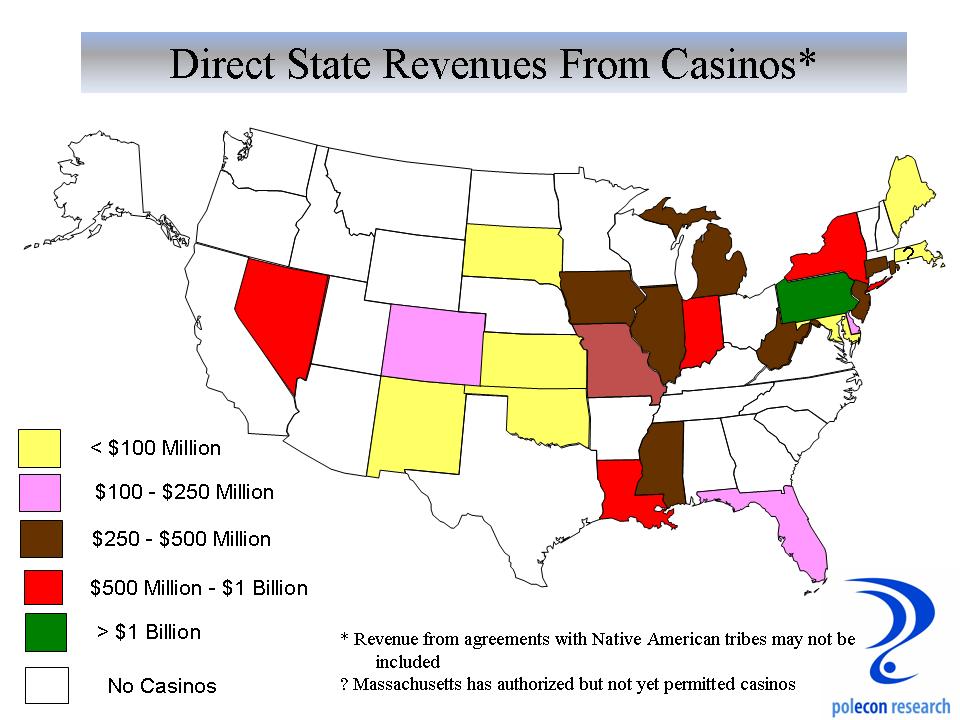
I think whether or not to become more like other states in the region is an important and ongoing debate in New Hampshire, whether it be about our revenue structure, which stands out in the region, or our political, legislative, and regulatory structures which to a lesser degree do as well. I’ve long argued that the state was able to buck the region’s unfavorable demographic and economic trends because it was somewhat unique in the region. Some who disagree with me on that argue that the state should, in the case of casino gambling, refuse to become more like the rest of the Northeast region. While others who agree with me on the benefits of NH’s uniqueness are arguing that NH should have casino gambling because other states in the region are doing it. Consistency isn’t what it used to be or perhaps I just confuse consistency with rigidity. It is also possible that I am misreading the whole consistency and change aspect of the debate. Could it be that gambling is consistent with NH’s fiscal traditions but inconsistent with its uniqueness in the region? I don’t expect there will be a lot of testimony on that at any public hearings on casino proposals. For those more interested in the pedestrian issue of how much state revenue we can expect, below is a chart that shows how much states currently take in from casinos (in very broad categories). Interesting to see that Pennsylvania is now the champion in terms of state revenues from casinos. That state is, in large part, responsible for the decline in revenues in New Jersey. Things are definitely changing in NH and the upcoming debates over whether or not to allow casino gambling will, I think, tell us a lot about the direction of that change.

Categories: casinos, Fiscal Policy, Gambling, Tax Revenue
Tags: casinos, fiscal policy, gambling, NH, revenues, tax revenue
Comments: Be the first to comment
January 3, 2013
I have been uncharacteristically and uncomfortably gloomy in my assessment of the NH economy lately, but I still hold out hope that New Hampshire’s job growth numbers for 2012 will be revised upward early in 2013 based on the volume of help-wanted advertising in the state and reported growth in aggregate wage and salary income in the state. Even if that doesn’t happen there are encouraging signs that job growth will accelerate. PolEcon’s NH Leading Index increased this month to a value of 13.0, down slightly from 16.7 the prior month, but it has registered its highest three-month reading since early in 2010. At least some uncertainty around the “fiscal cliff” that caused many firms to postpone hiring has been removed. The U.S. Treasury debt ceiling still needs to be raised this month and a repeat of the last debt ceiling antics could produce another big drop in business and financial market confidence, but overall, the national and NH economies appear poised to see accelerating job growth as 2013 progresses.

PolEcon’s NH Index of Leading Indicators is a diffusion index consisting of nine state and national indicators of economic activity designed to predict changes in the rate of employment growth in NH. When index scores are above zero, more of the leading indicators are moving in a positive direction and the NH economy is expanding. The Index has a strong statistical relationship with changes in NH employment, Index scores lead changes in the rate of NH employment growth by 3-6 months. Using statistical techniques, Index scores can also be converted into a probability that NH will be in a recession sometime within the subsequent six months.

Categories: employment, job growth, Leading Index, New Hampshire, NH Economy
Tags: employment, job growth, Leading Index, NH
Comments: Be the first to comment
January 2, 2013
It is hard to fix a problem that you don’t know you have. That seems to be the case in NH where I still hear “NH has fared better than most states since the recession.” I disagree and the U.S. Bureau of Labor Statistics is on my side. Just before Christmas the Bureau of Labor Statistics issued its monthly report on November employment and unemployment in the 50 states. Once again the news was not good for New Hampshire. Most media reports chose to report that NH’s unemployment rate dropped slightly during the month without noting that the number of jobs located in the state declined in November (John Nolan of the Foster’s Daily Democrat and Rochester Times was a notable exception).

Compared to employment in November 0f 2011, November 2012 employment in NH was lower by1,700 on a seasonally adjusted basis and lower by 2,500 on a not seasonally adjusted basis. Only five states have fewer jobs located in their state in November of 2012 than they had in November of 2011. As I have suggested before, NH’s job growth goes a long way toward explaining why the state’s housing market isn’t seeing the same recovery in prices that appears to be occurring in many other states.

I am hoping that in 2013 policymakers focus much of their debates (ideological or otherwise) on policies that strengthen the NH economy. I hope that most of those debates encourage the introduction of solid empirical evidence in support or opposition to any proposals (I tried last year but could not find any data or methodology to determine the impact that allowing pistol duels in the statehouse would have on job growth) and are absent the vitriol and ad hominems that characterized so many debates last year. Policies that can influence job growth can easily accommodate the needs of the two-party system to make the sort of ideological arguments and distinctions that they feel are needed to influence elections.
Whether job growth is slower now than in the past because employers are not willing to add additional workers (supply side arguments) or because they are not able to find enough or enough qualified workers (the human capital and “skills gap” argument) is among the most important issues to understand in setting both national and state-level economic policies. If employers are unwilling to add employees that are readily available, then the efforts to spur job growth focus more on factors affecting businesses (tax rates, regulations, costs etc.). If job growth is constrained because employers are unable to find enough or enough qualified workers to fill open positions, then the focus of efforts to spur job growth will be more effective if they look to influence demographic trends, increase the skills of the labor force, and/or better match the skills of workers to the needs of employers. In reality this is not an either or question because inadequate attention to the needs of either employers or the workforce will produce sub-optimal economic growth. I’ve tried in this blog to introduce some evidence related to the human capital argument for job growth trends and I will bring some supply side evidence in the future as well.
Ideological or not, respectful and civil or not, recent trends in NH’s job growth and the implications for future growth have to be the first and most important policy debate of 2013.
Categories: employment, job growth, NH, NH Economy, Policy, Politics, Skills Gap
Tags: ideology, job growth, NH, policy, politics
Comments: 3 Comments
December 19, 2012
I love NH’s North Country. I didn’t grow up there but as a youth I festered in nearby state in a town along the Canadian border that also once had a thriving paper products industry and strong French Canadian accent. In my elementary school we recited the Pledge of Allegiance in both English and French.
What I love most and what distinguished NH’s North Country from others with similar geography, industry or demographics is the Yankee values of hard work, honesty, integrity, frugality, and a more intense connection to earth that so many of its residents demonstrate.
With some notable exceptions, but on balance, rural counties across the country have struggled more with demographic and economic issues than have more urban and suburban counties over the past several decades. Population and job growth trends and the demographic mix of Coos County have exposed that county’s residents to the economic equivalent of the “trials of Job” in recent decades. Thus I expected that data on delinquent debt by county would show Coos County residents to be far more likely to be behind in debt payments than most other counties in NH. In fact, as the chart below shows, at the peak of debt delinquencies in the country (Q4 2010), Coos County had the lowest percentage of debt that was 90 or more days delinquent (summing the percentage of auto loan, credit card, and mortgage debt that was 90+ days delinquent).

Whether it is the Yankee values of “living within your means,” or doing whatever it takes to honor obligations, it surely wasn’t a robust economy and strong income growth that enabled Coos County to have the lowest aggregate severe delinquency rate. I wasn’t looking for nor did I need another reason to admire and root for the North Country, but I found one anyway.
Categories: Debt, Rural
Tags: county, debt, delinquency, NH, rural
Comments: 2 Comments
December 14, 2012
I read a story in the media today where an electric utility is justifying a large rate increase based on the notion that the price of natural gas for electricity generation has risen by 20% in the past 2 1/2 months. Hmmm. Price data for natural gas for electricity production isn’t available in NH because of the small number electricity producers means releasing it would violate disclosure regulations. Price data for the U.S. and for Massachusetts is available though, and while it does stop at the end of September 2012, it suggests that natural gas prices for electricity generation have been substantially lower for the most of the past two years. As of September 2012, the year-over-year change in natural gas prices for electricity production in the U.S. and in Massachusetts averaged -30% for the preceding 12 months. It is hard to see how a 2 1/2 month increase will negate average reductions of 30% over the preceding 12 months. But a lot of the calculations used in setting electric rates doesn’t conform to mathematical laws.

One would think years of natural gas price declines would have prompted greater price reductions if a 2 1/2 month rise warrants a large increase. Looking at price changes over the same month of the prior year year (to avoid any seasonal distortions that can occur), you can see the prices fell by as much as 40% or more in 2012. Prices do vary by state but not enough to negate these trends. Sure, prices do rise and have very recently, but not enough to offset the tremendous drop they have experienced over the past several years.

Categories: Electricity, Electricity Generation, Natural Gas
Tags: Electricity, generation, Natural Gas, NH, pewer, prices
Comments: 2 Comments
December 13, 2012
This is my second housing market crash since I’ve been in NH and old enough to know anything about them. The first was the great crash of the late 1980s and early 1990s that took with it the five largest banks in NH and many of the largest banks in New England. But that crash was fundamentally different and was largely the result of tremendous overbuilding of housing in the state and the region during the mid and late 1980s (see graph below). Even the recent crash was, in large part, the result of over-building in many of the hardest hit states like Nevada, Florida, and Arizona. Where overbuilding occurs, downturns are a more dramatic combination of excess supply and and a retreat from irrational expectations of price appreciation. Again, because NH didn’t overbuild this time, our price declines weren’t as dramatic as many areas of the country and our rebound likely won’t be as dramatic either. If values have fallen 50 percent as they did in some states, you can get pretty large jumps in appreciation quickly as things stabilize – even though a 10% price appreciation still means values are down 40%.

In NH we don’t have years of excess housing supply to work off before prices can begin to recover. This time around recovery in prices and new construction will be about the fundamentals that drive the demand for housing, population and job growth, new household formations, and the need to replace old units – I’ve noted that before (and here). I wish people would look to job growth in NH instead of what is happening to home prices in other states if they want a clue as to where NH prices are going. One of the great unknowns is whether the recent troubles in the housing markets nationally and in NH have fundamentally altered perceptions of the value and desirability of homeownership. I don’t have an answer to that but one indicator could be the percentage of new construction that is for single units versus the percentage for multi-unit structures. The chart below does suggest that the percentage of building permits for single units in NH did trend lower as the market began to decline, and is likely an indicator of developer’s responding to a lower level of demand for single family housing compared to multi-unit. Whether this is just temporary or a longer-term adjustment in the attractiveness of single family housing remains to be seen.

Categories: Housing
Tags: buiding permits, home construction, home prices, Housing, NH
Comments: Be the first to comment
December 11, 2012
I write a lot about the importance of skilled individuals with higher levels of educational attainment to the prospects for our nation’s and NH’s economic growth and prosperity. I’ve also written about how important the in-migration of skilled individuals with higher levels of educational attainment from other states to NH has been to NH’s economic success.
I know foreign immigration to the U.S. is a hot-button issue in this country and an increasingly high-profile one in cities like Manchester in NH. Whether because of economics, legitimate fiscal concerns, or simple xenophobia, for many, foreign immigration is viewed with concern, skepticism, and sometimes hostility. While some cities and school districts are more challenged by differing characteristics of immigrant populations in NH, on balance, foreign born individuals add significantly to the overall level of skill and educational attainment of the workforce in NH. The chart below shows how much higher is the educational attainment of the foreign-born workforce in NH than it is in the U.S. as whole.

Comparing foreign born workers in NH to U.S. born workers in NH shows that foreign born workers are much more likely to have a graduate or professional degree than are U.S. born workers age 25-34. Foreign born workers comprise a disproportionately large percentage of NH residents with graduate and professional degrees and that is reflected in many of the highest skill occupations in the state. Which, of course, will be the subject of a future post.

Categories: Demographics, Educational Attainment, immigration, migration
Tags: education, educational attainment, immigration, NH, workforce
Comments: Be the first to comment
December 10, 2012
I know its a tough labor market for young people and recent college grads, but they still represented a larger portion of new hires in NH in 2011 than would be expected based on the percentage of employment by age in the state. The chart below shows the age distribution of employment in NH in 2011 along with the percentage of new hires in the state by age group. Although job growth has been slow this recovery, the chart still shows that among those who have been hired for a new job (that is the hiring that is not a “call back” of a previously laid-off worker), younger workers make up a disproportionate number of the new hires.
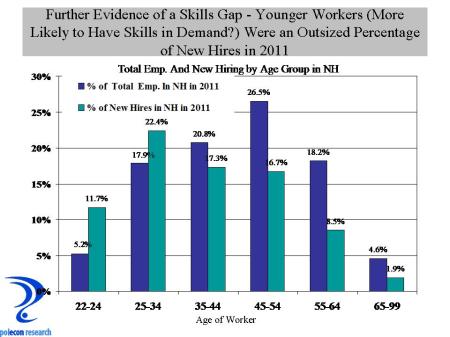
This could be more evidence of, as well as a subset of, the “skills gap” debate. Many employers complain that the skills that young workers and recent grads posses don’t match their needs, and this is true for many occupations, but what this data also seems to suggest is that the mismatch between the demands of employers and those seeking work among the existing workforce is even greater than that for younger workers and new entrants to the labor force. It suggests a bigger problem than just getting kids into the right majors and training programs (although that is a big part of it). It points to a larger problem of a fundamental change in the types of occupations in demand (or the skills required of the same occupations) as well as a “twist” in the labor market that results in differences in the occupational make-up of industries. It is a much more difficult , slower, and likely painful process to have the existing workforce adapt to these changes in order to increase their employment prospects than it is to begin with the next generation of workers, although both will challenge future employment and economic growth for some time.
Of course it is possible that employers just prefer younger and perhaps less expensive workers and that is what accounts for their outsized share of recent new hires. Or it could be a function of the type of industries that were hiring in 2011 (I will be examining this hypothesis). It may be more comforting to view labor market trends from those perspectives but it won’t get us any closer to taking the personal and policy actions necessary to create greater alignment between the skills of our workforce and the skills needed for a more prosperous economy.
Categories: employment, job growth, Labor, NH Economy, Skills Gap
Tags: age, employment, job growth, NH, Skills gap
Comments: 1 Comment