Posted tagged ‘fiscal policy’

Getting What You Want But Not What You Need

April 10, 2013

Business taxes are about one-quarter of NH state government revenues and an even higher percentage when you take out sources such as the statewide property tax which is largely an accounting fiction that really does nothing to support state services.  That is a higher percentage than any state with the exception of some states that get oil, gas and mineral extraction revenues.

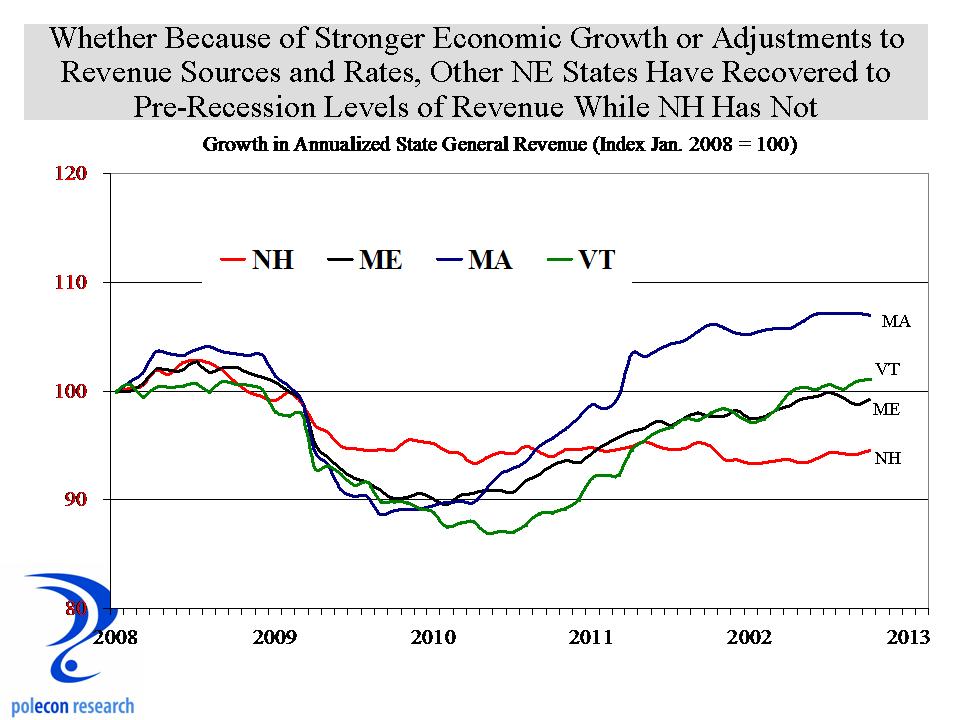
When business taxes are that important to a state’s fiscal health it better make sure that it takes care of its businesses and its business climate because if and when they go south (or south and west just as more people have) it becomes very difficult for the state to produce a budget.   The chart below shows how NH’s “own source” general and education fund revenue from the nine largest sources of revenue (exclusive of the statewide property tax) have grown comparatively since 2003.  I think the chart shows how important trends in business tax revenues are to overall revenue trends in the state.  The bad news is that revenues from the business profits and business enterprise tax are still more than 20 percent below peak.  The good news is that they are growing.

Growth in Own Source Revenue

The chart also says a few other things to me.  First, a strong and dynamic business climate is the best fiscal policy for the state.  Second, if you are going to cut business taxes you had better be certain that it is a good way produce a strong and dynamic economy because if not, the fiscal health of the state will suffer.  Third (and related), if revenues rise in response to cuts in business taxes great, it will be evidence of a stronger economy and healthier state finances, but if revenues  fall you better be sure that the service and spending reductions that result don’t affect those things that most contribute to a strong and dynamic economy because economic growth (and thus revenues) will be at risk for falling further.   All businesses want lower taxes and it that is the quickest and easiest way for policymakers to demonstrate how much they love  businesses.  But businesses also need and want a lot of other things to prosper and, like lowering taxes, they aren’t shy about asking for them.  Unfortunately, in a state so dependent on business tax revenues businesses getting what they want can sometimes make it more difficult to get what they need.

NH lawmakers, like lawmakers in most other states, want prosperity and opportunity for residents .  Most  also recognize that a strong and dynamic economy is the way to assure that.   So unless you are big financial institution, a big oil company, or just about any business or industry that is prefaced by “big,”  it’s a pretty good time to be in business because almost everyone wants to show you some love, they just can’t agree on how to demonstrate it.  Right now a lot of ideology and little evidence is being brought to bear on the question of “what policies are most helpful in producing a strong and dynamic NH economy.”   That makes it a lot harder to see that we all have a common interest in a strong economy and even more difficult to agree on what to do about it.

Funding Roads and Bridges to Perdition

March 25, 2013

Gasoline taxes, road tolls and highway infrastructure spending are issues at the forefront of a lot of heated debates in state legislatures across the country.  I am going to write about the issue a couple of times this week.   Some lawmakers want to raise sales or other taxes to pay for infrastructure and others want to increase gasoline taxes and other “user fees” to pay for it.   The highway infrastructure spending and revenue issue can illustrate classic principles of sound fiscal and economic policy so it is too bad that the debates have generally taken the “low road” by framing the issue almost entirely as either one of “who wants to raise taxes and who doesn’t,” or “who wants to makes roads and bridges safe and who doesn’t”.

User fees are a good thing and it is sound fiscal policy to have the users of roads pay for them via gasoline taxes, road tolls, and other fees that reflect an individual’s usage of roads and bridges.  When general revenues are used to pay for roads and bridges people who don’t necessarily use them wind-up paying for a portion of highways and subsidize the usage of roads of those who travel them a lot.  When you subsidize something you can bet you are going to get more of it than you would have gotten without the subsidy and in this case that means more travel on roads which, of course, means there will be more need for roads and spending on roads and that means more subsidy and that approach is surely a road to perdition.

It was nice to see New Hampshire rank high in a recent report (issue brief) by the Tax Foundation on the percentage of  highway spending that is funded by user fees like gasoline taxes, tolls and other fees.  Unfortunately, in making good points about user fees, the Foundation draws the wrong conclusion about the data it uses to make them.  That happens a lot when you use bivariate analysis to draw conclusions in a multivariate world.  Instead, using multivariate (regression) analysis on the data, it becomes clear that it is less the use of good principles of fiscal policy that results in states paying for a higher percentage of the costs of highways with user fees, than it is a function of the volume of federal government grants they receive.  So a cursory look at the Tax Foundation’s report can give NH a sense of superiority in fiscal policy over many states (while I generally think that is true about NH it is not so much in this case),  and especially over Vermont because that state funds just under 20% of its highway spending with user fees compared to NH’s 42%.  The real reason those percentages are what they are is that Vermont receives about 64% more federal highway funds per capita than does NH ($220 to $134 in 2010). The chart below shows the simple relationship between the percentage of highway spending in a state that is funded by gas taxes and user fees and the amount of federal highway funding per capita in each state.

User fees and Fed funds

States like NH that fund a higher percentage of highway expenditures with user fees do generally receives lower amounts of highway funds from the feds (the data point slope downward to the right).  There are even more intervening variables, like the amount of federal highways (by mile) and as a percentage of all highways that are in a state but still, by far, the amount of federal highway funding per capita is the best predictor of the volume of highway spending per capita in each state. The amount of motor vehicle-related user fees per capita were a distant second but still significantly related to highway spending.

Fed Highway per capita

Almost everyone agrees that NH’s (and every other state’s) roads and bridges are in need but I don’t think the debate is ever going to be about the wisdom of user fees versus general revenues in paying for highway infrastructure.  It is too bad because if it were we just might reduce the need for more spending in the future.

Striking an Economic Strategy With Maslow’s Hammer

January 22, 2013

The great psychologist Abraham Maslow is famously quoted as saying:  “When the only tool you have is a hammer you tend to see every problem as a nail.”   Maslow gave us all too much credit. When we (NH) have a hammer and know how great it is, we not only treat everything as a nail, we actually perceive everything to be a nail.  We (me included) develop a blindness to “non-nail” problems and creative problem solving takes a back seat to picking up that hammer and smashing the problem.

NH’s relatively low state and local tax burden, especially compared to other states in the Northeast, has and should continue to provide the state’s economy with significant competitive economic advantages.  In an era where “talent” – skilled, well-educated individuals are the resource businesses are most in need of, our state’s fiscal structure has been a magnet for higher-skill, more highly-educated and more mobile individuals and families.  So why does it currently not appear to be offering a competitive advantage (based on job growth and population migration data)?   The question is whether our fiscal system will be enough of an advantage in today’s economy to assure the kind of growth and prosperity the state became accustomed to over much of the past several decades.  Based on the screams of joy I heard last week, the answer for many in NH is a resounding yes.  The news that Massachusetts’ Governor Patrick is proposing to raise income tax rates in that state has been greeted by many in New Hampshire as if the cloud that is NH’s slow job growth is about to be lifted.  Once those new Massachusetts tax rates are enacted NH’s schools and students will perform better, our electricity prices will drop, our young people will choose to enroll in the  newly affordable colleges in NH,  and our communities will be safer, cleaner and offer more and better services at ever lower prices.  For too many in our state,  the future of  NH’s economy is largely determined not by what we do as a state, but by the mistakes that other states make.  I’m no Doc Rivers or Bill Belichick but I don’t think their game plan is ever solely predicated on the other team’s mistakes.   Great states, like great teams, can succeed even when the other “team”  is playing their best.

The monthly state job growth numbers for December, released late last week, continue a disappointing trend that should have NH businesses, policymakers, and citizens asking whether Maslow’s hammer is the only tool to use in shaping an economic strategy for NH’s future.

Annualized Emp. Growth

In the case of economic policy in NH, the “nail” is the high taxes which we have been pounding with our hammer for decades.  For the most part,  NH has successfully pounded that nail well below the surface.  As the chart below shows, state and local taxes as a percentage of personal income in NH are well below the U.S. and neighboring state averages.  Occasionally the nail it pops-up but is usually driven down.  Note that while it did rise for a time during the recession, this was a result of a slow and declining income growth rather than a rise in taxes.

State and Local Tax Burden

The problem is that our love of the “hammer’  as our primary economic tool appears to result in us using a longer and longer nail set in an effort to achieve the same levels of economic success as we have in the past.   Governor Patrick’s proposal to raise Massachusetts’ tax rates may benefit NH, I hope it does, but if it increases the use of our hammer, to the exclusion of other tools,  the benefits may be illusory.  A low tax burden is a great asset but the skilled, well-educated, individuals that drive economic success for the most part (it is certainly not unanimous)  also want the amenities and services that people free from want generally like to enjoy – things like good schools, civic, cultural, social, natural  and recreational amenities.  People want to pay as little as possible for these amenities for sure (and in many cases they expect them for free), but they want them nevertheless.  I think NH’s advantage is really been about providing ‘value” as much as it is about providing just a low tax burden.  As long as we can provide the services and amenities that people want, at a tax price lower than other places, we should be a magnet for the kind of individuals that will help our state thrive.

Our state’s hammer is and will continue to be a great tool, but not for every job, and not if it is used indiscriminately.  Every increase in a tax or raising of a fee isn’t an end to the “NH advantage.”  It wasn’t during the 1980’s or 1990’s when the state was growing remarkably even as taxes and fees with tinkered with (and even one or two major changes) by both Republican and Democratic administrations.  The key is knowing the true economic consequences of changes to different fiscal policies, which ones really hurt or help the economy and which ones have little impact  and by how much.

I like NH’s hammer and I have argued how it has been a great tool in helping us build a house that withstood the ill winds that blew through the Northeast region for decades.  I hope NH’s basic fiscal structure doesn’t change.  But we have become so comfortable wielding our hammer that in our casual over-reliance on it we may just be pounding on the thumbs of those who would live in the nice house with which it was built.

Ideologically Uncomfortable Economic Growth in New England

January 11, 2013

State government revenues in NH have grown more slowly over the past few years than almost every other state in New England and there aren’t any signs on the horizon that revenue will grow substantially over the next biennium.

General Revenue Growth

Some of that is the result of policy decisions that looked to reduce taxes in NH in order to increases economic growth, some is the result of other states willingness to expand or raise taxes, and some of it is the result of the fact that NH’s economy has been growing more slowly than most NE states with the exception of Rhodes Island and Maine.  How much of the slow revenue growth is attributable to a weaker economy and how much is attributable to policy changes is difficult to discern.  In some cases it is easy, the cigarette tax was reduced and produced less revenue (almost exactly the amount that I forecast) but more generally, slower growth (or declines) in revenues will occur in a weak economy regardless of policy changes.   Even without a definitive answer to that question we can still learn something from the fiscal and economic experiences of NH and neighboring states over the past few years.

Because it seems that it  is all ideology all the time in public policy debates these days, lets filter the revenue and growth debate through the ideological prism that characterizes most legislative bodies and public debate today.  For some in NH, it is bad enough that both Massachusetts and Vermont (that would be two-thirds of the Holy Trinity of New England socialism if socialists were allowed to believe in the Holy Trinity) have enjoyed stronger economic growth than NH over the past nearly two years.  But it is even tougher to accept that each of these states can enjoy faster growth than NH at the same time they are seeing stronger growth in revenues, and maybe even at a time when they took steps to keep revenues from falling too far, because to ideologues on one side, more revenue has to mean slower economic growth and the only way to get stronger growth is to cut revenues.

NE emp growth

The other end of the political spectrum will argue that the collecting more revenue has allowed these states to invest in more of what their economies need to grow, but there hasn’t been a whole lot of “investing” by state and local governments anywhere in recent years and each of these states has taken some steps to reduce the size and scope of state government expenditures in recent years.  The reality of course, as it almost always is, is somewhere in that wasteland (according to ideologues) known as “the middle”.   The stronger revenue growth of some states is largely a function of stronger economic growth and not necessarily the “investments” those revenues allowed but it can also be said that their generally higher levels of taxation have not disadvantaged their economic performance in relation to NH with its lower level of taxation.  Some of NH’s slow revenue growth is the result of policy decisions but most is related to an economy growing more slowly than neighboring states.  If there is anything to learn from recent economic and revenue trends it is that taking less in revenue  does not, in itself, guarantee stronger growth and that more revenue doesn’t always stifle (although it could) economic growth.  I know business taxes in NH remain high, but that has been true for as long as almost anyone can remember.  It didn’t keep NH from growing faster than any other state in the region for most of 30 years so I doubt it is the singular reason why we are growing more slowly now.  That doesn’t mean it isn’t an issue that should be addressed, it just means that its not likely the only answer to NH’s problem of slower economic growth.  For all of us non-ideologues, I hope lawmakers look to broaden the range of issues in the policy debates over how best to strengthen NH’s economy.

Brother (or Sister) Can You Spare a Dime?

January 7, 2013

Tomorrow I will have the opportunity, along with several people a lot smarter than me,  to address the NH House Committee on Ways and Means to talk about some of the forces and factors affecting revenue growth at the state level.  I’ve forecasted (pretty accurately I think) the impacts of policy changes on state revenues for a number of clients and projects (here is one example I’ve written about in this blog).  Things like energy and gasoline prices that affect the disposable income  of NH residents and the willingness of out-of-state residents to travel to NH for recreation or shopping (energy prices can affect the price differential calculus for an out-of-stater coming to NH to purchase  goods or avoiding travel costs by purchasing higher-priced goods in their home states) are just a couple of examples that can make the difficult task of revenue estimation that much more difficult for NH lawmakers.  It’s a tough and thankless job and if I can help I am happy to.   It is especially difficult these days because the news on revenues is rarely good, as the chart below shows,  year-over-year quarterly state revenue growth ( from the state’s 8 largest “own source” revenues) has performed more poorly, for a longer period of time, than at any time over the past decade.

NH revenue growth

Some policy actions contributed to that (the decrease in the cigarette tax is an example – although that was only a small contributor to slower revenue growth) but the biggest reason is weak economic and job growth.

NH Job and Revenue Growth

Tomorrow I will present a number of charts and talk about a number of factors that influence various revenue sources but the bottom line is this:  until we have more than tepid employment growth, revenues aren’t going to grow significantly and forcing them to grow (via a major policy change) will not contribute to stronger job growth.  That isn’t the same thing as saying “any policy change (rate adjustment etc.) will harm job growth and revenue growth in the long run.”   NH’s unique fiscal system has survived far longer than many thought possible (and longer than many wanted it to survive) because of balance – those on the left of the political spectrum had to be satisfied with the state doing what it “needed to do”  rather than what it “wanted to do” and those on the right had to be willing to allow for some adjustments in tax rates and revenues to keep call for major policy changes at bay.  I think that worked pretty well for a long time but it only works when their is a modicum of flexibility and compromise in the policymaking process.    That, in fact, may be the best estimator of revenue growth moving forward and you don’t need an expert panel of wonks and nerds to tell you that.

Can We Be Different Like Everyone Else?

January 4, 2013

I was surprised to see the number of states that have allowed casino gambling.  In a prior post I focused on what I thought were the states that are perhaps most identified with casino gambling (Nevada, New Jersey, and Connecticut).  Twenty three (23) states and five since 2005 (if you count Massachusetts) now allow some type of casino gambling.  As the map below shows, the Northeast region of the country is the king of casinos.  I don’t know what that says about the Northeast but Vermont and New Hampshire are now the only states in the region that do not have some form of casino gambling. (a note about the data in the charts below:  I have taken reasonable steps in the limited time I allocate to this blog to provide accurate information – if anything appears inaccurate please let me know).

Note: Map is Updated thanks Curtis!

 Competitive Casino Map

I think whether or not to become more like other states in the region is an important and ongoing debate in New Hampshire, whether it be about our revenue structure, which stands out in the region, or our political, legislative, and regulatory structures which to a lesser degree do as well.  I’ve long argued that the state was able to buck the region’s unfavorable demographic and  economic trends because it was somewhat unique in the region.  Some who disagree with me on that argue that the state should, in the case of casino gambling, refuse to become more like the rest of the Northeast region.  While others who agree with me on the benefits of NH’s uniqueness are arguing that NH should have casino gambling because other states in the region are doing it.  Consistency isn’t what it used to be or perhaps I just confuse consistency with rigidity.  It is also possible that I am misreading the whole consistency and change aspect of the debate.  Could it be that gambling is consistent with NH’s fiscal traditions but inconsistent with its uniqueness in the region?  I don’t expect there will be a lot of testimony on that at any public hearings on casino proposals.  For those more interested in the pedestrian issue of how much state revenue we can expect, below is a chart that shows how much states currently take in from casinos (in very broad categories).  Interesting to see that Pennsylvania is now the champion in terms of state revenues from casinos.  That state is, in large part, responsible for the decline in revenues in New Jersey.  Things are definitely changing in NH and the upcoming debates over whether or not to allow casino gambling will, I think, tell us a lot about the direction of that change.

State Revenue from Casinos

Will NH’s Fiscal System Get Better Looking Each Year?

November 9, 2012

Up close everyone sees the wrinkles, greys and infirmities that come with age,  but some things do, in fact,  get better looking with age.  Surprisingly,  NH’s revenue structure  may be one of them.  For a lot of people New Hampshire’s fiscal system has been out of balance for a long time.  I see it somewhat differently.  The state was able to maintain a fiscal structure that was unlike any other in the country.  Some hate it, some like, but one thing it absolutely most depends on is balance.  Specifically, those identifying with the left of the political spectrum had to be satisfied with doing the things that state government has to do and only a limited amount of what it may want to do.  While those on  the right of the political spectrum had to be willing to occasionally adjust the tax price of services (adjust rates and fees etc. temporarily or in some cases permanently).  Without a recognition of the need for balance from either side, the pressures from one side that were met with complete inelasticity from the other could cause the system to burst.   If NH has lost some of that balance I hope it regains it quickly because while some may see our system as flawed, it has also been a big part of our successes.

Looking toward the future, our current system is likely to suffer less from some of the demographically and economically induced changes in the growth in state-level revenues.  I don’t know if we will be the envy of other states but we should consider the impacts of the changes before walking too far down the path of big changes.  The biggest change is the fact that growth in the working age population is slowing and may continue to do so for decades (see below for NH).

That, of course, implies slower growth in wage and salary income and states most reliant on income taxes will feel that pinch the most.  On the flip side, with more older citizens, likely more income will be in the form of interest and dividends, a benefit for NH’s current system if interest and dividends tax revenue grows proportionately .  NH’s business enterprise tax (BET) depends on wage and salary payments so that revenue source would be negatively affected but because of the way the BET interacts with the business profits tax(BPT), a decline in either source is cushioned by impacts to the other source.  Moreover, as labor becomes more scare, the capital intensity of businesses should increase as businesses look to produce more with fewer people.  While the BPT impacts will be mostly neutral, it is possible that a deepening of capital in the economy could  increase in the relative profitability of businesses which would provide more lift to the BPT.

As the age structure of the population changes to include more older residents, in the aggregate, less money will be spent on the types of things subject to general sales taxes and more on goods and services that are not taxed (health care being the most notable), thus sales tax revenue growth rates could slow.  Combined with more sales occurring digitally via the internet and the generally increasing geographical separation of  buyers from the location of sellers, this does not bode well for long-term growth in sales taxes.  NH’s hybrid mix of taxes and fees collectively are likely to suffer less as a result of demographically induced changes in revenue .  As the risk of impacts is spread over a greater number of sources, any negative impacts on one source will have less of an effect than if the state relied on either of the two major sources of most other state’s revenue, the income and general sales tax.  For the most part, property taxes will also be relatively less affected by demographically induced changes.

It may not look like it now, but with the kind of balance that characterized fiscal policy making in NH for decades, and with coming shifts in revenue growth resulting from demographic and economic changes, NH’s fiscal structure  may well be better positioned to avoid the next (and inevitable)  fiscal calamity to hit states.


%d bloggers like this: