“Take nothing on its looks; take everything on evidence. There’s no better rule.”
Mr. Jaggers to Pip, in Charles Dickens’ “Great Expectations”
Optimism in the U.S. economy has been high for most of 2017. Consumer and small business confidence are both higher than they have been in a decade and according to the Business Roundtable the CEO’s of America’s largest corporations haven’t been this optimistic in eight years.
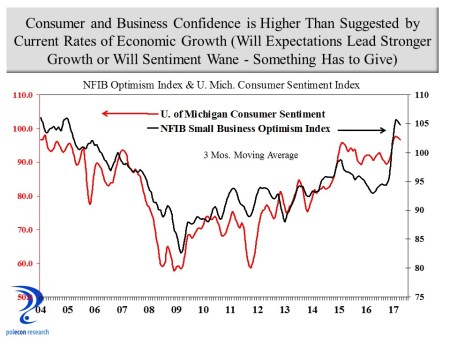
From survey data alone the U.S. economy appears to be booming. But the hard, quantifiable data (1.2 percent GDP growth in the first quarter of 2017) tells a story of more tepid growth. The degree of divergence between soft (survey and sentiment data) and hard economic data is striking and either consumer and business sentiment will lead to higher rates of growth or sentiment will begin to wane – something has to give and my money is on the latter.
The divergence between sentiment and actual economic performance can be especially problematic for lawmakers crafting state budgets. With so much economic optimism it is easy for those urging caution in budgeting (based on expected revenue) to be the skunks at the garden party. I don’t know who has the best revenue estimates on which to base NH’s next budget but the trends I see (and present later in this post) urge caution in assuming current levels of consumer and business optimism will be matched by revenue growth.
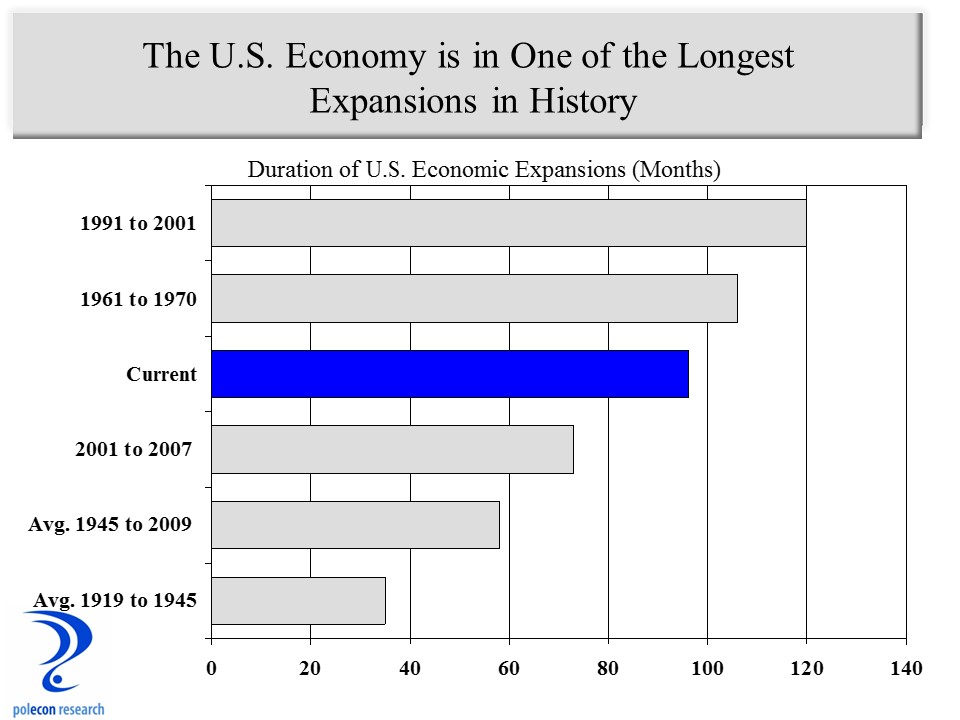
Still, the economic recovery remains on track (albeit at a modest pace by historical standards) and it has a better than 50/50 chance of becoming the longest expansion in U.S. history by lasting into the middle of 2019.

The current expansion is getting old but expansions don’t die of old age; something kills them (think the savings and loan crisis in the 1980s, the dot com bubble in the early 2000s, and the mortgage and financial crisis of the recent recession). Right now, the economy does not seem to be harboring the kinds of excesses and imbalances or overindulgence that have presaged sharp slowdowns or recessions in the past. There are some areas of concern; at more than 20 times earnings, stock market valuations (depending on which index is used) are well above the 15-17 time earnings that is the historical average, but this is not at the “irrational exuberance” stage. Economists tend to write-off or disbelieve negative economic data as statistical anomalies or due to temporary factors prior to slowdowns and lately a bit more of that has been occurring than I am comfortable with. But even as there are some unflattering economic indicators that should be acknowledged they are still too new to be trends. No one is saying the “r-word” and the best we can say today is that we are one day closer to the next recession.
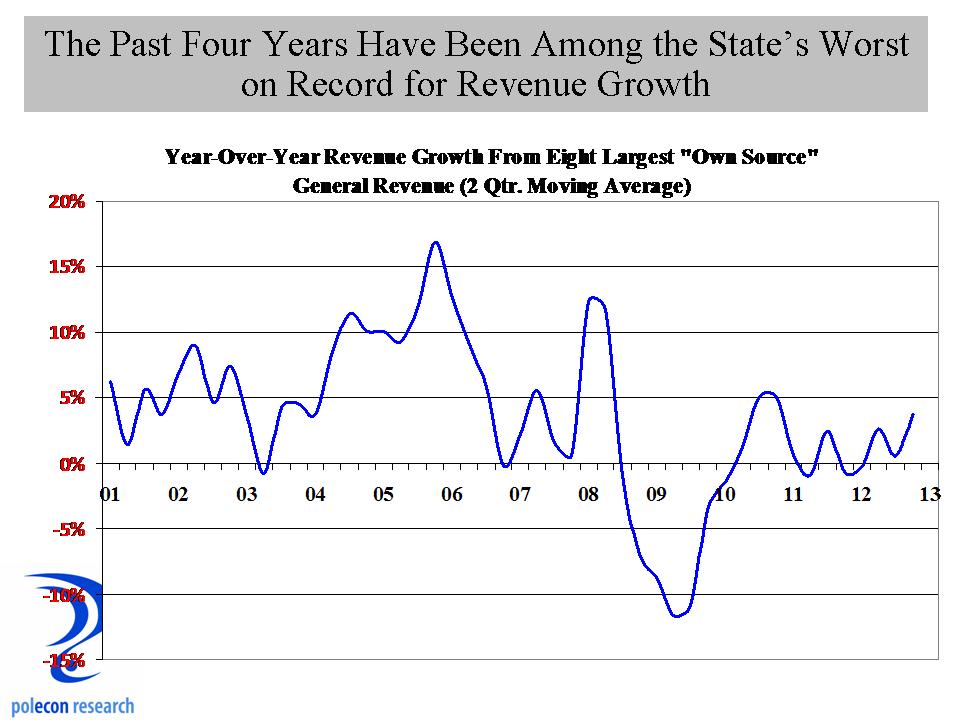
There is no more important task for policymakers than estimating revenues. Underestimating state government revenues results in more needs being unmet than is desirable, while overestimating revenues can lead to difficult and painful spending cuts in later years. So why should NH lawmakers be cautious in their revenue estimates in a time of optimism and apparent abundance? As Dickens (Mr. Jaggers) would say “take nothing on its looks; take everything on evidence.” In the case of state government revenue the “looks” are reports of a booming economy and high confidence while the “evidence” is real trends in revenue growth. Analysis and empirical evidence are not currently in favor as tools for governing, at least at the national level, but the great majority of lawmakers in NH value data and evidence and do their best to employ rigor in the budgeting process. But a focus on monthly revenue reports and numbers can sometimes make it difficult to separate the signal from the noise in the revenue trends. In addition, while it is important to note how actual revenues compare to “planned” revenues on a monthly basis, revenues can meet “planned” expectations at the same time they are signaling a weakening trend. Thus it is possible that lawmakers can be optimistic that revenues meet or exceed expectations in any month at the same time revenue growth is slowing. Which is the more important trend? When I look at the larger trends in state revenue collections from NH’s nine largest sources of own source, general revenue, I see a slowing growth trend even as revenues have generally met monthly expectations. The chart below shows the year-over-year percentage change in annualized (sum of prior 12 months) state revenue collections.

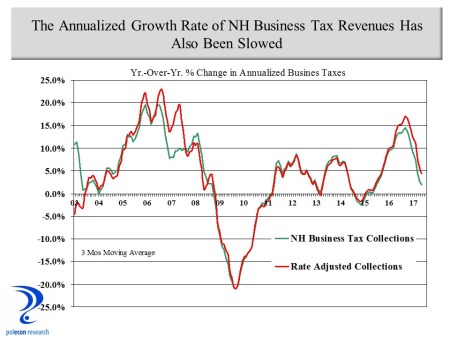
Examining NH business tax collections reveals a similar trend of a declining rate of growth. The chart below shows the rate of change in annualized (sum of the prior 12 months) business tax collections, along with the trend in rate-adjusted revenue to control for the impacts of rate changes on growth rates.
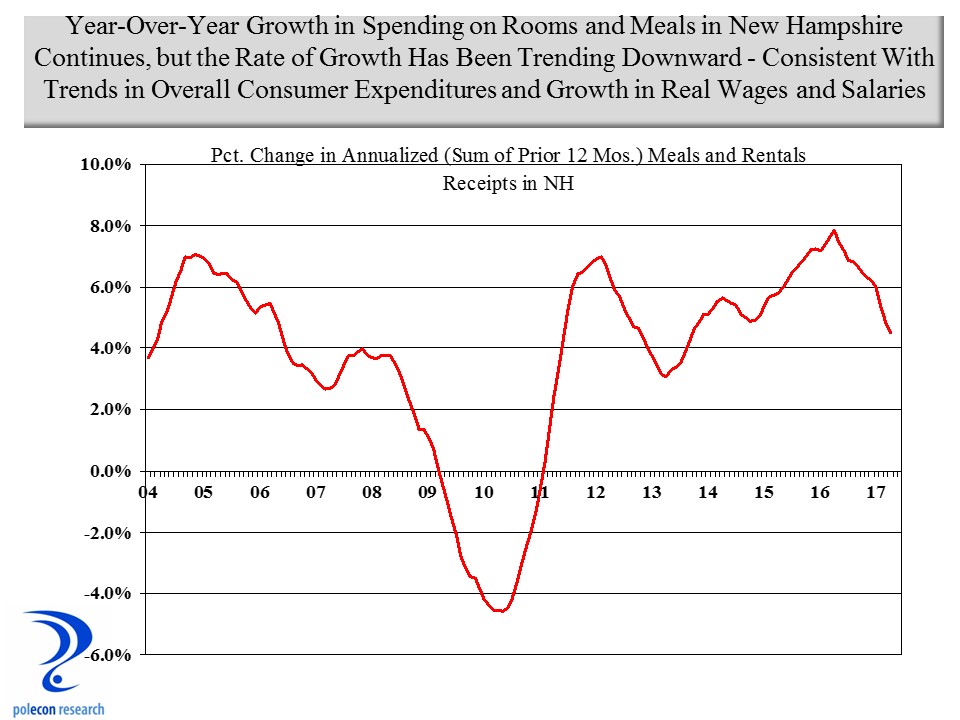
The growth rate of meals and rental tax collections in NH (more commonly called meals and rooms) has also slowed. The chart below shows annualized growth in spending on meals and rooms in NH. Because the data shows spending on meals and rooms rather than tax collections the data is free from any changes related to tax rates.
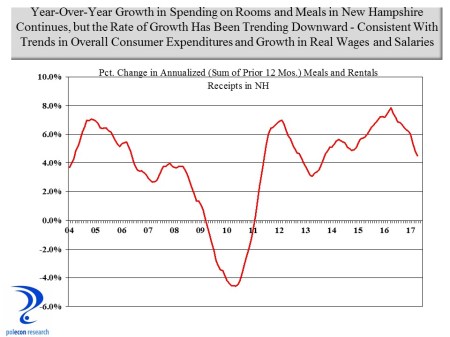
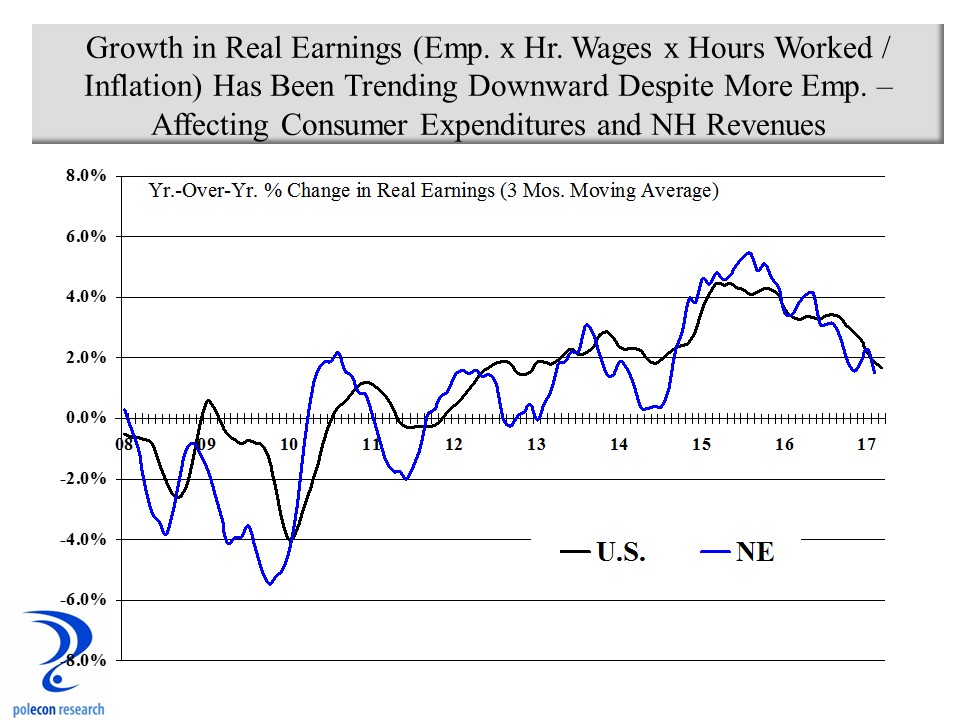
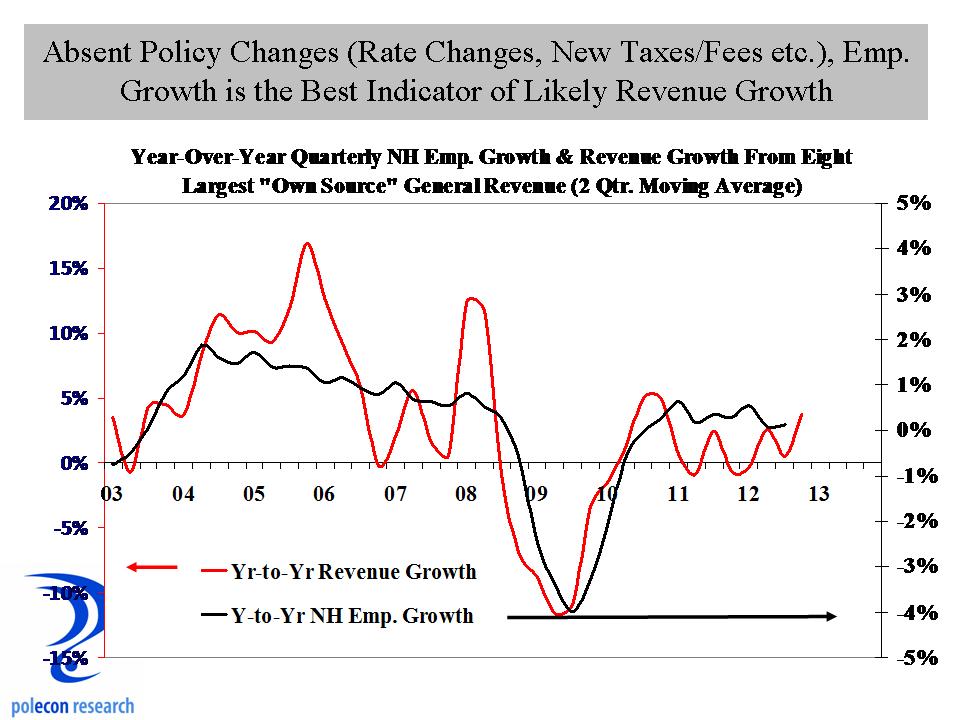
Many factors influence rooms and meals and hospitality expenditures in the short-term (weather, gasoline prices, etc.) but the most fundamental factor that determines longer-term (longer than month-to-month) trends in meals and rooms expenditures are employment and earnings trends in the state and New England region. Employment continues to grow but at a somewhat slower rate as the nation and the region confront full-employment and labor shortages. Wage growth is occurring but prices are also rising and as the figure below shows, real (inflation adjusted) earnings growth has been trending downward in the U.S. and New England (the same is true for NH). The result is that the rate of growth of consumer expenditures, in almost all expenditure categories, has slowed. The chart below presents an estimate of trends in the growth of real earnings (employment times the average hourly wage times average number of hours worked and adjusted for inflation) in the U.S. and New England. The earnings of New England residents and their ability and willingness to spend have a significant impact on several NH revenues.

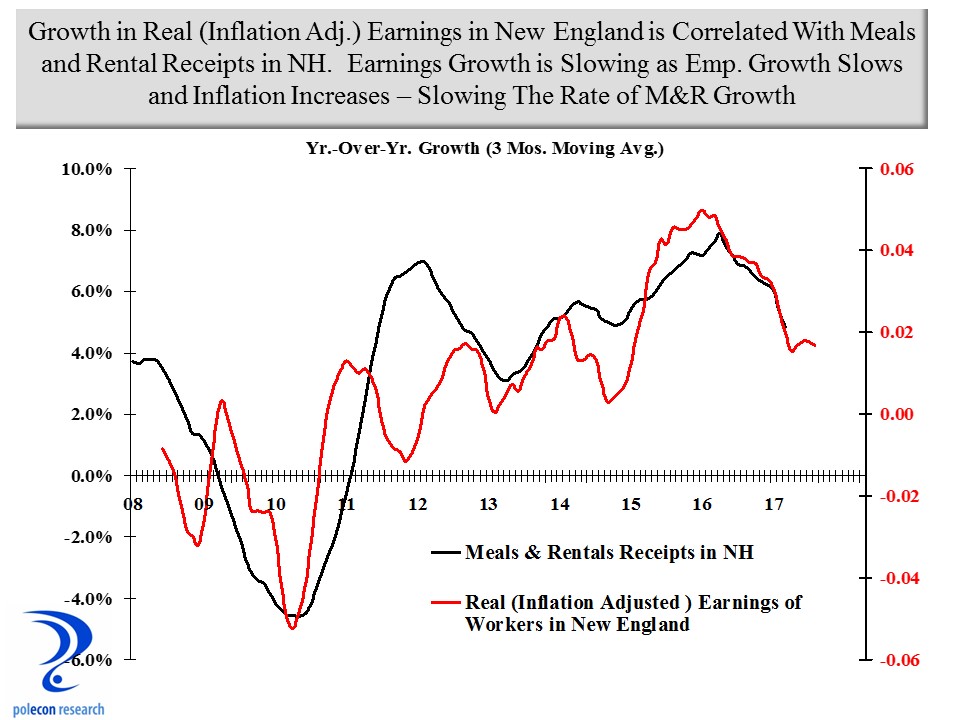
The relationship between spending on meals and rooms in NH and real earnings in New England (lagged) is evidenced in the graph below.

I don’t know who is more accurate in estimating revenues in the current debate over the state’s next budget. There is a case to be made for different expectations. As long as policy decisions are made based on some empirical interpretation of trends in the economy and revenues rather than an ideological push for more or less spending I think the state will be fine regardless of what lawmakers decide. I am frequently in error but rarely in doubt and I’ve presented one of what are many interpretations of revenue trends in NH. Despite what I see as a lot of unmet needs in the Granite State, the trends highlighted in this post urge caution in pillorying anyone who argues for fiscal restraint at a time of so much economic optimism.