The Stone Age Didn’t End Because of a Shortage of Stones

Posted January 24, 2013 by Brian Gottlob
Categories: coal, Electricity, Electricity Generation, Energy, Natural Gas, Oil, prices

Tags: , , , , , ,

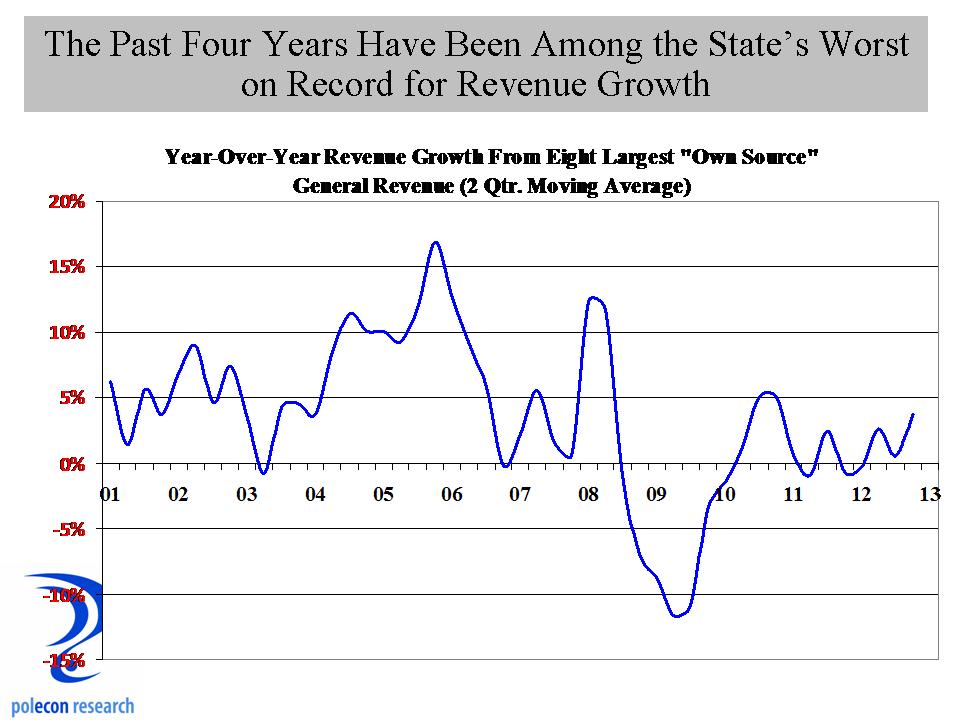
The operator of the New England power grid (ISO New England) issued a media release yesterday noting that because of the decline in natural gas prices, overall, wholesale electricity prices in the region dropped in 2012.  Reader”s” (if there is more than one) of this blog know I write a lot about energy issues and have noted the trends and benefits of natural gas to energy prices in the region (here, here, here, and here as well as in posts about other energy issues).

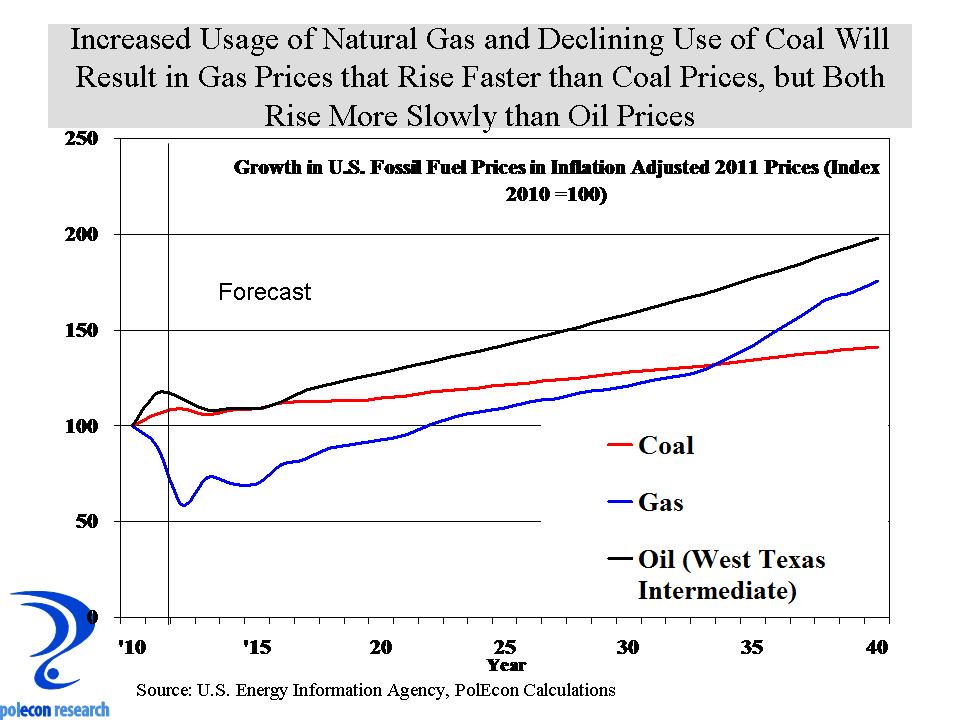
Increased U.S. production of natural gas has resulted in price declines and price declines are resulting in more fuel switching that will put more pressure on the price of natural gas unless production increases faster than increased demand.  U.S. production of  natural gas is likely to continue to increase faster than other fossil fuels (see chart below), but increased fuel switching will put more pressure on natural gas prices.

US fossil fuel production

One problem for New England is that our infrastructure for delivering natural gas to the region is the weakest of any region of the country and one result is that unless or until that changes, we won’t benefit as much as other regions from increased production.  The chart below shows a forecast of real, inflation adjusted fossil fuel prices to 2040.  Nationally, natural gas prices will rise faster than coal, but more slowly than oil.  The natural gas price trends here are for prices at Louisiana’s  Henry Hub distribution point (the reference price for natural gas prices), New England prices are higher but the question is, how much faster or slower will they grow in New England?  Improved infrastructure would help.

US fossil fuel prices

Coal is abundant and prices will grow relatively more slowly, but the economics of coal as an energy source still don’t give it an advantage over gas.  Over the next 3-5 years over 200 coal-fired electric generating plants will be retired according to a coal trade group.  They blame environmental regulations but there is more to it than that.  Besides the greatly narrowed gap in fuel costs between natural gas and coal, the fact is most people don’t want coal used, or have it used near them.  The cost of burning coal more cleanly is relatively high (it’s not just regulators that impose those costs, it’s the only way a majority of the public will support coal and if it costs too much they wont support it as long as there are more competitively priced alternatives – as there are now). Finally the cost of constructing a coal plant, compared to combined-cycle natural gas power plants is much higher (even without the new equipment required to reduce emissions) and they take longer to build 4-5 years compared to 2-3 years for natural gas, making financing of such projects more difficult.

I am not a coal hater.  Although I have worked on many more combined-cycle natural gas electric generating plants, I have also worked on two or three electric generating projects that burn coal, most recently one involving super-critical clean coal technologies and carbon capturing,  but phasing out older, less efficient, coal-fired plants makes perfect sense and can be done over time without jeopardizing the reliability of the grid if new natural-gas fired plants are built.  Relying just on natural gas doesn’t solve our  CO2 problem but it helps (ok deniers, let loose – I am a believer that CO2 is a problem that needs to be addressed).

The point of this post (by now you are probably asking if there is one) is that fossil fuels are not going away anytime soon.  Not too long ago there were apocalyptic predictions about the availability of fossil fuels in the future.  Those predictions aren’t proving accurate but at some point fossil fuels will run out.  Not in my lifetime, which is a good thing for my business as long as I still can get hired to work on natural gas or (gasp) coal-fired electric generating projects.   But more abundant fossil fuel doesn’t (or shouldn’t) lessen environmental concerns over its usage.  The stone age didn’t end because of a shortage of stones and the fossil fuel age shouldn’t wait to end until we run out of it.  Somebody will have to pay for developing new technology that ends the fossil fuel age.  Unless we start now,  the cost of the U.S. debt that we pass down to future generations will look small compared to the costs of developing new energy technologies that we will be passing down in the face of genuine declines in fossil fuels.  It is not just a matter of  increasing renewable energy,  although that will help.  Solar and wind and even hydro generation suffer from over/under demand issues.  Balancing power output to need is extremely problematic once you try to get renewable power above 20% of total generation, new technologies need to be developed.

The stone age was replaced because newer and better technologies were developed despite an abundance of stones, lets hope the same is true for the fossil fuel age.

Striking an Economic Strategy With Maslow’s Hammer

Posted January 22, 2013 by Brian Gottlob
Categories: economic development, Fiscal Policy, job growth, New Hampshire, Policy, taxes

Tags: , , , ,

The great psychologist Abraham Maslow is famously quoted as saying:  “When the only tool you have is a hammer you tend to see every problem as a nail.”   Maslow gave us all too much credit. When we (NH) have a hammer and know how great it is, we not only treat everything as a nail, we actually perceive everything to be a nail.  We (me included) develop a blindness to “non-nail” problems and creative problem solving takes a back seat to picking up that hammer and smashing the problem.

NH’s relatively low state and local tax burden, especially compared to other states in the Northeast, has and should continue to provide the state’s economy with significant competitive economic advantages.  In an era where “talent” – skilled, well-educated individuals are the resource businesses are most in need of, our state’s fiscal structure has been a magnet for higher-skill, more highly-educated and more mobile individuals and families.  So why does it currently not appear to be offering a competitive advantage (based on job growth and population migration data)?   The question is whether our fiscal system will be enough of an advantage in today’s economy to assure the kind of growth and prosperity the state became accustomed to over much of the past several decades.  Based on the screams of joy I heard last week, the answer for many in NH is a resounding yes.  The news that Massachusetts’ Governor Patrick is proposing to raise income tax rates in that state has been greeted by many in New Hampshire as if the cloud that is NH’s slow job growth is about to be lifted.  Once those new Massachusetts tax rates are enacted NH’s schools and students will perform better, our electricity prices will drop, our young people will choose to enroll in the  newly affordable colleges in NH,  and our communities will be safer, cleaner and offer more and better services at ever lower prices.  For too many in our state,  the future of  NH’s economy is largely determined not by what we do as a state, but by the mistakes that other states make.  I’m no Doc Rivers or Bill Belichick but I don’t think their game plan is ever solely predicated on the other team’s mistakes.   Great states, like great teams, can succeed even when the other “team”  is playing their best.

The monthly state job growth numbers for December, released late last week, continue a disappointing trend that should have NH businesses, policymakers, and citizens asking whether Maslow’s hammer is the only tool to use in shaping an economic strategy for NH’s future.

Annualized Emp. Growth

In the case of economic policy in NH, the “nail” is the high taxes which we have been pounding with our hammer for decades.  For the most part,  NH has successfully pounded that nail well below the surface.  As the chart below shows, state and local taxes as a percentage of personal income in NH are well below the U.S. and neighboring state averages.  Occasionally the nail it pops-up but is usually driven down.  Note that while it did rise for a time during the recession, this was a result of a slow and declining income growth rather than a rise in taxes.

State and Local Tax Burden

The problem is that our love of the “hammer’  as our primary economic tool appears to result in us using a longer and longer nail set in an effort to achieve the same levels of economic success as we have in the past.   Governor Patrick’s proposal to raise Massachusetts’ tax rates may benefit NH, I hope it does, but if it increases the use of our hammer, to the exclusion of other tools,  the benefits may be illusory.  A low tax burden is a great asset but the skilled, well-educated, individuals that drive economic success for the most part (it is certainly not unanimous)  also want the amenities and services that people free from want generally like to enjoy – things like good schools, civic, cultural, social, natural  and recreational amenities.  People want to pay as little as possible for these amenities for sure (and in many cases they expect them for free), but they want them nevertheless.  I think NH’s advantage is really been about providing ‘value” as much as it is about providing just a low tax burden.  As long as we can provide the services and amenities that people want, at a tax price lower than other places, we should be a magnet for the kind of individuals that will help our state thrive.

Our state’s hammer is and will continue to be a great tool, but not for every job, and not if it is used indiscriminately.  Every increase in a tax or raising of a fee isn’t an end to the “NH advantage.”  It wasn’t during the 1980’s or 1990’s when the state was growing remarkably even as taxes and fees with tinkered with (and even one or two major changes) by both Republican and Democratic administrations.  The key is knowing the true economic consequences of changes to different fiscal policies, which ones really hurt or help the economy and which ones have little impact  and by how much.

I like NH’s hammer and I have argued how it has been a great tool in helping us build a house that withstood the ill winds that blew through the Northeast region for decades.  I hope NH’s basic fiscal structure doesn’t change.  But we have become so comfortable wielding our hammer that in our casual over-reliance on it we may just be pounding on the thumbs of those who would live in the nice house with which it was built.

Entrepreneurship and Gender Equity

Posted January 16, 2013 by Brian Gottlob
Categories: Educational Attainment, employment, Entrepreneur, Gender

Tags: , , , ,

I’ve written a couple of times (here and here) about gender equity issues in employment and unemployment.  I have an interest in almost all labor market issues but on this one I have three terrific and personal reasons for my interest.  One of them is a scientist in training and in a few years will be confronting the labor market issues I  examine  here.

My initial hypothesis was that larger businesses in NH would likely have more extensive policies and recruiting  efforts that would result in a higher percentage of women being employed in larger businesses in professional, scientific and technical industries in the state.  These industries include things like legal, architectural, engineering, laboratory, computer programming, accounting and scientific firms as well as veterinary services but not human medical services). As the chart below shows, that is not the case, as the smallest firms have a higher percentage of their employees who are women.   These industries also have the highest percentages of employees (male or female) with at least a BA degree.  Again, as the chart shows, smaller firms had the highest percentage of women among the employees with the highest levels of educational attainment.

Female Emp in Prof and Tech Industries

My new hypothesis is this – I don’t think (or at least I hope) that larger firms have any preference for hiring men over women.  Rather, it is that a higher percentage of the smaller firms in these industries are likely to be women owned and newer businesses started, owned, or managed by women.  I think the fact that the percentage of all women employees at larger firms, who have at least a BA degree or higher is greater than it is at smaller firms suggests that larger firms don’t just hire females predominately for lower-skilled occupations.  Women still represent a smaller percentage of graduates from many professional, scientific and technical programs (although that is changing) and thus present a smaller percentage of the potential workforce for many industries.  For smaller prof./scientific and tech. firms that are started, owned or operated by women,  female employment with the highest levels of educational attainment could, however,  be expected to be higher than at larger firms.

Anyway, that’s my story and until I get more evidence, I’m sticking to it.  More than just my interest as a parent, I think the issue has larger implications for policies to support gender equity and to increase the supply of highly skilled workers.   It may be that promoting entrepreneurship among women is among the best approaches to both.

PureHost is “PureHell” and a Reprise of a Cautionary Column

Posted January 15, 2013 by Brian Gottlob
Categories: immigration, NH, Policy, Politics, populism, tea party

Tags: , , ,

Unless I send-out email notifications about posts on this blog I don’t get a lot of readers. Either I don’t have much of anything interesting to post or people have more than enough to look at without needing another nerdy economic and policy blog to read.  I’d put-up a poll to determine which is more responsible if I weren’t afraid of the results.   Thanks to my web host (PureHost or “PureHell” as I have come to know it) any email that contains a link to my or another WordPress blog is filtered from outgoing or incoming email – thus no email notices to eager readers who just need a little prompting about the “can’t live without” information in this blog.

So while I spend another day with poor tech support trying to resolve the email foible, Ive decided to reprise a column (slightly shortened) that I wrote for Business New Hampshire Magazine after the November 2010 elections.   It is a cautionary opine about the election results and in retrospect holds-up pretty well.  I liked it in 2010 and I like it as much now –  Business New Hampshire Magazine liked it so much that they stopped asking me to write a policy column shortly thereafter.

(From a January 2011 Column I Wrote for Business NH Magazine)

The  Double-Edged Sword of Populism

“Mass movements can rise and spread without belief in a God, but never without belief in a devil.”

      Eric Hoffer “The True Believer: Thoughts on the Nature of Mass Movements” (1951)

The tsunami that swept conservative Republicans into elective office this past November is due, in large part, to a mass movement called the Tea Party that shook the political ground and released seismic levels of populist energy in New Hampshire and across the country.

It’s a businesses community’s dream if the November election produces a public policy agenda of smaller government, lower taxes, and fewer regulations.  The big government, more regulation, higher spending, and bailout policies of recent years are the “devil” that unified the Tea Party movement in New Hampshire and the nation and what makes the movement’s agenda attractive to many business leaders.  But neither seismic nor populist energy is predictable, and neither has yet been effectively harnessed.

From its inception in 2009 through the November elections, what the Tea Party was against was more important to the business community than what the movement was for.  As long as the business community and Tea Party populism share as their common “devil,” big government, more regulations and more spending, then their interests are generally aligned.    But many, if not a majority in the loosely defined Tea Party movement have no love for much of the business world – big business, finance, insurance,  and multi-national companies to name a few – they just happen to dislike President Obama and most Democrats more.

What “devil” will unify and sustain the populist movement after it has vanquished Democrats and/or big government?  For businesses in New Hampshire, especially larger corporations, the stakes are large.   The anti-immigration sympathies of Tea Party populists will clash with New Hampshire businesses increasing need to hire technology workers.  The average educational attainment of foreign-born workers in New Hampshire is higher than that of its native-born population.  About 45 percent of New Hampshire’s foreign-born residents have a bachelor’s degree or higher (the second highest of any state in the nation) compared to about one-third of native-born residents. Foreign born residents in New Hampshire make up an especially large percentage (32%) of al PhD’s and young workers age 25 to 34 with graduate degrees (24%).  Thirty (30) percent of computer programmers in New Hampshire are foreign born as are 25 percent of the software engineers in the state.

Populist calls for protectionism and anti-globalization sentiments can also threaten what will be about $4 billion in exports by New Hampshire manufacturers in 2010, as well as the jobs that those sales support, up about 60 percent from $2.5 billion just since 2005,.  In addition, the New Hampshire economy relies more on foreign direct investment than all but three states.  In 2008, almost seven percent of workers in New Hampshire were employed by foreign-owned firms.

New Hampshire’s economic successes over the past several decades are the result of a transition to an innovation-dependent, technology-rich, economy that increasingly relies on workers with higher levels of educational attainment, across virtually all industries.   Research and development, strong universities, high performing schools, attracting and retaining talented employees, and a reputation for being “ahead of the curve,” all support innovation.  There are different ways policy makers can support or facilitate innovation but it is critical that they recognize its importance.

The recent election is sure to produce many spending, revenue, and regulatory policies in New Hampshire that will please most businesses.  But at least a portion of the business community should be wary of becoming a unifying “devil” of the populist movement.   Small business is off- the-hook and it is easy to see why.  Most small businesses receive no loans, subsidies or other support from the government, and relatively few sell goods and services outside of the U.S. or hire any foreign-born workers.  Moreover, most of the high-profile public policies that energize the populist movement have their greatest impacts and generate the largest costs for small businesses.  Not all Americans love businesses or even capitalism, but they increasingly worship small business, according to one public opinion poll, small business is viewed more favorably by the public than are churches.

Big government is at the top of a short list of unifying ‘devils’ needed to sustain today’s populist movement, but “big” business isn’t far behind.  While occasionally justified, in New Hampshire it would be unfortunate.  New Hampshire is home to world-class, innovative businesses whose connections throughout the world benefit the state’s economy.  Financial institutions in the state have avoided the practices that evoked populist outrage and their lending has been a key to the milder recession and stronger recovery of our state’s economy.  Only about 100 New Hampshire businesses have more than 500 employees and only 260 have more than 250 employees, but combined they employ one-third of all workers in the state.  That is far from a majority, but if a movement targets businesses employing one-third of New Hampshire’s workers, it is best described as something other than populist.

We Need Better Incentives for Households to Reduce Electricty Consumption

Posted January 14, 2013 by Brian Gottlob
Categories: conservation, consumers, Electricity, Energy, NH

Tags: , , , ,

Just like the NH and US economies are producing more goods and services with less and less energy content (as measured in BTUs per dollar of gross domestic product), so too is the NH economy producing more goods and services with the same or less electricity content.  As the chart below shows,  over the previous decade the total electricity consumed in NH (in kwhs) increased by just over 7%  while real gross state product increased over 36%.  The result is that electricity content (in terms of khws) per dollar of real NH GDP declined during the decade.

Electricity Consumption and Expenditures in NHl

Conservation and a changing industry mix have gone a long way toward restraining electricity consumption but a steep recession also contributed.  High electricity prices play a role in creating incentives for conservation but as the chart also shows, despite only a 7% increase in electricity consumption during the decade, total expenditures on electricity in NH increased by over 40% while expenditures by residential customers increased by over 50% during the decade.  Unfortunately, in a regulated market that guarantees a rate of return for some producers of electricity and which depends on variable  fuel costs, consumption of electricity and expenditures on electricity do not (for long) show the negative relationship that they do in many markets.  I think this tends to discourages household conservation efforts because they see less evidence of the payback from their efforts, even less so than say in oil and gasoline markets.  With gasoline or heating oil markets an individual or household can take steps to reduce consumption that yield tangible results in terms of reducing energy expenditures.  Reducing oil or gasoline consumption won’t always reduce absolute expenditures, as in the case of very dramatic price spikes seen in the recent past, but consumers at least see (and feel) a direct impact on their cash outlays as a result of their conservation or consumption behaviors.  But how do financial incentives for conservation affect  consumers of electricity when guaranteed rates of return allow for electricity prices that offset the impact on expenditures of their conservation efforts?   I think they produce what appears to be happening now in NH, the conservation efforts transform into just a  quest for lower prices.   Electricity consumers seek lower-cost providers of electricity who may not offer ceilings on future prices but who also don’t set a floor on prices because of guaranteed returns or because a shrinking base of customers requires guaranteed returns be paid for by fewer customers.  I am all for lower electricity prices but I get to call myself an environmentalist when I support incentives for conservation.  Such incentives will work best when they don’t yield only intermittent or temporary benefits

I don’t know whether the proposed Northern Pass Transmission Project (NPT) will actually result in lower prices for wholesale electricity or not.  I’ve seen conflicting studies from proponents and opponents (by way of disclosure I conducted a study of the NPT employment impacts for competitors of the companies planning NPT but I did not examine impacts on electricity prices nor do I have any contracts or agreements with anyone opposing or competing with NPT).  I do know that NH spent an estimated $1.616 billion on electricity in 2010 (the last year for which data is available from the U.S. Energy Information Agency).

NH Electricity Expenditures

That means if proponents of NPT are correct, and wholesale electricity prices in NH are reduced by about $25 million, and that wholesale price results in a similar reduction in retail electricity prices (?), then electricity expenditures in NH would be about 1.5% lower then they otherwise would be.  Whether illusory or not, given the consumption and expenditure trends lines above, it is hard to see that this impact on wholesale electricity prices will have much of an impact on the high cost of electricity in NH.

Ideologically Uncomfortable Economic Growth in New England

Posted January 11, 2013 by Brian Gottlob
Categories: Fiscal Policy, New Hampshire, Tax Revenue

Tags: , , , ,

State government revenues in NH have grown more slowly over the past few years than almost every other state in New England and there aren’t any signs on the horizon that revenue will grow substantially over the next biennium.

General Revenue Growth

Some of that is the result of policy decisions that looked to reduce taxes in NH in order to increases economic growth, some is the result of other states willingness to expand or raise taxes, and some of it is the result of the fact that NH’s economy has been growing more slowly than most NE states with the exception of Rhodes Island and Maine.  How much of the slow revenue growth is attributable to a weaker economy and how much is attributable to policy changes is difficult to discern.  In some cases it is easy, the cigarette tax was reduced and produced less revenue (almost exactly the amount that I forecast) but more generally, slower growth (or declines) in revenues will occur in a weak economy regardless of policy changes.   Even without a definitive answer to that question we can still learn something from the fiscal and economic experiences of NH and neighboring states over the past few years.

Because it seems that it  is all ideology all the time in public policy debates these days, lets filter the revenue and growth debate through the ideological prism that characterizes most legislative bodies and public debate today.  For some in NH, it is bad enough that both Massachusetts and Vermont (that would be two-thirds of the Holy Trinity of New England socialism if socialists were allowed to believe in the Holy Trinity) have enjoyed stronger economic growth than NH over the past nearly two years.  But it is even tougher to accept that each of these states can enjoy faster growth than NH at the same time they are seeing stronger growth in revenues, and maybe even at a time when they took steps to keep revenues from falling too far, because to ideologues on one side, more revenue has to mean slower economic growth and the only way to get stronger growth is to cut revenues.

NE emp growth

The other end of the political spectrum will argue that the collecting more revenue has allowed these states to invest in more of what their economies need to grow, but there hasn’t been a whole lot of “investing” by state and local governments anywhere in recent years and each of these states has taken some steps to reduce the size and scope of state government expenditures in recent years.  The reality of course, as it almost always is, is somewhere in that wasteland (according to ideologues) known as “the middle”.   The stronger revenue growth of some states is largely a function of stronger economic growth and not necessarily the “investments” those revenues allowed but it can also be said that their generally higher levels of taxation have not disadvantaged their economic performance in relation to NH with its lower level of taxation.  Some of NH’s slow revenue growth is the result of policy decisions but most is related to an economy growing more slowly than neighboring states.  If there is anything to learn from recent economic and revenue trends it is that taking less in revenue  does not, in itself, guarantee stronger growth and that more revenue doesn’t always stifle (although it could) economic growth.  I know business taxes in NH remain high, but that has been true for as long as almost anyone can remember.  It didn’t keep NH from growing faster than any other state in the region for most of 30 years so I doubt it is the singular reason why we are growing more slowly now.  That doesn’t mean it isn’t an issue that should be addressed, it just means that its not likely the only answer to NH’s problem of slower economic growth.  For all of us non-ideologues, I hope lawmakers look to broaden the range of issues in the policy debates over how best to strengthen NH’s economy.

The Coming “Consumerism” of Residential Electricty Customers

Posted January 9, 2013 by Brian Gottlob
Categories: Electricity, Energy, New Hampshire, prices

Tags: , , , ,

It is no secret that the price of electricity in New Hampshire in relation to prices in most of  the U.S. is high.  That is true for all types of consumers of electricity, residential, commercial, and industrial, but prices for industrial customers were especially high compared to prices across the country.  New England is known for high energy prices but New Hampshire’s electricity prices compare more favorably to the region than they do to other regions and states.  Industrial consumers of electricity in NH, however,  seemed to pay relatively higher prices in comparison to industrial consumers across New England.  Over the last half of the past decade that  changed.  Either because of competition for industrial customers, special rates, or other reasons, the relative price of electricity for industrial customers in NH fell significantly in relation to average prices in New England and are now (through 2011) just below the regional average.  For residential consumers price trends are different.  Compared to the New England average, prices per kwh were relatively low for NH’s residential consumers, but they have been rising and are now (through 2011) just above the New England average.

NH Electricity Prices as a Pct of NE

The price competition that has benefited industrial consumers of electricity in NH is likely partially responsible for the rising prices and higher relative prices facing residential customers. Prices for residential consumers seemed to rise more just as  prices for industrial consumers fell.   As a result, as is being reported in a number of media outlets, competition is becoming more robust in NH for residential consumers of electricity.  That will eventually result in lower or more slowly growing average electricity prices for NH’s residential customers.   Competition does lower prices but it will only do so  for those who actively  participate in the competitive market.  Just like a car dealer,  electric utilities will look for someone to pay the full “sticker price” for every consumer who gets a “deal”.

It Seems You Can’t Turn White Collars Blue

Posted January 8, 2013 by Brian Gottlob
Categories: employment, Help Wanted, job growth, Labor, NH, Skills Gap

Tags: , , , ,

Two contradictory trends are occurring in NH’s labor market and as Ricky Ricardo would say “somebody’s got some splaining to do”.   I see no other hands up in the room so I will take a brief stab at it.  The chart below shows that help wanted ads in NH rose modestly this year but the rate of employment growth in the state has been declining.

Help wanted and Emp Growth iin NH

It is easy to rest things on, and to take things off, the top of a flat head so here are a few off the top of mine that could be influencing these trends: 1) It could be that more jobs are being advertised in NH but are for companies with multiple locations – including NH and nearby states (I think this is not likely to be having much affect), 2) advertised jobs are not being filled because there are not enough applicants companies want to hire – “the skills gap” again (I think this is significant based on conversations I’ve had with companies), 3) the job growth numbers in NH could be revised upward with the upcoming benchmark revisions (I think this is likely but it may not be as significant as I thought a few months ago).

Regular readers know I write too often about the skills gap.  I like the issue because it gets at so many issues of fundamental importance to the future of NH’s and the nation’s economy – education and training, k-12 and post-secondary education, young people and their guidance and direction etc.  The skills gap is most often associated with very skilled scientific and technical occupations but in NH at least, any skills gap may be more pronounced in production and skilled “blue collar” occupations.  Based on the volume of  help wanted advertising in the state since the recession, the demand for those occupations has increased significantly compared to management, financial, business, technical and scientific occupations.

Help Wanted by Occup Since Recession

Despite the large percentage increase in help wanted ads in production and skilled blue collar occupations, employment in industries that employ those occupations has grown little.  It may be that there is a lot of ‘churning” in those industries (some businesses hiring and some contracting) resulting in little net employment gain but the anecdotal evidence (I am reluctant to rely on such evidence but it is the best we have at the moment) is that many businesses who would hire production and skilled, blue collar workers are unable to find individuals to fill their positions.

It has been a relatively recent (over the last several decades) transition for NH to a more technology intensive economy that relies less on production and skilled, blue collar labor.  Once the core of the NH economy it has been a long while since NH was seen a a land of opportunity for those who worked with machines and tools (other than just  computers) and once you have moved on  it can be very hard to go back – even when there is a reward for doing so.

Brother (or Sister) Can You Spare a Dime?

Posted January 7, 2013 by Brian Gottlob
Categories: Fiscal Policy, job growth, Tax Revenue

Tags: , ,

Tomorrow I will have the opportunity, along with several people a lot smarter than me,  to address the NH House Committee on Ways and Means to talk about some of the forces and factors affecting revenue growth at the state level.  I’ve forecasted (pretty accurately I think) the impacts of policy changes on state revenues for a number of clients and projects (here is one example I’ve written about in this blog).  Things like energy and gasoline prices that affect the disposable income  of NH residents and the willingness of out-of-state residents to travel to NH for recreation or shopping (energy prices can affect the price differential calculus for an out-of-stater coming to NH to purchase  goods or avoiding travel costs by purchasing higher-priced goods in their home states) are just a couple of examples that can make the difficult task of revenue estimation that much more difficult for NH lawmakers.  It’s a tough and thankless job and if I can help I am happy to.   It is especially difficult these days because the news on revenues is rarely good, as the chart below shows,  year-over-year quarterly state revenue growth ( from the state’s 8 largest “own source” revenues) has performed more poorly, for a longer period of time, than at any time over the past decade.

NH revenue growth

Some policy actions contributed to that (the decrease in the cigarette tax is an example – although that was only a small contributor to slower revenue growth) but the biggest reason is weak economic and job growth.

NH Job and Revenue Growth

Tomorrow I will present a number of charts and talk about a number of factors that influence various revenue sources but the bottom line is this:  until we have more than tepid employment growth, revenues aren’t going to grow significantly and forcing them to grow (via a major policy change) will not contribute to stronger job growth.  That isn’t the same thing as saying “any policy change (rate adjustment etc.) will harm job growth and revenue growth in the long run.”   NH’s unique fiscal system has survived far longer than many thought possible (and longer than many wanted it to survive) because of balance – those on the left of the political spectrum had to be satisfied with the state doing what it “needed to do”  rather than what it “wanted to do” and those on the right had to be willing to allow for some adjustments in tax rates and revenues to keep call for major policy changes at bay.  I think that worked pretty well for a long time but it only works when their is a modicum of flexibility and compromise in the policymaking process.    That, in fact, may be the best estimator of revenue growth moving forward and you don’t need an expert panel of wonks and nerds to tell you that.

Can We Be Different Like Everyone Else?

Posted January 4, 2013 by Brian Gottlob
Categories: casinos, Fiscal Policy, Gambling, Tax Revenue

Tags: , , , , ,

I was surprised to see the number of states that have allowed casino gambling.  In a prior post I focused on what I thought were the states that are perhaps most identified with casino gambling (Nevada, New Jersey, and Connecticut).  Twenty three (23) states and five since 2005 (if you count Massachusetts) now allow some type of casino gambling.  As the map below shows, the Northeast region of the country is the king of casinos.  I don’t know what that says about the Northeast but Vermont and New Hampshire are now the only states in the region that do not have some form of casino gambling. (a note about the data in the charts below:  I have taken reasonable steps in the limited time I allocate to this blog to provide accurate information – if anything appears inaccurate please let me know).

Note: Map is Updated thanks Curtis!

 Competitive Casino Map

I think whether or not to become more like other states in the region is an important and ongoing debate in New Hampshire, whether it be about our revenue structure, which stands out in the region, or our political, legislative, and regulatory structures which to a lesser degree do as well.  I’ve long argued that the state was able to buck the region’s unfavorable demographic and  economic trends because it was somewhat unique in the region.  Some who disagree with me on that argue that the state should, in the case of casino gambling, refuse to become more like the rest of the Northeast region.  While others who agree with me on the benefits of NH’s uniqueness are arguing that NH should have casino gambling because other states in the region are doing it.  Consistency isn’t what it used to be or perhaps I just confuse consistency with rigidity.  It is also possible that I am misreading the whole consistency and change aspect of the debate.  Could it be that gambling is consistent with NH’s fiscal traditions but inconsistent with its uniqueness in the region?  I don’t expect there will be a lot of testimony on that at any public hearings on casino proposals.  For those more interested in the pedestrian issue of how much state revenue we can expect, below is a chart that shows how much states currently take in from casinos (in very broad categories).  Interesting to see that Pennsylvania is now the champion in terms of state revenues from casinos.  That state is, in large part, responsible for the decline in revenues in New Jersey.  Things are definitely changing in NH and the upcoming debates over whether or not to allow casino gambling will, I think, tell us a lot about the direction of that change.

State Revenue from Casinos