For the calendar year 2018, federal corporate tax revenues were about $91.4 billion lower than during calendar year 2017, a decline of about 32%. The federal corp. tax cuts that took effect in 2018 lowered the tax rate from 35% to 21% and are the primary reason that federal revenues were 0.4% lower in calendar year 2018 compared to 2017 (in a strong economy). All banks are required to file detailed financial reports to regulators on a quarterly basis. Examining that data provides an estimate of how banks were affected by the recent federal tax cuts. Comparing the average effective tax rate of banks between 2013 and 2016 (in 2017 banks paid an an anomalously high rate) to the rate in 2018 and applying the difference to the pretax income of banks provides an estimate of the savings banks received from the corp. tax cut. The table below shows that collectively, banks accounted for $31.7 billion or about 1/3rd of the total corp. tax cut savings, with the 9 largest banks saving almost $15 billion or 16% of the total corporate tax savings in 2018 – an average $1.64 billion per bank. I expect banks, and big banks in particular to have an issue with this estimate so I encourage them to point out errors in my simple methodology.
Archive for the ‘Banks’ category
Big Banks Big Tax Savings
April 2, 2019It’s a Good Time to Be a Bank
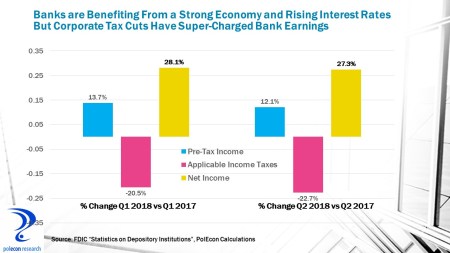
October 15, 2018It’s a good time to be a bank, well a BIG bank anyway. Bank of America’s Q3 profits are up by 32%, JPMorgan/Chase’s by 24%, Wells Fargo by 32% in the 3rd quarter. Higher interest rates, a strong economy and needed (for smaller banks) regulatory relief have helped but the biggest contributor has been the reduction in the corporate tax rate. Industry-wide Q3 results have not yet been reported but looking at Q2 and Q1 2018 data compared to 2017 shows the impact of tax cuts. While banks pre-tax income was up by 12-13% in 2018, net income was up 27-28% because applicable income taxes (federal & state) were down more than 20%.
The banking industry has been perhaps the biggest beneficiary of the Trump administration’s initiatives. Earlier this year I examined over 400 press releases announcing how companies would be using the proceeds from corporate tax cuts and highlighting employee bonuses, minimum wage hikes, etc. (the releases were remarkable in their similarity as were the benefits accruing to employees – a small percentage but more about that in a future post). Despite banks being only about 1% of all business enterprises thy accounted for just over 30% of the press releases highlighting worker and civic benefits of the tax cut.

“Too Big to Fail” or “Too Small to Succeed”?
March 21, 2016Community banks’ share of the U.S. banking market has declined significantly over the past two decades but since 2010, around the time the Dodd-Frank Wall Street Reform and Consumer Protection Act was passed, community banks’ share of all U.S. banking assets has shrunk at a much faster rate. Dodd-Frank may be offering consumers greater protections (data on that issue is not readily available and is less straightforward in any case), but the data clearly show that legislation designed to prevent another “too big to fail” financial crisis is also accelerating the declining market share of community banks, contributing to consolidation in the banking industry, and perhaps helping to create more “too big to fail” institutions. The chart below shows how the volume of assets and loans have changed since the passage of Dodd-Frank for community banks (defined here as those with less than $1 billion in assets), banks with $1 to $10 billion in assets (some researchers consider these banks to be community banks), as well as banks with over $10 billion in assets.

Other than bankers and their regulators, nobody really cares about the market shares of different sized banks, but the out-sized role community banks play in lending to small businesses and the critical role community banks play in smaller communities and rural regions of the country make it an important economic issue for a large slice of the U.S. economy. In almost one-third of the nation’s counties the only depository institutions located in the county are community banks according to a study by the U.S. General Accountability Office (GAO). Small businesses also depend disproportionately on community banks. The chart below shows that despite holding only 14 percent of all loans in the banking industry in 2006, community banks held 42 percent of all small business loans across the country. The chart also shows how the rate of decline in the share of all loans held by community banks, as well as small business loans, have accelerated since 2010.

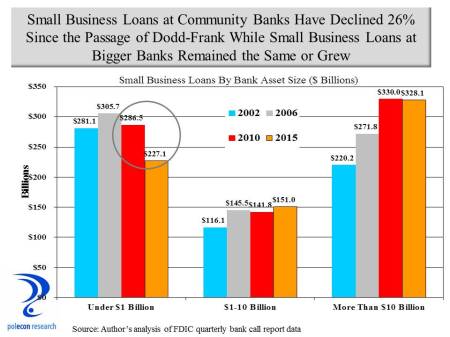
More troubling than the loss of market share by community banks (after all, does it matter as long as lending to small businesses increases?) is the sharp absolute decline in small business lending by community banks since the passage of Dodd-Frank. I think it matters a lot that community banks’ share of lending is declining because of the traditional role of relationship banking and the willingness to consider “soft information” has played in community bank lending decisions and the implications for access to credit by small businesses. As the chart below shows, as recently as 2006, community banks were the largest source of small business lending by the banking industry. Since 2010, however, small business loans at community banks have fallen sharply.
Some of this is the result of consolidation, smaller community banks being acquired by larger, non-community banks. But even that is influenced by Dodd-Frank. Any regulatory requirement is likely to be disproportionately costly for community banks, since the fixed costs associated with compliance must be spread over a smaller base of assets. As the GAO reports, regulators, industry participants, and Federal Reserve studies all find that consolidation is likely driven by regulatory economies of scale – larger banks are better suited to handle heightened regulatory burdens than are smaller banks, causing the average costs of community banks to be higher.
The implications for small businesses and for the economies of smaller and more rural communities are clear. As regulations require more standardized lending and reflect bigger bank processes and practices, community bank lending will be constrained and because they are a major source of small businesses loans and major source of local lending in most rural areas, small business and the economies of smaller, more rural communities will be disadvantaged. Automobile, mortgage, and credit card loans have become increasingly standardized and data driven. These loans are increasingly made without any personal interactions, via the internet and by less regulated institutions, or by larger banking institutions with the infrastructure to make exclusively data driven lending decisions. Business loans are different. Community banks have had to focus to a greater extent on small business and commercial real estate lending – products where community banks’ advantages in forming relationships with local borrowers are still important – as more types of loans have become increasingly standardized. Community banks generally are relationship banks; their competitive advantage is a knowledge and history of their customers and a willingness to be flexible. Community banks leverage interpersonal relationships in lieu of financial statements and data-driven models in making lending decisions, allowing them to better able to serve small businesses. Regulatory initiatives such as Dodd-Frank are more reflective of bigger bank lending processes which are transactional, quantitative and dependent on standardization. Understanding the financials of a business, its prospects, the local community in which it operates, or the prospects for its industry, are hard to standardize. Community banks ability to gather “soft information” allows them to lend to borrowers that might not be able to get loans from larger institutions that lend with more standardized lending criteria. The less “soft information” is incorporated into lending decisions, and the more costly become the regulatory requirements on banks, the more community banks will diminish and with it an important asset for small business, and small communities across the country. It is possible that someday small business lending can be more standardized, less interpersonal, in a way similar to credit card or auto loans and in a way that does not disadvantage small businesses, but I am skeptical.
The debates surrounding financial services regulation since the “great recession” have focused on the safety and soundness of the financial system and on consumer protections, both important objectives, and to be fair, the banking industry too often appears only self-interested in regulatory debates. But far too little consideration has been given to the impact of new financial services regulations on small business, communities, and rural regions of the country.
Authors Note: I have done some studies for the banking industry in the past. This post is not an effort to shill for their interests. This blog is about timely topics that interest me and a place where I can write about them free of any compensated interests. It is an outlet for my analytical interests and opinions. I do confess, however, an affinity for community banks and the people who run them because of the strong commitment that they demonstrate to the people, businesses, and communities in which they operate.
There Goes the Punch Bowl – Quantitative Easing for Dummies (Like Me)
June 21, 2013Economic recovery following a recession is almost always characterized by rapid employment growth, not this one. In an effort to boost demand, central banks across the globe, and especially the U.S. Federal Reserve, have pursued easy money policies in the wake of a worldwide financial and economic crisis. Despite these efforts job creation continues at a tepid pace compared to recoveries from prior recessions.
Over the past decade the U.S. production of self-degreed constitutional scholars as well as Federal Reserve haters has grown exponentially. I am neither. The Fall of 2008 was a frightening time for anyone with even a cursory knowledge of the U.S. and world financial systems. The Federal Reserve’s actions, along with other central banks, helped avoid an unimaginable calamity and while I am no Fed hater it is appropriate to consider the Fed’s policies in the three plus years since the Fed did what it needed to do to avoid a financial catastrophe.
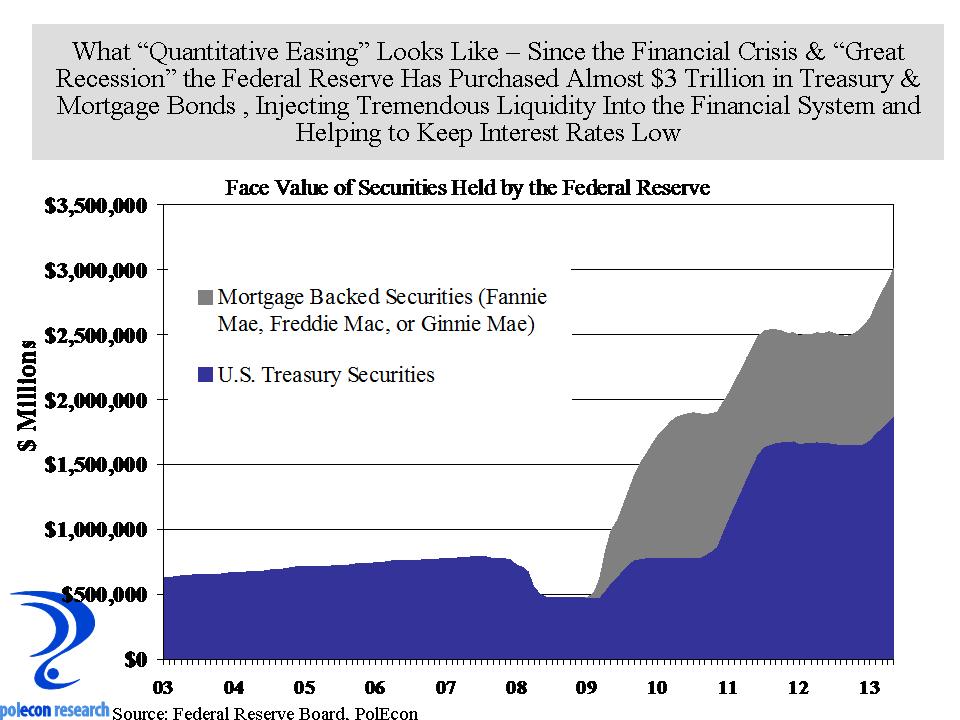
The Fed first began injecting liquidity into the financial system by purchasing the assets (loans and securities) of financial institutions (quantitative easing or QE 1) as the financial crisis and recession were taking hold. This helped assure that there would be a supply of funds available to fuel the credit needs of the economy at a time when many banks were badly weakened and most were unwilling to lend even to each other. As the chart below shows, the initial round of quantitative easing was followed by a continuation of purchases of mortgage backed securities (MBS) and treasury notes and bonds (QE 2 and QE 3), tripling the size of the Federal Reserve’s balance sheet. The increase in demand for MBS and treasuries helped boost the price of these assets pushing their yield down and keeping interest rates in the economy low.
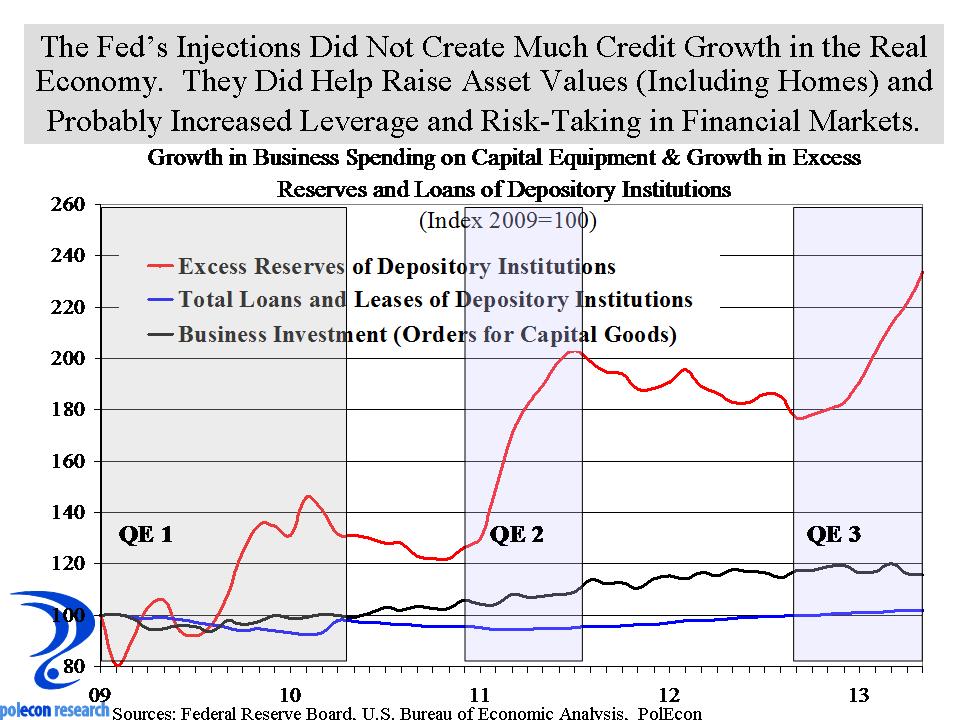
The problem is that the Fed’s liquidity injections have not created credit or the demand for credit in the real economy, but rather they have increased leverage and risk-taking in financial markets. They have also helped increase asset values. Increasing the value of stocks and bonds and especially homes is a good thing but as a method of stimulating the economy, not especially efficient.
Fractional reserve banking means that every dollar available to a financial institution can result in many more dollars in loans. Every introductory economics student learns that the rapid expansion of the money-supply inevitably fuels inflation – except in this case it has done neither, at least thus far. Inflation has remained subdued at roughly 2% because there is still a substantial amount of slack and a lack of demand in the economy and because banks are not using their swelling reserves to expand credit and increase liquidity. This is not at all an indictment of banks. They are responding to the tepid demand for credit at a time when de-leveraging has been the norm. Banks earn 0.25% on the excess reserves (the fractional reserves in excess of those required to be held based on the volume of their loans and other assets). With interest rates at historic lows, de-leveraging occurring among businesses and consumers, and at a time when banks face increasing scrutiny and regulation, we should expect that banks would be most willing to lend to the government and large stable corporations and less likely to extend credit to riskier borrowers like small businesses, start-up companies or first-time home buyers. The chart below shows how the excess reserves of banks have grown with each round of quantitative easing, along with growth in the loans and leases of domestic banks, and growth in capital equipment purchases by U.S. businesses. The chart suggests that about 2% of the liquidity injected into the financial system during QE 2 and QE 3 has been circulated into the economy, while the rest sits idle.
The last time, interest rates were too low for too long (2001-2004) the result was huge bubbles in credit, housing, and equity markets and we know how that movie ended. As the Fed begins to reduce its purchase of securities, the stock and bond markets are reacting with fear, too bad, its time for a movie with a better ending for the “real economy” and that will take policies that don’t just satisfy financial markets.
The Changing Banking Market
October 23, 2012Public antipathy toward large financial institutions may have been building throughout much of the past decade but it surely peaked during and immediately following the recent recession and the financial crisis that helped precipitate it. One result appears to be a changing market structure for deposits and loans at financial institutions in NH and across the country. The recession in our state was less severe than was the recession of the early 1990’s, and less severe than was the recent recession in many states because of the the overall health and strength of our state’s banking institutions. Nevertheless, one fallout from the financial crisis appears to be a growing market share for credit unions in the state. As the chart below shows, since the recent recession, deposits at credit unions have grown much faster than deposits at NH banks overall. Deposits at NH community banks have grown faster than deposits at all NH banks, suggesting that deposit gains by credit unions have come largely at the expense of large banks in the state, as deposit growth for all NH banks is much lower than the growth among just community banks. Prior to the recession and financial crisis, deposits at NH community banks were growing faster than were deposits at credit unions.

It would be unfortunate if community banking institutions that have had strong commitments and links to their local communities and regional economies are tarred by the actions of institutions from afar. Beyond that, a fundamental change in the market shares for financial services could have significant impacts on the regulation of financial services, on government revenues , and on market shares as the tax exempt status of credit unions contributes to their ability to compete and capture market share. The increased concentration of deposits in the banking industry that occurred during much of the 1980’s and 1990’s may now be occurring among credit unions. As the services credit unions offer and their branching look more and more like those of banks, their ownership and regulatory structure may be the only thing that distinguishes them from banks.


