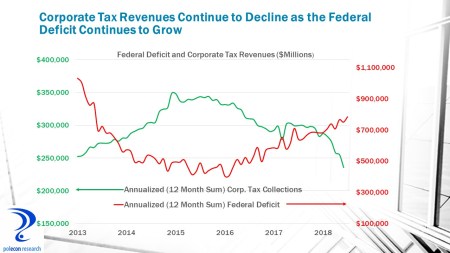
For the calendar year 2018, federal corporate tax revenues were about $91.4 billion lower than during calendar year 2017, a decline of about 32%. The federal corp. tax cuts that took effect in 2018 lowered the tax rate from 35% to 21% and are the primary reason that federal revenues were 0.4% lower in calendar year 2018 compared to 2017 (in a strong economy). All banks are required to file detailed financial reports to regulators on a quarterly basis. Examining that data provides an estimate of how banks were affected by the recent federal tax cuts. Comparing the average effective tax rate of banks between 2013 and 2016 (in 2017 banks paid an an anomalously high rate) to the rate in 2018 and applying the difference to the pretax income of banks provides an estimate of the savings banks received from the corp. tax cut. The table below shows that collectively, banks accounted for $31.7 billion or about 1/3rd of the total corp. tax cut savings, with the 9 largest banks saving almost $15 billion or 16% of the total corporate tax savings in 2018 – an average $1.64 billion per bank. I expect banks, and big banks in particular to have an issue with this estimate so I encourage them to point out errors in my simple methodology.
Archive for the ‘Federal Deficit’ category
Big Banks Big Tax Savings
April 2, 2019Frequently in Error But Rarely in Doubt
January 2, 2019In my economic presentations I often say that I am ‘frequently in error but rarely in doubt.” Still, when in error I admit it, it’s a sign that I am willing to ask myself “why” in order to improve my methodologies. I was wrong when I predicted NH’s job growth would be under 1% in 2018 (it is double that), largely because the labor force was able to grow more than I had forecast (see my previous post on net in-migration to the state). In a letter to Congress over 100 economists asserted that “the macroeconomic feedback generated by the “Tax Cuts and Jobs Act” would be “more than enough to compensate for the static revenue loss,” implying that the bill would be deficit-neutral over time. Federal revenues have a seasonal (monthly) variation, with some months bringing in more revenue than the government spends and vice versa. Comparing similar months over time thus offers some insights into the deficit trends over time and in different economic conditions. As the chart below shows, the November 2018 monthly deficit (the most recent data available) show that during a period of solid economic growth the U.S. ran the highest November monthly deficit in its history.

Proponents of the bill also claimed that we would see enough additional investment to boost growth by 4% per year. That implies an increase in annual investment of roughly $800 billion. But, as this post noted, investment has not jumped to that level, nor does it show signs of doing so anytime soon. The economists who predicted that tax cuts would spur a rapid increase in investment and higher revenues have been proven wrong. They have also remained silent, which suggests that they are not at all surprised to see revenues and investment fall far short of what they promised. Many, if not most, will dismiss the rising deficit (see below) during times of solid economic growth as a function of rising spending.

Rising spending is, in fact, a major but not unexpected contributor to the deficit problem. Stagnant or declining revenues in a strong economy are not the norm, and are the kind of pro-cyclical fiscal policy (cutting taxes in a strong economy instead of filling coffers during a strong economy so that taxes can be cut to stimulate the economy when it is weak) that is going to make the next economic downturn much more difficult to combat.
“How Did You Go Bankrupt?”
August 13, 2018“How did you go bankrupt?” Bill asked. “Two ways,” Mike said. “Gradually and then suddenly.” Ernest Hemingway, The Sun Also Rises
This is the literary version of a concern issued many times by the noted economist Rudiger Dornbusch, who liked to say: “The crisis takes a much longer time coming than you think, and then it happens much faster than you would have thought.”
Last Friday’s release of the U.S. “Monthly Treasury Report” shows a continuation of the twin trends of declining revenue and increasing expenditures.
This is the sort of fiscal stimulus that so many lawmakers argued against as the economy was being pummeled during the “great recession.” Why is this pro-cyclical rather than counter-cyclical policy now a good idea for those same lawmakers? Historically the U.S. fills its coffers during good times so we are better able to deal with bad times. Rising deficits in a strong economy should be more upsetting than the latest presidential tweet. What makes the current situation so unusual and more worrying is the low short-term interest rates and the high (and rising) level of federal debt. As interest rates rise the high levels of federal government, corporate and household debt will reveal the folly of credit-inflated growth.

The Best of Times, The Worst of Times
February 16, 2018“It was the best of times, it was the worst of times, it was the age of wisdom, it was the age of foolishness, it was the epoch of belief, it was the epoch of incredulity, it was the season of light, it was the season of darkness, it was the spring of hope, it was the winter of despair.”
– Charles Dickens, A Tale of Two Cities
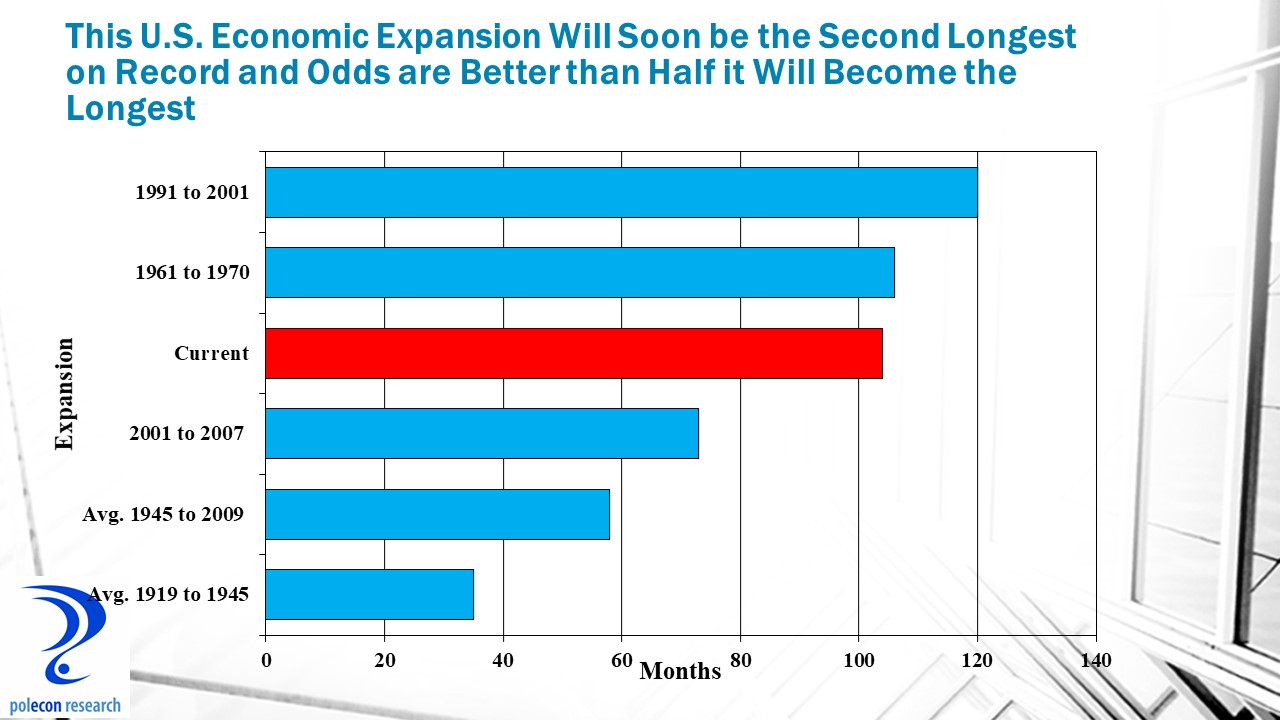
The U.S. economy is currently in the third longest period of uninterrupted expansion in its history, soon to be the second longest, and there is a better than even chance it will become the longest in history 16 months from now. Even without the recently enacted deficit-financed stimulus (tax cuts and expenditure increases) the U.S. economy was on solid ground, with growth forecast to be stronger in 2018 than it was in 2017. That is what makes lack of concern over the projected increase in the government’s annual deficit from about $700 billion to $1 trillion especially troubling.
The current economic expansion is exceptional in duration and atypical in gaining strength late in the economic cycle. But it is also about to become notorious for producing a burgeoning federal deficit during a period of solid economic growth (annual federal deficits are generally inversely related to economic conditions). So the price of stronger growth and a longer expansion is looking like higher annual budget deficits (forecast to grow from 3% of GDP to 5% just by 2019) and a national debt that will grow from about 76% of GDP to 97% over 10 years, risking longer-term economic growth. It is a high price to pay for a small increase in economic growth and a fiscal policy gamble to add stimulus to an economy near full employment but it is price that the administration and congress are willing to pay without hesitation.
Annual deficits declined between 2012 and 2016 as the economic recovery strengthened and costs associated with the “stimulus” eroded. But since early 2016 deficits have been increasing. The difference between monthly revenues and expenditures over the most recent 12 twelve months (between February 2017 and January 2018) shows that the annualized federal deficit stands at $682 billion compared to $585 billion for the February 2016 to January 2017 time period, a 17% increase over the year and up from a low of $405 billion early in 2016.

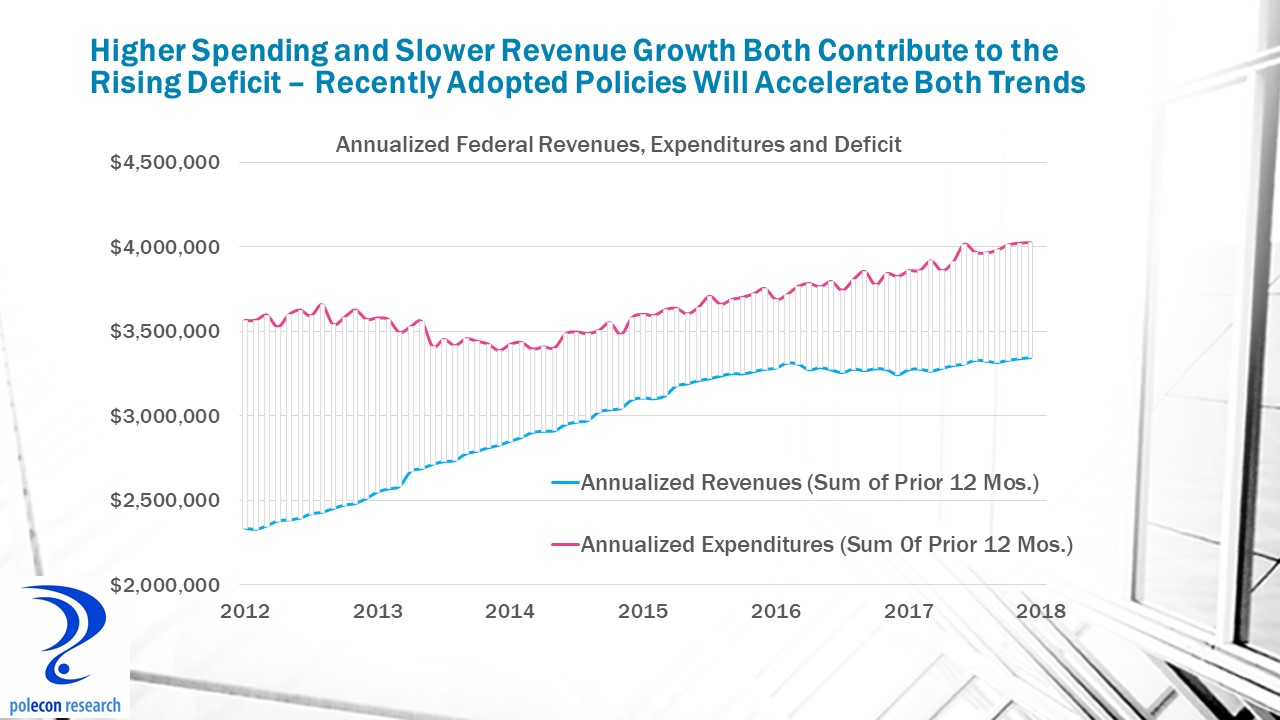
The increase in the deficit results from both higher spending and a slowing rate of revenue growth (chart below), and it comes before the impacts of recently enacted tax cuts and the two-year spending agreement take effect that will both lower revenues by about $1 trillion over the next decade (even after accounting for growth effects) and increase spending by about $300 billion just over the next two years.
The U.S. has had higher annual deficits in the past, but always during a period of weak or negative economic growth. Increasing deficits and greatly adding to the nation’s debt in the absence of an economic downturn should have been a giant caution sign for lawmakers. If $400 billion annual deficits were “crippling” our economy in 2016 (as some lawmakers suggested) how are $1 trillion deficits in a growing economy not of more concern? Debt is often the match that lights the fire of economic crisis, whether the fault was with politicians, central bankers, overzealous consumers, businesses, developers, bankers, credit rating agencies, regulators, or any combination thereof, all true crises involve too much leverage.
With that admonition (screed?), reducing the corporate tax rate was still a good idea, the U.S. rate was too high. And yes, a lower corporate tax will raise wages eventually (lower taxes increase capital investment and improve productivity – raising wages), but only after years, and certainly not in the time frame suggested by the White House. But just as important (and largely a missed opportunity in the legislation) was the need to eliminate targeted and industry-specific preferences that direct too much investment to tax-favored activities rather than to their most productive uses. Many of the agreed upon expenditure increases also have merit. Overall, however, the combination of tax and spending policies recently enacted seems poorly structured and ill-timed. If we enact a deficit funded stimulus when we are near full employment and when the economy is already poised to grow more rapidly, what will we be able to do when the next recession arrives?
Impact on State Finances
The New Hampshire economy is fundamentally strong, our industries are as vibrant and innovative as ever and the state’s economy would be growing and producing more if the supply of labor could accommodate more growth. It can’t, labor force growth is not keeping pace with labor demand and economic growth has been slowing in New Hampshire for at least two quarters. It will continue to do so in 2018. So too will state revenues.

State-level GDP estimates produced by the U.S. Bureau of Economic Analysis are reported with a long lag and are not a very timely indicator of current state growth trends. A useful proxy for assessing growth trends in state-level GDP is aggregate hours worked in the state (employment times the average number of hours worked) which correlates well with changes in the state’s total output of goods and services (GDP). Adding current estimates of U.S. productivity growth (there is no similar state-level measure) provides a high-frequency estimate of the state’s GDP growth trend. As the chart below shows, the growth rate of NH GDP is declining, again, primarily because the rate of employment growth is declining. When you are adding fewer workers the output of the state’s economy will grow more slowly unless there is a significant increase in productivity (it has increased some but not significantly).

Slower employment and economic growth in NH (along with changes in revenue policies) have slowed the rate of revenue growth in the state since 2016. There has been a bump in the past few months but how the recently enacted tax cuts at the national level will affect the trend is uncertain. What is certain is that the growth constraints NH faces will make it difficult to accelerate economic growth in the state and thus state revenues.
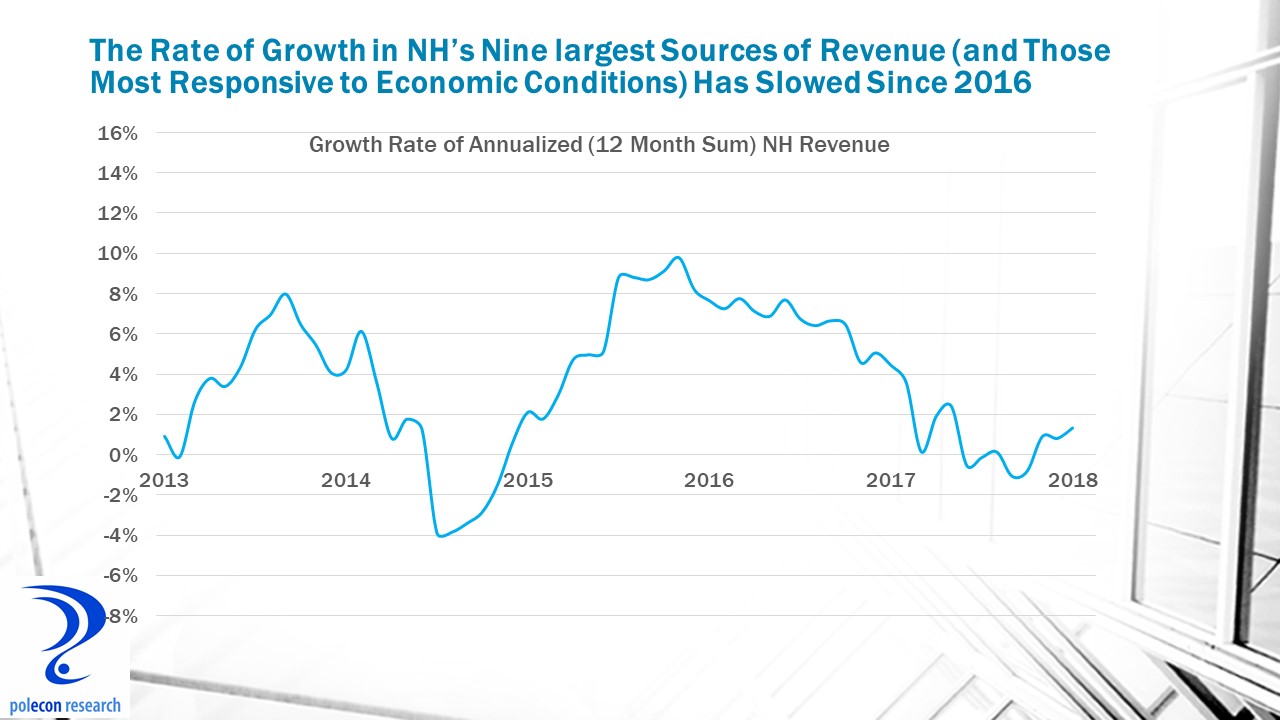
Looking at annualized revenue growth (summing any 12 month period), the chart below shows that revenue from NH’s nine largest sources of general revenue (and the sources most affected by economic trends) hit a plateau in 2016, at a time when employment growth was at its post-recession peak. Since that time, annualized growth in the revenue sources most affected by economic conditions has slowed.

Looking at the rate of change in annualized state revenues illustrates the longer-term slowing of the rate of annualized growth. The chart below shows how significantly the growth rate in revenues has slowed since 2016.
Expenditure Pressures Will Mount
The impact on state revenues of recent changes in federal policies may be uncertain but their impact on state and local government is likely to add to the state’s fiscal pressures. A great deal of uncertainty exists over how funding for state-operated programs that share costs with the federal government will be affected but most signs point to less funding for programs like Medicaid and infrastructure. The administration’s recently announced $1.5 trillion infrastructure proposal actually reduces funding for states while calling for greater state commitments. Proposals to cap or block-grant Medicaid funding would significantly add to the fiscal pressures facing all states. At the same time mandatory spending on things such as government pensions are poised to increase significantly in coming years.
Other recent federal policies will affect states and localities by increasing the cost of borrowing. One change eliminated the tax-free status of “advance refunding bonds” that allow states and communities to refinance debt at lower interest rates well before their call date in order to free-up funds for other purposes. The prospect of annual deficits of more than a trillion dollars (placing greater demands on credit markets) during a strong economy when deficits typically fall, has also increased expectations of higher interest rates, increasing the cost of borrowing by governments, households and businesses. How fast and how much rates rise is not certain but they have already increased significantly this year (albeit from low levels.)
Less directly, federal tax law changes will affect the borrowing costs of state and local governments by making municipal bonds less attractive (relative to other loans and investments). Banks and insurance companies are big buyers of municipal bonds – lending money to state and local governments. The interest rate that governments have to pay on those bonds is lower than on other types of loans made by banks because banks and insurance companies do not have to pay taxes on the income they earn from loans to governments. The drop in the corporate tax rate reduces some of the advantage of the tax- free bonds and makes other loans/investments made by banks and insurers more attractive relative to municipal bonds. Interest rates on municipal bonds will have to rise to remain competitive with other loans.
Along with slower growth in state revenues there are enough spending pressures building along with potential impacts from recently enacted federal policies to suggest lawmakers in the state would be wise to be cautious in the next budget cycle that begins in the fall of this year.
The divergence between economic and fiscal conditions doesn’t seem to be troubling to many policymakers at the federal or state level. With apologies to Dickens, it does feel like “it was the best of times, it was the worst of times.” Let’s hope that it isn’t also becoming “the age of foolishness.”
The Shrinking U.S. Deficit
May 1, 2013Annual budget deficits since 2009 have been the largest in a generation. The deficit-to-GDP ratio, which averaged 2.5% from 1980 to 2007, peaked at 10.1% in 2009 as the recession reduced tax revenue and spending rose with the economic stimulus package. There is still a long way to go but the deficit to GDP ratio has improved each year since 2009 and will likely continue to do so for the next few years. The chart below shows a reasonable proxy of the official federal deficit – it shows the 12-month moving average of the difference between federal revenues and federal spending. Over the past year this deficit estimate has improved by an average of $28-$30 billion per month, much better than the CBO’s 2013 deficit projections.

The deficit is shrinking because of a combination of higher revenues and slower spending. To this point deficit reduction has largely been the result of higher tax revenue resulting from an improving economy, the expiration of the payroll tax holiday (worth about $135 billion this year), and higher tax rates for upper income individuals but spending reductions are beginning to play a larger role.
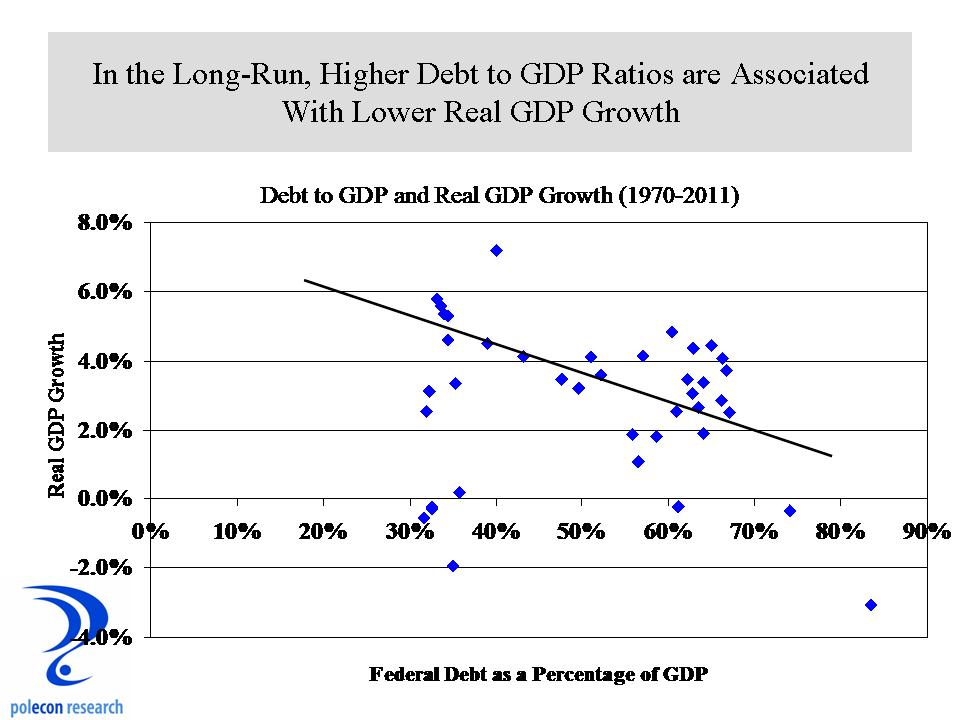
Lower deficits and a reduction in the national debt as a percentage of GDP will help economic activity in the long run. Although there are many short-term factors that influence the relationship between federal debt ratios and GDP growth, over the longer-term, higher debt levels are associated with slower GDP growth and lower debt levels are associated with higher GDP growth.
The deficit is contracting faster than expected, but the goal of deficit reduction can have negative implications from either excessive taxation or spending cuts that significantly impact demand. The Federal government accounts for roughly 7% of total economic output and has shrunk by an average of about 10% each of the last two quarters. So while the good news is that deficit-reduction is likely to be greater than expectations in the near term, the cost from tax increases and spending cuts will likely lower real GDP growth by about 1% over the next year.


