Archive for the ‘Uncategorized’ category

Is NH’s Labor Deficit Turning?

September 19, 2018

Aside from the ups and downs of business cycles, the growth rate of New Hampshire’s (and the nation’s) labor force and labor force participation rate has been on a consistent, downward trend. The rising percentage of NH’s population in age groups with traditionally lower rates of labor force participation along with slower overall population growth are key contributors. The two trends go a long way toward explaining why economic growth has been slower over much of the past two decades than during earlier time periods. As I noted in earlier posts, with NH’s extremely low birth rates, net in-migration to the state is critical for population, labor force, and ultimately employment growth. Net state-to-state in-migration to NH is resuming in age groups with higher labor force participation and one consequence is a recent increase in the working-age population, as well as labor force participation in the state (chart), enabling stronger job growth in NH. It is early but the trend is very encouraging.

Particption and Population

“How Did You Go Bankrupt?”

August 13, 2018

How did you go bankrupt?” Bill asked. “Two ways,” Mike said. “Gradually and then suddenly.”   Ernest Hemingway, The Sun Also Rises

This is the literary version of a concern issued many times by the noted economist Rudiger Dornbusch, who liked to say: “The crisis takes a much longer time coming than you think, and then it happens much faster than you would have thought.”

Last Friday’s release of the U.S. “Monthly Treasury Report” shows a continuation of the twin trends of declining revenue and increasing expenditures.

corp taxes and deficit

This is the sort of fiscal stimulus that so many lawmakers argued against as the economy was being pummeled during the “great recession.”  Why is this pro-cyclical rather than counter-cyclical policy now a good idea for those same lawmakers?  Historically the U.S. fills its coffers during good times so we are better able to deal with bad times.  Rising deficits in a strong economy should be more upsetting than the latest presidential tweet. What makes the current situation so unusual and more worrying is the low short-term interest rates and the high (and rising) level of federal debt.  As interest rates rise the high levels of federal government, corporate and household debt will reveal the folly of credit-inflated growth.

July 2018 Deficit

Price Pressures are Building in the U.S. Economy

August 10, 2018

There is disagreement among economists over how big a threat is rising inflation. A tame consumer price index and modest U.S. wage growth have many economists arguing against further interest rate increases in 2018. But there are signs that higher prices are working their way into the economy. The most obvious example is in goods that are affected by the trade war (skirmish?) between the U.S. and just about every other nation on earth.  Steel, aluminum, lumber, and washing machines are examples that have increased the price of building materials for new homes, laundry equipment, beverages in cans, and some other consumer goods. Even if the self-inflicted harm of a trade war disappears, however, consumers are likely to begin feeling price hikes. So much of what consumers purchase is transported via truck that recent increases in transportation costs (see graphic), unless abated, will soon affect consumer prices.

Truck Transportation Prices

We see this with gasoline price spikes and their resulting impact on grocery prices. Today, strong demand and worker shortages in the trucking industry are dramatically raising the cost of truck transportation services that will eventually work their way into consumer prices.

More Workers are Quitting Their Jobs and Getting Better Pay

August 7, 2018

U.S. job growth remains strong while real wage growth remains tepid despite a 3.9 percent unemployment rate nationally, but things may be changing. It is unlikely that companies can hold the line on wages – and depress real wage growth – when low unemployment encourages workers to quit their jobs in search of a higher salary. The rate at which workers are voluntarily leaving their jobs (the “quit rate”) is as high as it has been in 17 years (see graphic) as measured by the U.S. Bureau of Labor Statistics  “Job Openings and Labor Turnover Survey” (JOLTS).Quit Rate

This indicates a strong labor market where workers are confident that if they leave their job they can easily find another. The prospect for higher wages is a big reason. The Federal Reserve Bank of Atlanta’s wage measure for job switchers — people who leave one employer for another — reached 4.4% in March and is at 3.9% in June, well above wage growth for workers overall. It is a good environment for workers facing stagnating real wage growth to start looking for better pay, forcing firms to boost compensation to attract and retain employees. Although this is good for consumer spending, corporate profit margins may get pinched unless employers can cut costs elsewhere.

Where is the Surge in Corporate Tax Revenue?

July 31, 2018

Conservative orthodoxy says that tax cuts always pay for themselves. Unfortunately, there is little empirical evidence to support that. Other than ideologues, few economists believe that recent U.S. tax cuts will pay for themselves. Solid, empirical research suggests that perhaps 35%-40% of the revenue lost from rate cuts could be offset by growth effects. Again, as I have said in prior posts, the best that can be said is that corporate tax cuts lose less money over time.

Change in Corp taxes since tax cut

There are good reasons for cutting taxes and the U.S. corporate rate needed to be cut. But the case for setting tax rates at their lowest possible levels to maximize economic growth, while not increasing public debt, and still providing needed tax funded services is weakened, I believe, when ideologues argue that tax cuts always increase revenues or pay for themselves. Ideologues argued that the recent federal corporate rate cut would pay for itself and incentives to “repatriate” overseas profits would offset the rate drop. Six months into the rate cut corporate tax revenues are down 20% to 30% depending on the metric used, with no signs of improving, and with the U.S. deficit hurtling toward $1 trillion faster than expected.

The Fed’s Revenue Loss is NH’s Revenue Gain

May 24, 2018

Federal corporate tax revenues have been on a downward trend since 2016.  That is unusual in a recovering and growing economy.  The recently enacted corporate tax rate cut from 35 to 21 percent has accelerated the downward revenue trend, a result expected by everyone with a thought process more guided by empirical evidence than  ideological orthodoxy.  The figure below shows how much more sharply corporate tax revenue has been declining since the recent cut in the U.S. corporate tax rate.  Each point on the graph’s line shows the sum of the prior 12 months of U.S. corporate tax collections. Thus, the large recent drop in the 12 month sum of corporate tax collections (as of April 2018) includes only a few months of the new lower rate, yet it still shows a precipitous decline in annualized revenue.

Fed corp tax revenue

I would like to have seen more real “reform” along with a more gradual corporate rate cut (along with some spending reforms to limit impacts on federal deficits) but the U.S. and New Hampshire business tax rates were too high and needed to be cut.    Still, no one who has even a cursory knowledge of the research and evidence on corporate tax cuts expected that such a large rate cut from 35% to 21%  would actually increase corporate tax collections. The best that can be said about the impacts of a large corporate tax cut is that it will lose less revenue over time. That doesn’t mean that a tax cut will always result in an absolute decline in revenues, although that has clearly been the case with the recent U.S. tax cut.  Revenue can still increase with a small rate cut even though revenues may be lower than they would have been had rates not been cut .  That is the case with New Hampshire’s very modest, recent cuts in business tax rates.  Business tax revenues (for the most part) continued to increase in NH but at a slower rate of growth  after the cuts where enacted.

New Hampshire is expected to have a more than $100 million budget surplus by the end of fiscal year 2018.   New Hampshire risks drawing two inaccurate conclusions from this  surplus and the recent sharp increase in business tax collections that is largely responsible for it.   First, that the small drop in 2017 in the state’s business profits tax (BPT) rate from 8.5% to 8.2%, and business enterprise tax (BET) from 0.75% to 0.72%, is responsible for the recent large increase in NH business tax revenues and subsequent state surplus.  Second, that a larger rate cut would produce even more business tax revenue and perhaps an even larger budget surplus.   Again, the rate cuts were needed but NH should understand that the rate cuts have not, and will not in the future, lead to a surge in business tax revenue.  If NH’s business tax cuts had actually produced more revenue (than if rates had not been cut) the growth rate of business tax revenue would have increased following the rate cuts.  In fact, the growth rate in business tax collections declined after NH’s rate cut took effect for tax periods beginning after December of 2016. That is until the federal government lowered its corporate tax rate.  Again, it’s not that business tax collections actually declined, the U.S. and NH economy were strong and profits were increasing,  it’s just that NH, by marginally lowering tax rates, decided to capture a little less of those profits and thus the growth rate of business tax revenue declined.

NH Business and other source Revenue Growth

The figure above shows that the annualized growth rate in NH’s business tax revenues declined throughout much of 2017 (although the final months showed some modest reversal of the trend). Annualized revenue growth jumped dramatically, however, in the first four quarter of 2018, after the cut in the federal corporate tax rate.  The chart also shows that the growth rate of NH’s seven largest sources of general revenue – other than the BPT and BET – that are dependent upon economic conditions and economic activity in the state (meals and rentals, liquor commission revenues, tobacco, real estate transfer, communications services, interest and dividends, and insurance taxes) are growing much more modestly, below the trend from recent years, and certainly not enough to produce a $100 million plus budget surplus.

Clearly business tax collections are responsible for NH’s large budget surplus, but it  is not accurate to say that the increase in business tax collections reflects a “booming NH economy” as many in the state argue.   NH’s economy is strong but not exactly “booming” (1.3% year-over-year job growth ranking 21st nationally, and 1.9% GSP growth ranking 26th) and not nearly strong enough to produce the kind of business tax revenue growth that the state has seen in recent months.  Excuse this brief sidetrack (it is a pet peeve) but don’t assess growth in NH’s (or any state’s) economy  on the basis of a state’s unemployment rate.  Hawaii, at 2.1%, currently has the lowest unemployment rate in the nation followed by NH and North Dakota tied at 2.6% – but here is the thing, over the past year the North Dakota economy has lost 1.3% of jobs (the worst growth rate in the nation), while NH added 1.3% more jobs (21st among all states).

State Unemp. and Job Growth

The same is true when state unemployment rates and the annual growth in state gross state product (the broadest measure of economic growth) are plotted (chart below).  In 2017 NH tied with Michigan for 25th among states for growth in gross state product (at 1.9%),  despite NH having a 2.6% unemployment rate while Michigan’s rate is 4.7%.  The scatter plots above and below urge caution in using unemployment rates to gauge economic growth in a state,  especially now that slow labor force growth is contributing to low unemployment rates and acting as a binding constraint on economic growth in many states.

State GSP Growth and Unemp

Growth in NH’s business tax revenue has historically tracked private sector employment growth in the state.  To show just how unusual the recent growth in NH’s business tax revenue is in relation to job growth in the state look at the following chart which shows how far, by historical measures, the recent growth in revenues has outpaced NH’s private sector employment growth.

Nh Business Taxes and Emp. Growth

Private sector job growth has picked up in recent months (defying reported growth in the size of NH’s labor force –  and suggesting to me that NH may be (re)capturing some of the state’s labor that has been working outside of NH – but more about that in a future post).  However, growth in business tax revenue has far exceeded that which historically accompanied similar rates of job growth.  Changes to federal corporate tax laws are a primary reason for the out-sized boost in NH’s business tax revenues, so whatever you think of the recent federal tax reform you can thank the feds for their role in creating NH’s current budget surplus.  The NH Department of Revenue provided lawmakers with a briefing on what tax reform could mean to NH’s revenues but they were rightly cautious in making a dollar forecast of impacts.  But a summary of their analysis of impacts suggests that more of the provisions of federal tax law will increase rather than decrease NH revenues.

The impact on NH revenues of federal corporate tax collections is also apparent when comparing annualized growth in federal corporate and NH business tax revenue in recent years.  The chart below shows how dramatically different are the most recent trends in business tax revenue growth at the federal and NH state level.  In addition,  surprisingly (to me at least), this inverse relationship seems to occur over the longer-term as slower growth in federal corporate tax collections since the recession are associated with higher growth in NH state business tax collections (and vice versa), despite the fact that economic growth in NH lagged U.S. growth during much of the recovery from recession.

Federal and NH Business Tax Growth

I have argued in prior posts that lawmakers should be cautious in budgeting because revenue growth in NH, although growing, was growing  more slowly.  I did not foresee a $100 million budget surplus but who did, and who knew what the impact of federal tax reform would be.  No public hearings or discussion of the federal tax reform proposal were held and in any case nobody was certain whether changes in corporate tax laws would pass.  Growth trends in most of NH’s key sources of state revenue have been modest even as federal tax reform quickly and dramatically altered NH’s business tax revenue trends, greatly improving the state’s fiscal position in the process.   I believe that fundamental underlying revenue trends still argue for caution in state budgeting, but when the federal government’s actions contribute to a state surplus NH is happy to say “yes please and thank you.” Lawmakers would be wise , however, not to assume that cuts in the state’s business taxes are responsible for the growth in state tax revenues or that larger cuts will add to the surplus.

The Best of Times, The Worst of Times

February 16, 2018
“It was the best of times, it was the worst of times, it was the age of wisdom, it was the age of foolishness, it was the epoch of belief, it was the epoch of incredulity, it was the season of light, it was the season of darkness, it was the spring of hope, it was the winter of despair.”
– Charles Dickens, A Tale of Two Cities

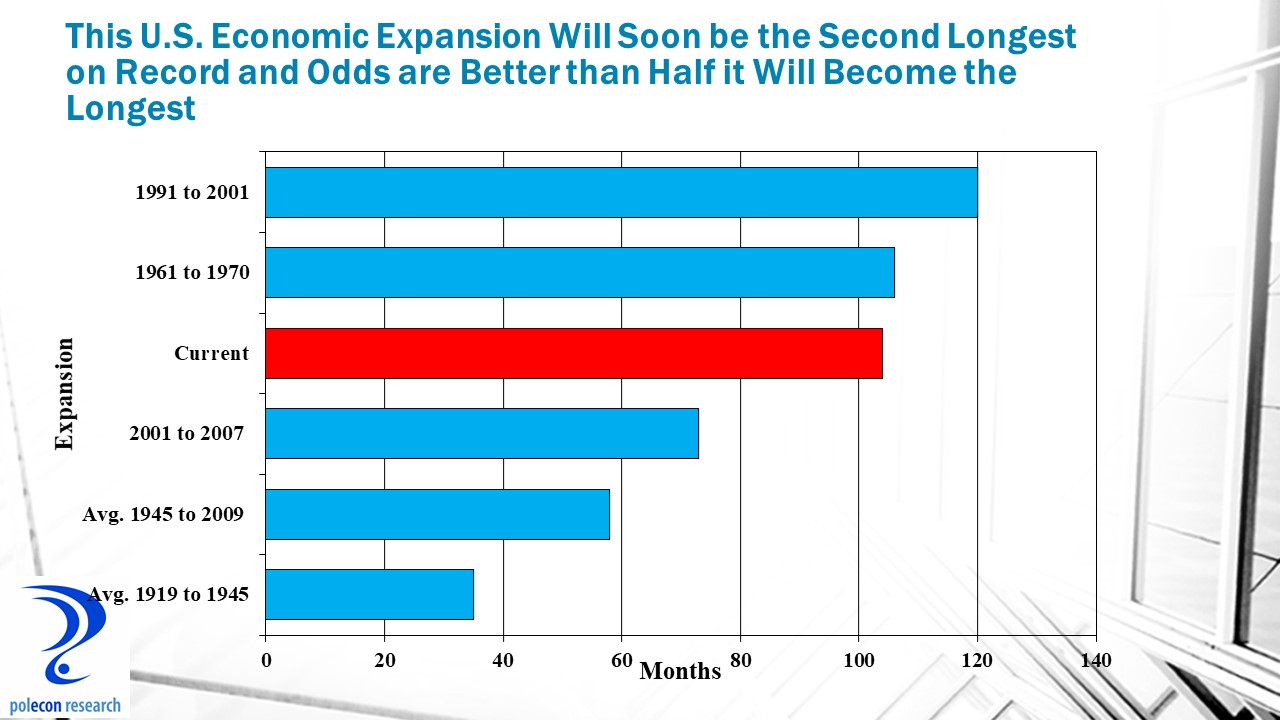
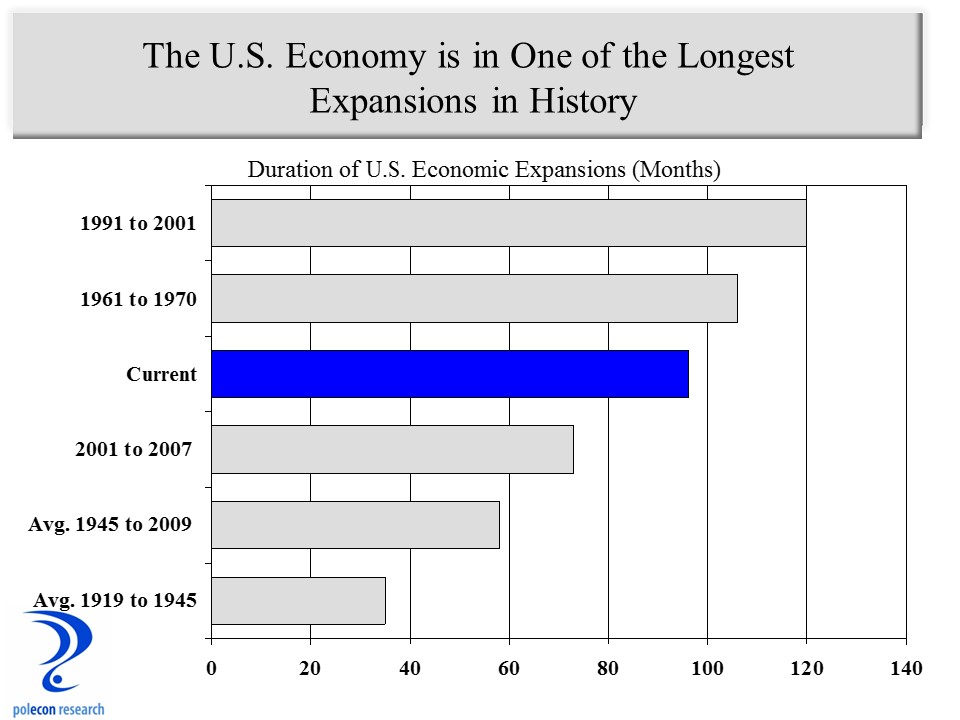
The U.S. economy is currently in the third longest period of uninterrupted expansion in its history, soon to be the second longest, and there is a better than even chance it will become the longest in history 16 months from now.  Even without the recently enacted deficit-financed stimulus (tax cuts and expenditure increases) the U.S. economy was on solid ground, with growth forecast to be stronger in 2018 than it was in 2017. That is what makes lack of concern over the projected increase in the government’s annual deficit from about $700 billion to $1 trillion especially troubling.

Expansion

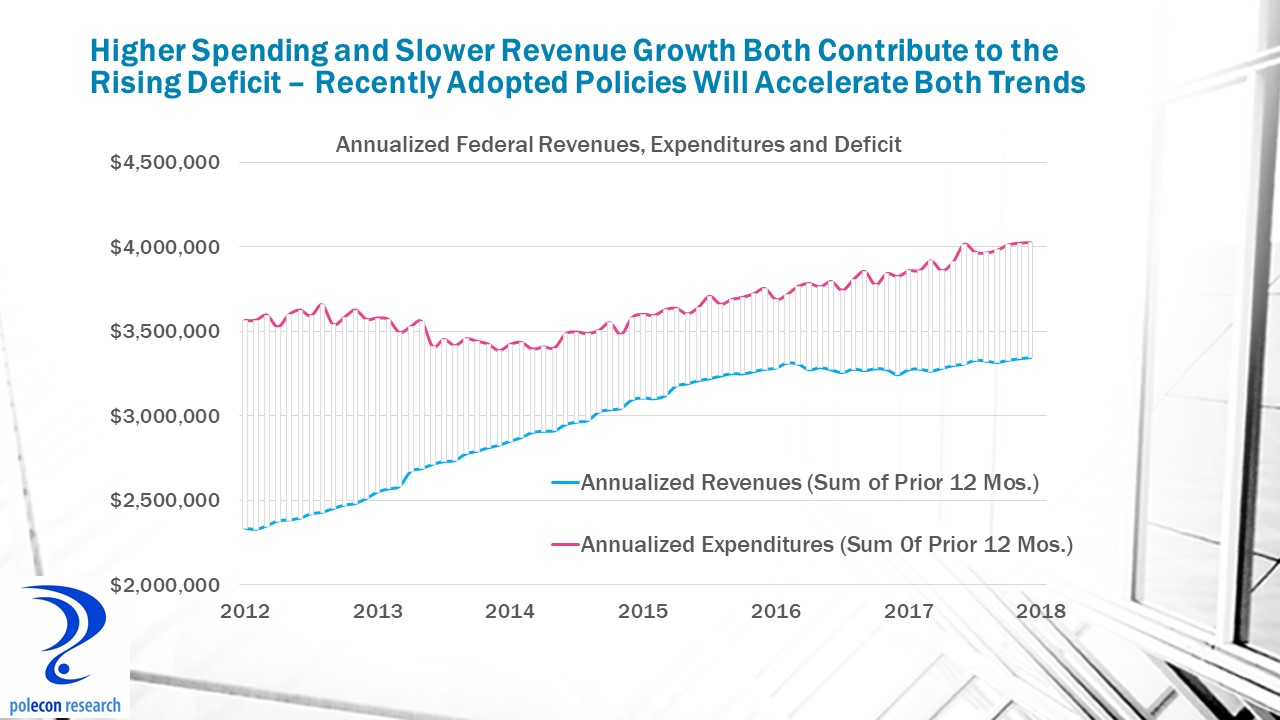
The current economic expansion is exceptional in duration and atypical in gaining strength late in the economic cycle.  But it is also about to become notorious for producing a burgeoning federal deficit during a period of solid economic growth (annual federal deficits are generally inversely related to economic conditions).  So the price of  stronger growth and a longer expansion is looking like higher annual budget deficits (forecast to grow from 3% of GDP to 5% just by 2019) and a national debt that will grow from about 76% of GDP to 97% over 10 years, risking longer-term economic growth.  It is a high price to pay for a small increase in economic growth and a fiscal policy gamble to add stimulus to an economy near full employment but it is  price that the administration and congress are willing to pay without hesitation.

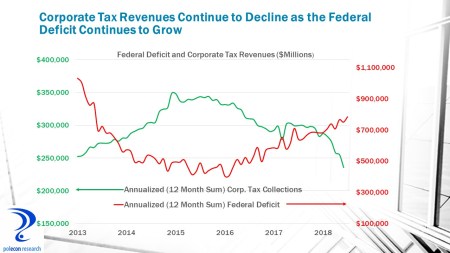
Annual deficits declined between 2012 and 2016 as the economic recovery strengthened and costs associated with the “stimulus” eroded.  But since early 2016 deficits have been increasing.  The difference between monthly revenues and expenditures over the most recent 12 twelve months (between February 2017 and January 2018) shows that the annualized federal deficit stands at $682 billion compared to $585 billion for the February 2016 to January 2017 time period, a 17% increase over the year and up from a low of $405 billion early in 2016.

Deficit

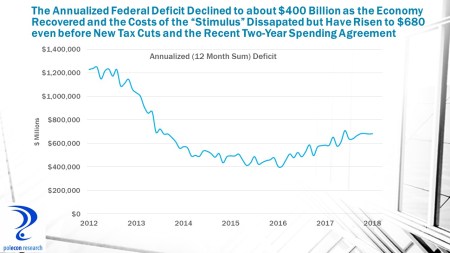
The increase in the deficit results from both higher spending and a slowing rate of revenue growth (chart below), and it comes before the impacts of recently enacted tax cuts and the two-year spending agreement take effect that will both lower revenues by about $1 trillion over the next decade (even after accounting for growth effects) and increase spending by about $300 billion just over the next two years.

Spending and revenues

The U.S. has had higher annual deficits in the past, but always during a period of weak or negative economic growth.  Increasing deficits and greatly adding to the nation’s debt in the absence of an economic downturn should have been a giant caution sign for lawmakers.  If  $400 billion annual deficits were “crippling” our economy in 2016 (as some lawmakers suggested) how are $1 trillion deficits in a growing economy not of more concern?  Debt is often the match that lights the fire of economic crisis, whether the fault was with politicians, central bankers, overzealous consumers, businesses, developers, bankers, credit rating agencies, regulators, or any combination thereof, all true crises involve too much leverage.

With that admonition (screed?), reducing the corporate tax rate was still a good idea, the U.S. rate was too high. And yes, a lower corporate tax will raise wages eventually (lower taxes increase capital investment and improve productivity – raising wages), but only after years, and certainly not in the time frame suggested by the White House. But just as important (and largely a missed opportunity in the legislation) was the need to eliminate targeted and industry-specific preferences that direct too much investment to tax-favored activities rather than to their most productive uses.  Many of the agreed upon expenditure increases also have merit.  Overall, however, the combination of tax and spending policies recently enacted seems poorly structured and ill-timed.  If we enact a deficit funded stimulus when we are near full employment and when the economy is already poised to grow more rapidly, what will we be able to do when the next recession arrives?

Impact on State Finances

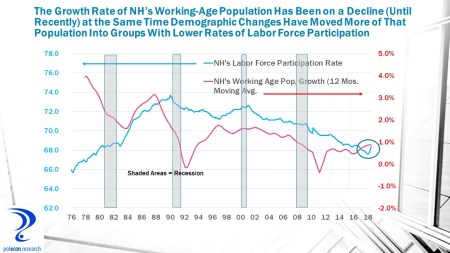
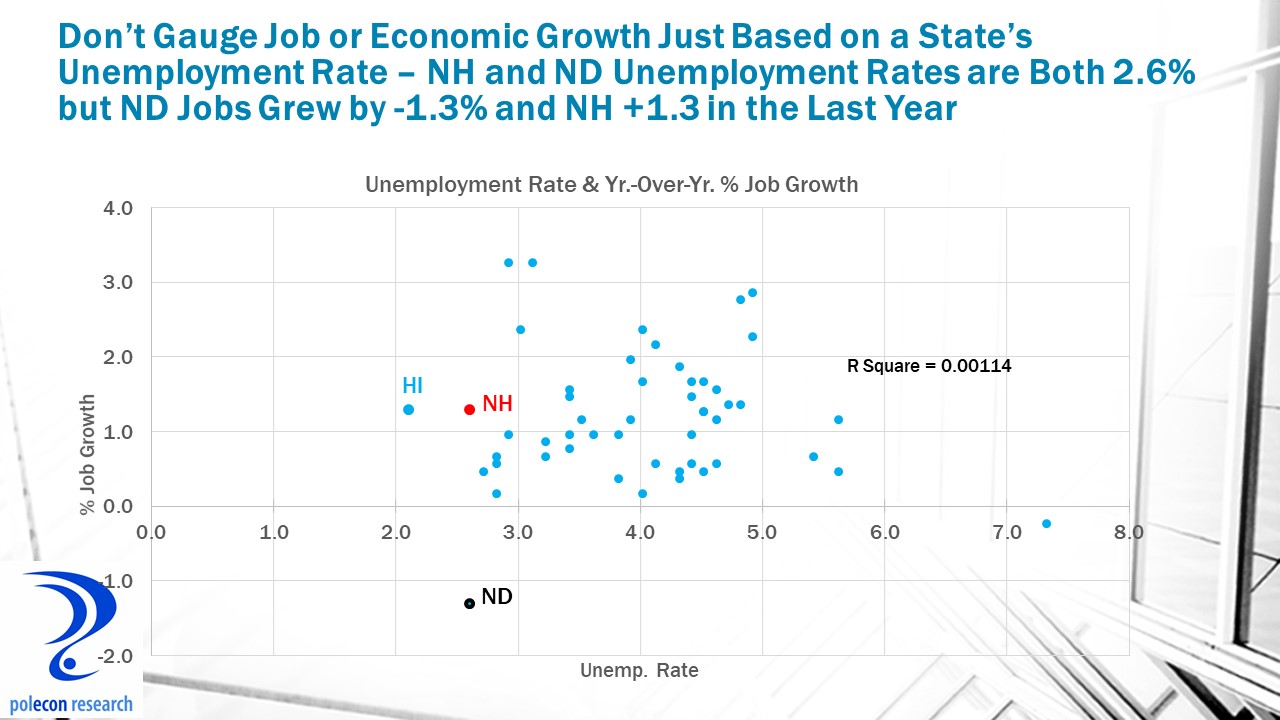
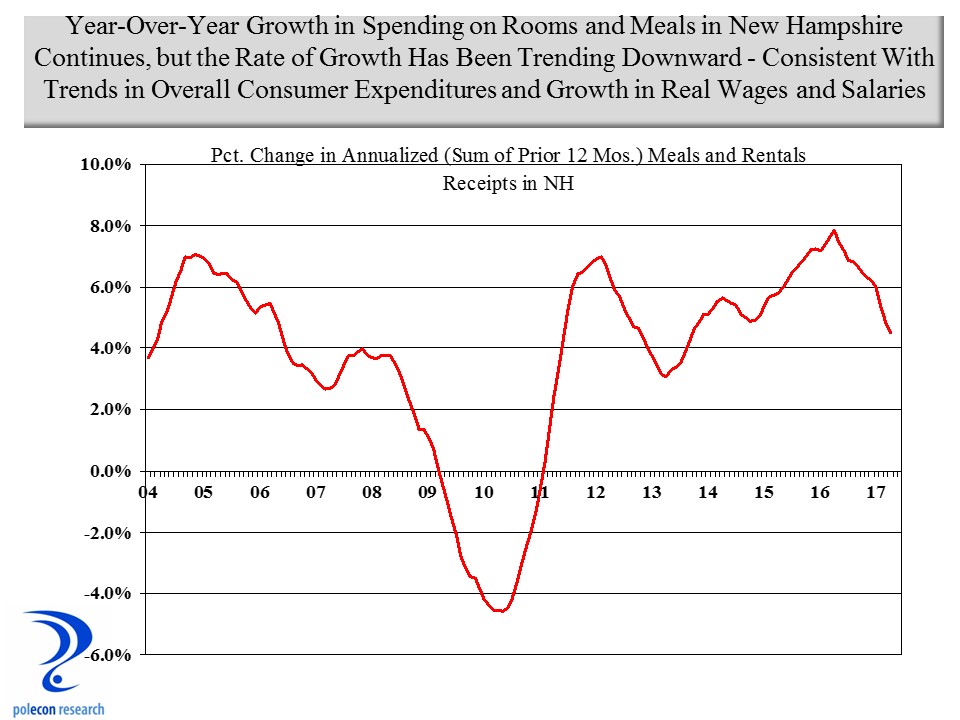
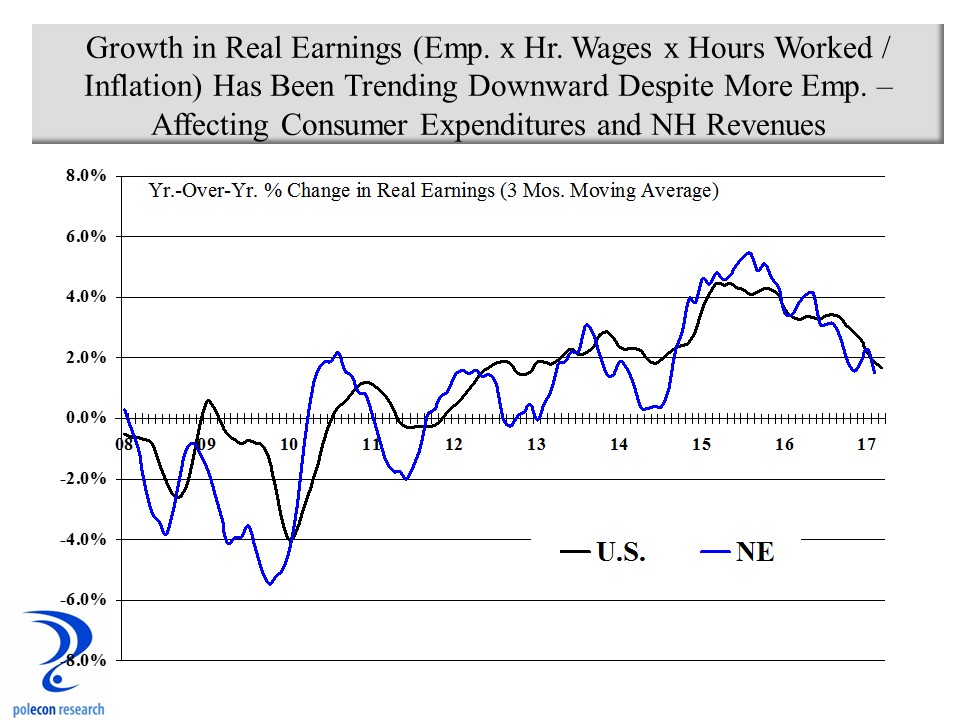
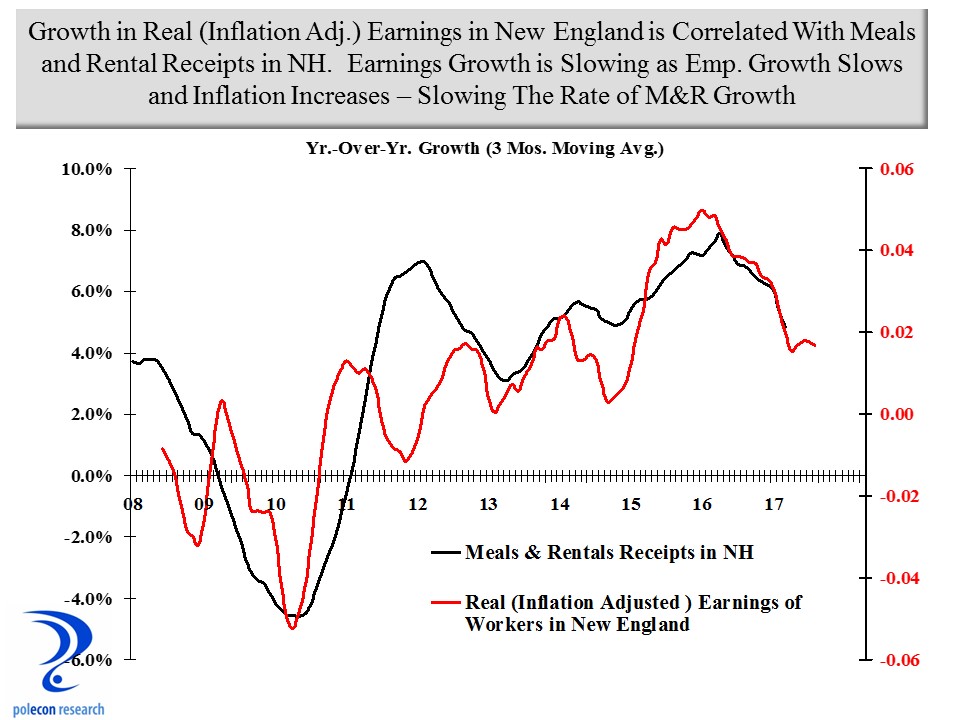
The New Hampshire economy is fundamentally strong, our industries are as vibrant and innovative as ever and the state’s economy would be growing and producing more if the supply of labor could accommodate more growth. It can’t, labor force growth is not keeping pace with labor demand and economic growth has been slowing in New Hampshire for at least two quarters. It will continue to do so in 2018. So too will state revenues.

Job and LF Growth

State-level GDP estimates produced by the U.S. Bureau of Economic Analysis are reported with a long lag and are not a very timely indicator of current state growth trends.  A useful proxy for assessing growth trends in state-level GDP is aggregate hours worked in the state (employment times the average number of hours worked) which correlates well with changes in the state’s total output of goods and services (GDP).  Adding current estimates of U.S. productivity growth (there is no similar state-level measure) provides a high-frequency estimate of the state’s GDP growth trend.  As the chart below shows, the growth rate of NH GDP is declining, again, primarily because the rate of employment growth is declining.  When you are adding fewer workers the output of the state’s economy will grow more slowly unless there is a significant increase in productivity (it has increased some but not significantly).

Aggregate Hours Worked

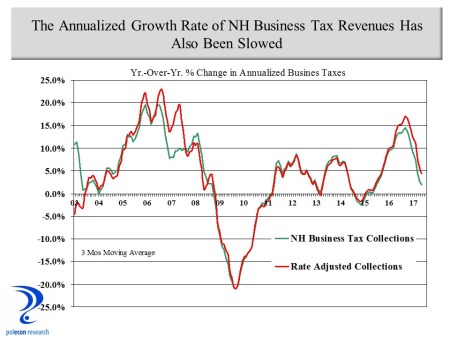
Slower employment and economic growth in NH (along with changes in revenue policies) have slowed the rate of revenue growth in the state since 2016.  There has been a bump in the past few months but how the recently enacted tax cuts at the national level will affect the trend is uncertain.  What is certain is that the growth constraints NH faces will make it difficult to accelerate economic growth in the state and thus state revenues.

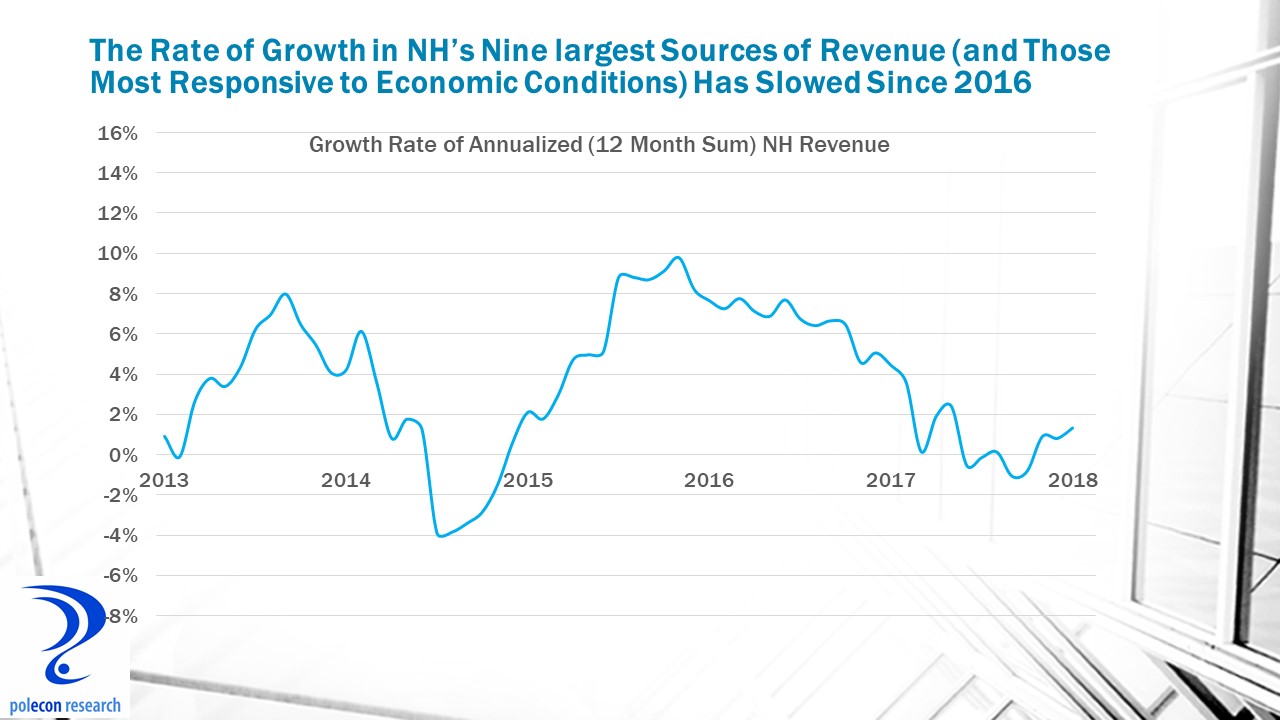
Looking at annualized revenue growth (summing any 12 month period), the chart below shows that revenue from NH’s nine largest sources of general revenue (and the sources most affected by economic trends) hit a plateau in 2016, at a time when employment growth was at its post-recession peak.  Since that time, annualized growth in the revenue sources most affected by economic conditions has slowed.

Revenue

 Looking at the rate of change in annualized state revenues illustrates the longer-term slowing of the rate of annualized growth.   The chart below shows how significantly the growth rate in revenues has slowed since 2016.

Revenue Growth Rate

Expenditure Pressures Will Mount

The impact on state revenues of recent changes in federal policies may be uncertain but their impact on state and local government is likely to add to the state’s fiscal pressures.  A great deal of uncertainty exists over how funding for state-operated programs that share costs with the federal government will be affected but most signs point to less funding for programs like Medicaid and infrastructure.  The administration’s recently announced $1.5 trillion infrastructure proposal actually reduces funding for states while calling for greater state commitments.  Proposals to cap or block-grant Medicaid funding would significantly add to the fiscal pressures facing all states.  At the same time mandatory spending on things such as government pensions are poised to increase significantly in coming years.

Other recent federal policies will affect states and localities by increasing the cost of borrowing.  One change eliminated the tax-free status of “advance refunding bonds” that allow states and communities to refinance debt at lower interest rates well before their call date in order to free-up funds for other purposes.  The prospect of annual deficits of more than a trillion dollars (placing greater demands on credit markets) during a strong economy when deficits typically fall, has also increased expectations of higher interest rates, increasing the cost of borrowing by governments, households and businesses.  How fast and how much rates rise is not certain but they have already increased significantly this year (albeit from low levels.)

Less directly, federal tax law changes will affect the borrowing costs of state and local governments by making municipal bonds less attractive (relative to other loans and investments).  Banks and insurance companies are big buyers of municipal bonds – lending money to state and local governments.  The interest rate that governments have to pay on those bonds is lower than on other types of loans made by banks because banks and insurance companies do not have to pay taxes on the income they earn from loans to governments.   The drop in the corporate tax rate reduces some of the advantage of the tax- free bonds and makes other loans/investments made by banks and insurers more attractive relative to municipal bonds.  Interest rates on municipal bonds will have to rise to remain competitive with other loans.

Along with slower growth in state revenues there are enough spending pressures building along with potential impacts from recently enacted federal policies to suggest  lawmakers in the state would be wise to be cautious in the next budget cycle that begins in the fall of this year.

The divergence between economic and fiscal conditions doesn’t seem to be troubling to many policymakers at the federal or state level.  With apologies to Dickens, it does feel like “it was the best of times, it was the worst of times.” Let’s hope that it isn’t also becoming “the age of foolishness.”

Business is Aging Faster Than the Population

August 24, 2017

The U.S. economy is in a constant state of churn. New businesses are being created while existing businesses quit or fail. This dynamic process can be disruptive as new technologies, firms, and industries replace older ones, but it is not destructive, it enables increases in productivity and spurs economic growth. In a dynamic economy with lots of churning more productive firms drive out less productive ones, new entrants disrupt incumbents, and workers are better matched with firms. A dynamic economy constantly forces labor and capital to be put to better, more productive uses. Historically the dynamism of the U.S. economy is an important ingredient that distinguished our country from many slower growth (or stagnating) industrial economies. New Hampshire and the New England region have been especially dependent on economic dynamism as the region typically loses industries to regions or nations that have lower business costs once industries mature and become more standardized. High rates of new business starts fuel dynamic economies. Unfortunately in NH and in all other states the rate of new business starts is in long-term decline.

For most of the past few decades far more businesses in NH and most states were started then either quit or failed. More recently, the gap between a large number of business starts and a smaller number of quits or failures has been narrowing. Briefly, during the great recession, more businesses quit or failed in NH and the U.S. than were started.

New Firms and Exits

Except for an uptick during the “great recession,” business quits or failures have occurred at a pretty consistent rate over the past several decades. What has narrowed the gap between the number of new firms and the number of quits and failures has been a decline in the rate of new business starts in New Hampshire and the nation. The chart below shows that new firms (less than one-year old) accounted for less than 7 percent of all New Hampshire firms in 2014, down from 15 percent in 1988. A similar decline occurred in the country as a whole.

New Firms as a % of all Firms

The decline in economic dynamism implied by lower rates of business starts is contributing to our nation’s slower (by historical standards) productivity growth. Although labor force constraints are a primary culprit, lower rates of new business starts also contribute to slower employment growth, as fewer new business replace those business that quit or fail.

A recent study by Dun & Bradstreet American Express and recent data released by the U.S. Census Bureau show that larger businesses have been creating jobs at a faster rate than small businesses (less than 20 employees) in recent years, including in NH.  A very good business reporter in NH asked for my thoughts on these findings for an article he was writing.  In the article I note that the decline in entrepreneurial activity was a more important factor explaining slower job growth among smaller firms than was business size.  The age of businesses is an “intervening” variable between the apparent relationship between size of businesses and job growth, as new business typically start small. Simply comparing the percentage of jobs added by smaller and larger firms in NH would miss the job growth implications (among the small business category) of the declining rate of new business starts. New business starts account for a significant percentage of job creation in any year and a decline in business starts hurts job growth among  the category of small (under 20 employees) businesses.   The chart below shows that new firms less than one-year old accounted for about 8 percent of all private sector jobs in NH in 1984, by 2014 that percentage was down to 3 percent, a more than 60 percent decline.  From over 30,000 jobs at startups in the mid-1980s, the number of employees at startups averaged less than 18,000 between 2012 and 2014.

Jobs and % of Jobs

Today it is impossible to enter any analysis of the economy that isn’t interpreted through some ideological lens. Making it easier for entrepreneurs to start and operate a business without excessive regulatory burdens and allowing entrepreneurs to keep more of the rewards of their risk taking may seem like an ideological prescription but it just makes sense to incent more new business formations.  However, a bigger problem may be that too often regulations, laws and the political process favor older, more established technologies, businesses, and industries and look to protect and preserve the past rather than enable future technologies and industries.

Economic cycles produce temporary declines in entrepreneurial activity.  Recessions don’t make it easy to start a business but the nation’s longer-term decline in entrepreneurial activity spans economic cycles. One of the more troubling aspects of recessions is that by reducing startups and killing-off many younger firms they shrink the pool of new business from which the next generation of growth companies could emerge.  Younger firms that survive for a number of years tend to grow faster than older firms so a smaller number of new and surviving firms impede future job growth and make it harder to recover from recessions. By impeding business starts for several years (well after the recession ended) the less visible but longer-term impact of the “great recession” will be a smaller generation of the next growth companies.

Still, structural factors in the economy are more problematic for longer-term trends in business starts.  Primary among them is demographics.  There has been a lot of attention focused (often inaccurately) on the demographics of NH’s population but not enough on the demographics of its business population, even though the two are related.  Just as declining birth rates in NH’s population is the primary factor accounting for the aging of the state’s population (not the movement of young people out of the state), a decline in the rate of new business formations is rapidly aging the population of NH businesses.  In fact, the population of NH’s businesses is aging faster than is the state’s population, potentially reducing the economic dynamism that characterized the state’s vibrant economy during much of the 1980s and 1990s.  With an increasing percentage of the state’s workforce above age 50, entrepreneurial risk taking can be expected to slow and as the chart below shows, the percentage of businesses in NH that have been in business for more than 15 years rose rapidly between 2003 and 2014 (the most recent year for which data is available).

Aging of Business

Millenials are a generation that is larger than the baby boom generation and as they become established in the working world they could reverse the trend of declining entrepreneurism.  But today individuals are changing jobs at ever lower rates, suggesting a tendency to prefer security over opportunity and risk.  Millennials are also a generation that is burdened by higher debt levels when they enter the work world, that delays or eschews homebuying, marriage and having children, will they be a generation of risk takers that revive entrepreneurism in NH and the nation?  I hope so because a dynamic, high productivity U.S. and NH economy depend on it.

Great Expectations

June 6, 2017

“Take nothing on its looks; take everything on evidence. There’s no better rule.”        

    Mr. Jaggers to Pip,  in Charles Dickens’ “Great Expectations”

Optimism in the U.S. economy has been high for most of 2017.  Consumer and small business confidence are both higher than they have been in a decade  and according to the Business Roundtable the CEO’s of America’s largest corporations haven’t been this optimistic in eight years.

Sentiment

From survey data alone the U.S. economy appears to be booming.  But the hard, quantifiable data (1.2 percent GDP growth in the first quarter of 2017) tells a story of more tepid growth.  The degree of divergence between soft (survey and sentiment data) and hard economic data is striking and either consumer and business sentiment will lead to higher rates of growth or sentiment will begin to wane – something has to give and my money is on the latter.

The divergence between sentiment and actual economic performance can be especially problematic for lawmakers crafting state budgets.  With so much economic optimism it is easy for those urging caution in budgeting (based on expected revenue) to be the skunks at the garden party. I don’t know who has the best revenue estimates on which to base NH’s next budget but the trends I see (and present later in this post) urge caution in assuming current levels of consumer and business optimism will be matched by revenue growth.

Still, the economic recovery remains on track (albeit at a modest pace by historical standards) and it has a better than 50/50 chance of becoming the longest expansion in U.S. history by lasting into the middle of 2019.

Length of recovery

The current expansion is getting old but expansions don’t die of old age; something kills them (think the savings and loan crisis in the 1980s, the dot com bubble in the early 2000s, and the mortgage and financial crisis of the recent recession).  Right now, the economy does not seem to be harboring the kinds of excesses and imbalances or overindulgence that have presaged sharp slowdowns or recessions in the past. There are some areas of concern; at more than 20 times earnings, stock market valuations (depending on which index is used) are well above the 15-17 time earnings that is the historical average, but this is not at the “irrational exuberance” stage.  Economists tend to write-off or disbelieve negative economic data as statistical anomalies or due to temporary factors prior to slowdowns and lately a bit more of that has been occurring than I am comfortable with.  But even as there are some unflattering economic indicators that should be acknowledged they are still too new to be trends.  No one is saying the “r-word” and the best we can say today is that we are one day closer to the next recession.

There is no more important task for policymakers than estimating revenues. Underestimating state government revenues results in more needs being unmet than is desirable, while overestimating revenues can lead to difficult and painful spending cuts in later years. So why should NH lawmakers be cautious in their revenue estimates in a time of optimism and apparent abundance?   As Dickens (Mr. Jaggers) would say “take nothing on its looks; take everything on evidence.”   In the case of state government revenue the “looks” are reports of a booming economy and high confidence while the “evidence” is real trends in revenue growth.   Analysis and empirical evidence are not currently in favor as tools for governing, at least at the national level, but the great majority of lawmakers in NH value data and evidence and do their best to employ rigor in the budgeting process.  But a focus on monthly revenue reports and numbers can sometimes make it difficult to separate the signal from the noise in the revenue trends. In addition, while it is important to note how actual revenues compare to “planned” revenues on a monthly basis, revenues can meet “planned” expectations at the same time they are signaling a weakening trend.  Thus it is possible that lawmakers can be optimistic that revenues meet or exceed expectations in any month at the same time revenue growth is slowing.  Which is the more important trend?  When I look at the larger trends in state revenue collections from NH’s nine largest sources of own source, general revenue, I see a slowing growth trend even as revenues have generally met monthly expectations.  The chart below shows the year-over-year percentage change in annualized (sum of prior 12 months) state revenue collections.

Annualized NH revenues

Examining NH business tax collections reveals a similar trend of a declining rate of growth.   The chart below shows the rate of change in annualized (sum of the prior 12 months) business tax collections, along with the trend in rate-adjusted revenue to control for the impacts of rate changes on growth rates.

Annualiz NH Business Taxes

The growth rate of meals and rental tax collections in NH (more commonly called meals and rooms) has also slowed.  The chart below shows annualized growth in spending on meals and rooms in NH.  Because the data shows spending on meals and rooms rather than tax collections the data is free from any changes related to tax rates.

Meals and rooms trend

Many factors influence rooms and meals and hospitality expenditures in the short-term (weather, gasoline prices, etc.) but the most fundamental factor that determines longer-term (longer than month-to-month) trends in meals and rooms expenditures are employment and earnings trends in the state and New England region.  Employment continues to grow but at a somewhat slower rate as the nation and the region confront full-employment and labor shortages. Wage growth is occurring but prices are also rising and as the figure below shows, real (inflation adjusted) earnings growth has been trending downward in the U.S. and New England (the same is true for NH).  The result is that the rate of growth of consumer expenditures, in almost all expenditure categories, has slowed.  The chart below presents an estimate of trends in the growth of real earnings (employment times the average hourly wage times average number of hours worked and adjusted for inflation) in the U.S. and New England.  The earnings of New England residents and their ability and willingness to spend have a significant impact on several NH revenues.

Real Earnings Growth

The relationship between spending on meals and rooms in NH and real earnings in New England (lagged) is evidenced in the graph below.

M&R and NE Earnings

I don’t know who is more accurate in estimating revenues in the current debate over the state’s next budget.  There is a case to be made for different expectations.  As long as policy decisions are made based on some empirical interpretation of trends in the economy and revenues rather than an ideological push for more or less spending I think the state will be fine regardless of what lawmakers decide.  I am frequently in error but rarely in doubt and I’ve presented one of what are many interpretations of revenue trends in NH.  Despite what I see as a lot of unmet needs in the Granite State, the trends highlighted in this post urge caution in pillorying anyone who argues for fiscal restraint at a time of so much economic optimism.

“But NH Isn’t Dead”

November 17, 2016

There is a scene from the movie “Monty Python and the Holy Grail” where a wagon stacked with bodies is being pulled through a plague infested medieval village while a crier calls out “bring out your dead.”  The comedy in that grim scene comes when a man tries to load a body slung over his shoulder onto the wagon and against the protests of the still quite alive “dead man” who says such things as “but I’m not dead,” I’m feeling better,” and “I think I will go for a walk.” I am reminded of that movie scene every time I hear proclamations about NH being the 1st or 2nd oldest state in the nation.

An excellent radio program in NH (especially  when I am guest – I wasn’t on this broadcast) recently spent an hour discussing the implications of NH being “the second oldest state in the nation.” The operational definition of “second oldest state” was never given but I assume it is based on the median age of the state’s population.  Using 5 year Census Bureau estimates (2010-14) NH has the third highest median age of any state in the nation (collective gasp here), behind only Maine and Vermont.

median-age

Before administering the sacrament of the anointing of the sick to New Hampshire, however, understand that a state’s median age says relatively little about the age distribution of a population and even less about the demographic and public policy challenges (and their severity) that a state will confront in the future.  Does NH’s high median age really mean our state is worse off demographically than 47 other states?

First, a high median age doesn’t mean NH has a disproportionate number of elderly residents.  It does mean, and has for some time, that NH has a high percentage of residents in the middle of the age distribution and fewer at early ages. As the chart below shows, on the percentage of the population age 65+, NH ranks 15th among all states and below many states with a lower median age.

age-65

Second as I argued here, if you want to understand the strains that an older demographic may place on the fiscal system of a state or a nation you need to look at the “old age dependency ratio,” or the number of older residents in relation to the number of working-age residents because that is a measure of the population that will largely be paying for or supporting the services for the older population.  There will be more elderly in NH and that will increase service needs but the fiscal pressures those needs place on the state is a function of both the number in need of services and the number of working age individuals supporting the services (that is why China’s “one-child” policy that results in  four grandparents, two parents, and one child was always a demographic ponzi scheme).   The old-age dependency ratio is rising in NH but again, on that metric, NH hardly looks  that much worse off than most states as it is firmly in the middle of all states on the ratio of residents age 65+ to working age residents.  In addition, because NH has relatively healthier and more well-off older residents compared to many states, our dependency ratio probably slightly overstates the challenge the old-age dependency ratio presents to the state. With NH’s lowest in the nation birth rates the old-age dependency ratio could rise rapidly depending on migration trends (as has been the case in recent years) and is one more reason to want to make our state broadly appealing to demographic groups.

dependency-ratio

NH does face significant demographic challenges and if overstating their magnitude is necessary for action to address them then I guess I can live with that.  But too often the discussions of the demographic challenges facing NH are laced with agenda driven diagnoses and  prescriptions that make for great headlines but ineffective policies.

Low birth rates (NH now has the lowest in the nation) resulting from high labor force participation and levels of educational attainment among women in NH (a sign of our state’s successes not our failures) along with low mortality rates among an older population that is both healthier and wealthier (on average) than in most states, is a recipe for a higher median age in a state.  That is unless median age can be made more stationary through the in-migration of younger residents, or as NH has traditionally done, in-migration of residents more in the middle of the age distribution along with their children.  That was exactly NH’s recipe for success for decades even as young people have left the state (a decades long trend in NH), at least until net state-to-state migration slowed in NH, just as it has been slowing nationally for some time.   Between 2010 and 2015, the Census Bureau estimates that about 5,500 more NH residents moved out-of-state than residents of other states moved in, with about 6,700 more moving out of Hillsborough County than moved in, while about 4,500 more residents moved into Rockingham and Strafford Counties than moved out during that time.  The graphic below disputes the notion that NH is no longer a place that people want to locate, they are just being more selective in where they choose to locate in the state.  Examining the differences in population growth and demographic changes among individual communities within these counties  further suggests some of the factors that can contribute to in-migration and inform public policies that seek to address NH’s demographic challenges.  Not all communities experienced the growth or decline in migration characteristic of their counties.  Understanding why  is important to the future of our state and its communities.  It is more than just nearby job opportunities or Hillsborough County would not have seen so much out-migration.  I have written about some of the factors in prior blog posts.

county-migration

Many communities are aging more slowly than the state as a whole and their experiences are illustrative of some of the factors and actions that can influence the age structure of a state or a community. Yet policy discussions about demographics at the state level typically overlook positive demographic trends in many communities in the state.  Below is a chart that highlights how the median age has changed over two decades in just a few NH communities.  The chart shows the median age of each community in 1990, and then incrementally adds how much the median age has changed in each of the following two decades.  There was relatively little difference in the median age of each community’s population in 1990, but especially in the 2000 to 2010 decade, the rate of change in median age varied significantly among the communities.  Communities such as Portsmouth, which had a relatively high median age until 2000, slowed its rate of “aging” dramatically in the 2000s, as did Dover and Manchester, albeit for different reasons and with different demographics.

community-median-age

The point is that if some regions and some communities in NH can rage against the dying of the light, others and maybe even the state as a whole, can as well.  So, while many want to heap NH onto a metaphorical “death wagon,” let me say “but NH is not dead, I think we should go for a walk today”.


%d bloggers like this: