Archive for the ‘Tax Revenue’ category

Funding Roads and Bridges to Perdition

March 25, 2013

Gasoline taxes, road tolls and highway infrastructure spending are issues at the forefront of a lot of heated debates in state legislatures across the country.  I am going to write about the issue a couple of times this week.   Some lawmakers want to raise sales or other taxes to pay for infrastructure and others want to increase gasoline taxes and other “user fees” to pay for it.   The highway infrastructure spending and revenue issue can illustrate classic principles of sound fiscal and economic policy so it is too bad that the debates have generally taken the “low road” by framing the issue almost entirely as either one of “who wants to raise taxes and who doesn’t,” or “who wants to makes roads and bridges safe and who doesn’t”.

User fees are a good thing and it is sound fiscal policy to have the users of roads pay for them via gasoline taxes, road tolls, and other fees that reflect an individual’s usage of roads and bridges.  When general revenues are used to pay for roads and bridges people who don’t necessarily use them wind-up paying for a portion of highways and subsidize the usage of roads of those who travel them a lot.  When you subsidize something you can bet you are going to get more of it than you would have gotten without the subsidy and in this case that means more travel on roads which, of course, means there will be more need for roads and spending on roads and that means more subsidy and that approach is surely a road to perdition.

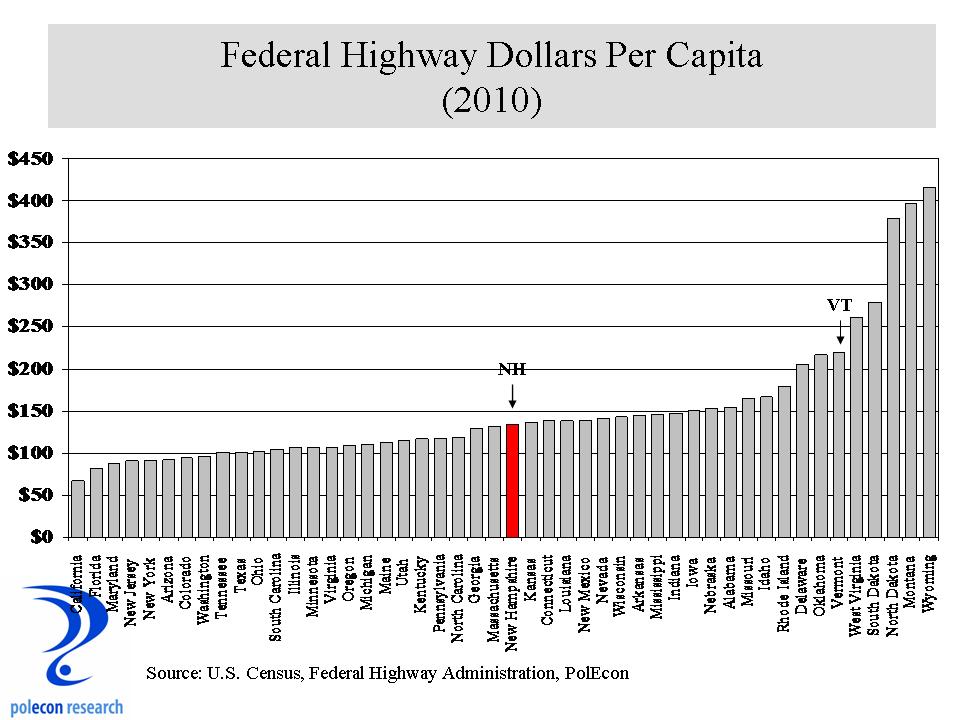
It was nice to see New Hampshire rank high in a recent report (issue brief) by the Tax Foundation on the percentage of  highway spending that is funded by user fees like gasoline taxes, tolls and other fees.  Unfortunately, in making good points about user fees, the Foundation draws the wrong conclusion about the data it uses to make them.  That happens a lot when you use bivariate analysis to draw conclusions in a multivariate world.  Instead, using multivariate (regression) analysis on the data, it becomes clear that it is less the use of good principles of fiscal policy that results in states paying for a higher percentage of the costs of highways with user fees, than it is a function of the volume of federal government grants they receive.  So a cursory look at the Tax Foundation’s report can give NH a sense of superiority in fiscal policy over many states (while I generally think that is true about NH it is not so much in this case),  and especially over Vermont because that state funds just under 20% of its highway spending with user fees compared to NH’s 42%.  The real reason those percentages are what they are is that Vermont receives about 64% more federal highway funds per capita than does NH ($220 to $134 in 2010). The chart below shows the simple relationship between the percentage of highway spending in a state that is funded by gas taxes and user fees and the amount of federal highway funding per capita in each state.

User fees and Fed funds

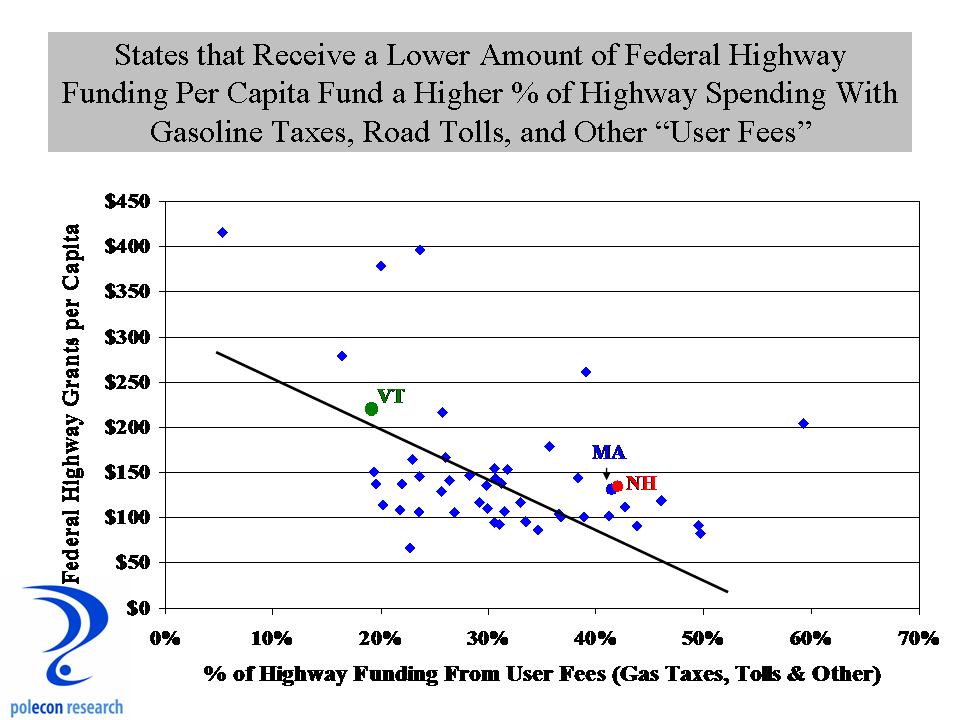
States like NH that fund a higher percentage of highway expenditures with user fees do generally receives lower amounts of highway funds from the feds (the data point slope downward to the right).  There are even more intervening variables, like the amount of federal highways (by mile) and as a percentage of all highways that are in a state but still, by far, the amount of federal highway funding per capita is the best predictor of the volume of highway spending per capita in each state. The amount of motor vehicle-related user fees per capita were a distant second but still significantly related to highway spending.

Fed Highway per capita

Almost everyone agrees that NH’s (and every other state’s) roads and bridges are in need but I don’t think the debate is ever going to be about the wisdom of user fees versus general revenues in paying for highway infrastructure.  It is too bad because if it were we just might reduce the need for more spending in the future.

Betting on Gambling Assumptions

March 5, 2013

The gambling debate in NH is as hot as it has ever been as the NH Senate just passed a casino gambling bill.  Since I have no dog in the fight (or more appropriate to the debate – no pony in the race) I’ll use this blog to add my $.02.   I think the issue will be decided largely on the basis of something other than the impact casino gambling would  have on state revenues, but to the extent that fiscal impacts are a part of  policymaker’s decision process I’d like to see them have access to the best information and tools with which to make their decision.   Public policy analysis is not physics, there aren’t formulas with constants that govern  behaviors today the same way they did one million years ago.   Policy research is mostly social science that relies on a combination of disciplines like economics, sociology, and demography, and others.  The goal of policy analysis isn’t to prove anything or have something published in an academic journal (a fact usually lost on academics)  it is to improve the information in the debate and to marginally improve the decision-making process.  Policy research is best when it not only provides information, but also when it increases policy maker’s understanding of the issue and how even small changes in policy proposals might affect the ultimate impact of a proposal.   A lot of lobbyists want to provide the one “answer” to what will be the impact of this or that proposal or what will be its fiscal costs or benefits.  A lot of lawmakers want a single “point estimate” of impacts as well, when in fact there is always a range of likely impacts (some more likely than others) and usually they depend on a set of assumptions.   I’ve done a lot of policy research and I never assume anyone will agree with any of the assumptions I include in my policy models so I always design them for policy makers to insert their own assumptions in order to calculate the impacts of policy proposals.  That both increases the confidence policy makers have in their decision-making by helping them understand the sensitivities of estimates to different assumptions and the key determinants or levers that produce different impacts, and it reduces concerns that my analyses are using unrealistic assumption or “cooking” the numbers.  But what it really does is provide a ‘tool” for policy makers to use rather than giving them my “answer” to any policy question.  I usually do have my preferred answer but it doesn’t do any good unless lawmakers can see that it isn’t just “my preferred answer” bu the result of some pretty sound empirical analysis, even when it can be interpreted differently.  Invariably I offer to make my models available to policy makers but to date at least, only a few have every taken my up on it.

With that long preface I’d like to suggest that all sides of the gambling debate make their models and assumptions available and allow policy makers to get a better understanding of the sensitivities of their estimates to different assumptions.  My friend Dennis Delay at the NH Center for Public Policy Studies  is about the best there is at shooting straight and trying to develop the best estimates possible but while he does the analysis I don’t think he does all of the report writing so I would like to see more attention in their analysis of gambling to demonstrating likely impacts under a range of assumptions because it seems that not everyone agrees with theirs.  I haven’t seen any detailed analyses by gambling proponents and think they need to provide their assumptions and models for estimating revenues and impacts as well if they want lawmakers to adopt their proposals (they may have done this I just haven’t seen any analysis).

To demonstrate how important assumptions are in estimating revenues I developed a small model of gambling revenue in NH (not including any social costs).  The model results presented below assume one casino in Southern NH with 5,000 slot machines (or video lottery terminals) but any number of slots can be entered as a variable.  The base for state revenues (on which a state tax would be applied) is estimated using  per slot machine revenue data from Connecticut Casinos for the most recent year (2012).  This seems like the most similar market but again, a different per slot figure can be entered into the model to yield different results.  In addition, different tax rates and different impacts from Massachusetts casinos can be entered into the model.  I’m not trying to estimate revenues here but I am trying to highlight just how important model assumptions can be in determining fiscal impacts and until all sides show how their estimates are affected by their assumptions I think it is hard for lawmakers to make reasoned decisions based on fiscal impacts.  As the chart below shows, estimated state revenues vary greatly when even a few assumptions change.  The “Y” or left, vertical  axis shows estimated state revenues, and the “X”  or bottom, horizontal axis shows increasing tax rates from left to right.  Each colored line on the graph shows estimated state revenue at each tax rate and each  colored line represents a different assumption about the impact on revenues depending on how much casinos in Massachusetts affect casino revenues in NH.

Sensitivity of Revenue Estimates

Finally, I would like someone to articulate and provide some data on how  casinos in NH would perform in a competitive market depending on the type of experience they provide.  That seems to me to be a question best answered by the industry.  I think it is important in understanding the impacts of an increasingly competitive gambling market and the data I have looked at suggest that, at least in Nevada (see below), casinos have derived an increasing share of their revenues from rooms, meals, beverages, retail and shows.  Entertainment seems to play a larger role in the business models of casinos in that state and I wonder if that will be true in NH or in Massachusetts and what are the implications if it isn’t in either, both, or if it is in just one state.

Sources of Casino Revenue

Ideologically Uncomfortable Economic Growth in New England

January 11, 2013

State government revenues in NH have grown more slowly over the past few years than almost every other state in New England and there aren’t any signs on the horizon that revenue will grow substantially over the next biennium.

General Revenue Growth

Some of that is the result of policy decisions that looked to reduce taxes in NH in order to increases economic growth, some is the result of other states willingness to expand or raise taxes, and some of it is the result of the fact that NH’s economy has been growing more slowly than most NE states with the exception of Rhodes Island and Maine.  How much of the slow revenue growth is attributable to a weaker economy and how much is attributable to policy changes is difficult to discern.  In some cases it is easy, the cigarette tax was reduced and produced less revenue (almost exactly the amount that I forecast) but more generally, slower growth (or declines) in revenues will occur in a weak economy regardless of policy changes.   Even without a definitive answer to that question we can still learn something from the fiscal and economic experiences of NH and neighboring states over the past few years.

Because it seems that it  is all ideology all the time in public policy debates these days, lets filter the revenue and growth debate through the ideological prism that characterizes most legislative bodies and public debate today.  For some in NH, it is bad enough that both Massachusetts and Vermont (that would be two-thirds of the Holy Trinity of New England socialism if socialists were allowed to believe in the Holy Trinity) have enjoyed stronger economic growth than NH over the past nearly two years.  But it is even tougher to accept that each of these states can enjoy faster growth than NH at the same time they are seeing stronger growth in revenues, and maybe even at a time when they took steps to keep revenues from falling too far, because to ideologues on one side, more revenue has to mean slower economic growth and the only way to get stronger growth is to cut revenues.

NE emp growth

The other end of the political spectrum will argue that the collecting more revenue has allowed these states to invest in more of what their economies need to grow, but there hasn’t been a whole lot of “investing” by state and local governments anywhere in recent years and each of these states has taken some steps to reduce the size and scope of state government expenditures in recent years.  The reality of course, as it almost always is, is somewhere in that wasteland (according to ideologues) known as “the middle”.   The stronger revenue growth of some states is largely a function of stronger economic growth and not necessarily the “investments” those revenues allowed but it can also be said that their generally higher levels of taxation have not disadvantaged their economic performance in relation to NH with its lower level of taxation.  Some of NH’s slow revenue growth is the result of policy decisions but most is related to an economy growing more slowly than neighboring states.  If there is anything to learn from recent economic and revenue trends it is that taking less in revenue  does not, in itself, guarantee stronger growth and that more revenue doesn’t always stifle (although it could) economic growth.  I know business taxes in NH remain high, but that has been true for as long as almost anyone can remember.  It didn’t keep NH from growing faster than any other state in the region for most of 30 years so I doubt it is the singular reason why we are growing more slowly now.  That doesn’t mean it isn’t an issue that should be addressed, it just means that its not likely the only answer to NH’s problem of slower economic growth.  For all of us non-ideologues, I hope lawmakers look to broaden the range of issues in the policy debates over how best to strengthen NH’s economy.

Brother (or Sister) Can You Spare a Dime?

January 7, 2013

Tomorrow I will have the opportunity, along with several people a lot smarter than me,  to address the NH House Committee on Ways and Means to talk about some of the forces and factors affecting revenue growth at the state level.  I’ve forecasted (pretty accurately I think) the impacts of policy changes on state revenues for a number of clients and projects (here is one example I’ve written about in this blog).  Things like energy and gasoline prices that affect the disposable income  of NH residents and the willingness of out-of-state residents to travel to NH for recreation or shopping (energy prices can affect the price differential calculus for an out-of-stater coming to NH to purchase  goods or avoiding travel costs by purchasing higher-priced goods in their home states) are just a couple of examples that can make the difficult task of revenue estimation that much more difficult for NH lawmakers.  It’s a tough and thankless job and if I can help I am happy to.   It is especially difficult these days because the news on revenues is rarely good, as the chart below shows,  year-over-year quarterly state revenue growth ( from the state’s 8 largest “own source” revenues) has performed more poorly, for a longer period of time, than at any time over the past decade.

NH revenue growth

Some policy actions contributed to that (the decrease in the cigarette tax is an example – although that was only a small contributor to slower revenue growth) but the biggest reason is weak economic and job growth.

NH Job and Revenue Growth

Tomorrow I will present a number of charts and talk about a number of factors that influence various revenue sources but the bottom line is this:  until we have more than tepid employment growth, revenues aren’t going to grow significantly and forcing them to grow (via a major policy change) will not contribute to stronger job growth.  That isn’t the same thing as saying “any policy change (rate adjustment etc.) will harm job growth and revenue growth in the long run.”   NH’s unique fiscal system has survived far longer than many thought possible (and longer than many wanted it to survive) because of balance – those on the left of the political spectrum had to be satisfied with the state doing what it “needed to do”  rather than what it “wanted to do” and those on the right had to be willing to allow for some adjustments in tax rates and revenues to keep call for major policy changes at bay.  I think that worked pretty well for a long time but it only works when their is a modicum of flexibility and compromise in the policymaking process.    That, in fact, may be the best estimator of revenue growth moving forward and you don’t need an expert panel of wonks and nerds to tell you that.

Can We Be Different Like Everyone Else?

January 4, 2013

I was surprised to see the number of states that have allowed casino gambling.  In a prior post I focused on what I thought were the states that are perhaps most identified with casino gambling (Nevada, New Jersey, and Connecticut).  Twenty three (23) states and five since 2005 (if you count Massachusetts) now allow some type of casino gambling.  As the map below shows, the Northeast region of the country is the king of casinos.  I don’t know what that says about the Northeast but Vermont and New Hampshire are now the only states in the region that do not have some form of casino gambling. (a note about the data in the charts below:  I have taken reasonable steps in the limited time I allocate to this blog to provide accurate information – if anything appears inaccurate please let me know).

Note: Map is Updated thanks Curtis!

 Competitive Casino Map

I think whether or not to become more like other states in the region is an important and ongoing debate in New Hampshire, whether it be about our revenue structure, which stands out in the region, or our political, legislative, and regulatory structures which to a lesser degree do as well.  I’ve long argued that the state was able to buck the region’s unfavorable demographic and  economic trends because it was somewhat unique in the region.  Some who disagree with me on that argue that the state should, in the case of casino gambling, refuse to become more like the rest of the Northeast region.  While others who agree with me on the benefits of NH’s uniqueness are arguing that NH should have casino gambling because other states in the region are doing it.  Consistency isn’t what it used to be or perhaps I just confuse consistency with rigidity.  It is also possible that I am misreading the whole consistency and change aspect of the debate.  Could it be that gambling is consistent with NH’s fiscal traditions but inconsistent with its uniqueness in the region?  I don’t expect there will be a lot of testimony on that at any public hearings on casino proposals.  For those more interested in the pedestrian issue of how much state revenue we can expect, below is a chart that shows how much states currently take in from casinos (in very broad categories).  Interesting to see that Pennsylvania is now the champion in terms of state revenues from casinos.  That state is, in large part, responsible for the decline in revenues in New Jersey.  Things are definitely changing in NH and the upcoming debates over whether or not to allow casino gambling will, I think, tell us a lot about the direction of that change.

State Revenue from Casinos

If We Can Beat the Mayan Apocalypse Why Not the Fiscal Cliff?

December 21, 2012

If the Mayan apocalypse can be postponed (I am not sure exactly at which time it is supposed to occur so I may be speaking too soon here) then surely the U.S. Congress can agree to actions to avoid the fiscal cliff.  Lawmakers are poised to give us over $500 billion in tax increases and over $100 billion in spending cuts to begin the new year.  The fiscal cliff is a  pretty big lump of coal as a gift to begin 2013.

What is extraordinary about the cliff’s self-inflicted harm is that it appears  almost all sentient beings realize what needs to happen. More importantly, there also appears to be substantial agreement on most of the actions necessary to avoid the economic harm resulting from the fiscal cliff.   Spending clearly has to be cut  just as surely as revenues have to be raised.

deficit trends

With so much apparent agreement on actions needed to avoid the damage, it is hard to understand the calculus of lawmakers as the lack of an agreement begins to  demonstrably affect business and consumer confidence as well as financial  markets.  Congress always comes up with a temporary fix for the alternative minimum tax and can easily do so again.  Almost everyone wants the payroll tax cut to expire (for different reasons – Republicans because they don’t like the temporary nature and believe it has no incentive for work and saving and Democrats because of its impact on the Social Security trust fund).  There is little support for extending unemployment benefits.  It seems like neither party really wants the spending cuts (Republicans opposed to defense cuts and Democrats to non-defense cuts).   There is disagreement over the tax increase for high income individuals included in the Affordable Care Act and Medicare reimbursements for doctors but those are a miniscule portion of the cliff’s effects.   Beyond all the posturing,  the fight in congress is really  about whether to extend tax cut provisions to 98% or 100% of U.S. households.

cliff effects on growth

I know I am simplifying here.  Even with many agreed upon temporary  fixes,  longer-term solutions must be found.  But lawmakers could still salvage strong economic benefits by avoiding the worst of the cliff’s impacts in the short-term while resolving longer-term issues in the first-half of 2013.  Such a “grand bargain”  would both increase business and consumer confidence and set the nation on a more sustainable budgetary and debt path that would quickly overcome any of the short-term negative impacts  resulting from necessary spending cuts and revenue increases.

How Much Federal Government Revenue is Enough?

November 14, 2012

Federal government revenues as a percentage of gross domestic product have averaged about 18% over the past 50 years (the median is also 18%).  Federal government revenue is “pro-cyclical,” that means revenues as a percentage of GDP grow when the economy is stronger, as profitability of businesses increases and as individual wage, salary and investment income is increasing.  This relationship has a couple of important implications: First, it can confound ideological interpretations of the appropriate level of current revenues as a percentage of the economy because higher revenues as a percentage of GDP aren’t associated with slow growth and low percentages aren’t associated with higher rates of economic growth – just the opposite is true (with the exception of the dual recessions of the early 1980s), second it suggests how important economic growth is to revenue growth and thus to potentially reducing the nation’s budget deficit.

I haven’t done the math but others who have indicate that the various deficit reduction proposals all require revenues as a percentage of GDP of over 18%.  The U.S. House passed Ryan budget proposal would produce estimated revenues as a percentage of forecast GDP of approximately 19%, the President’s proposals would produce estimated revenues at 20% of GDP, and the “Simpson-Bowles” model would result in estimated revenues as a percentage of forecast  GDP of 21%.  That doesn’t sound like much of a difference, but in an economy with a GDP of $15.5 trillion each 1% increase equates to $155 billion in revenue.  Going from federal revenues that are 18% of GDP to 21% implies a revenue increase of $465 billion.   I could be ok with that if the bulk of the increase were the result of a roaring economy producing large increases in profitability and income, but that isn’t the foundation of any deficit reduction plan and it is hard to see a scenario where $465 of additional revenue is consistent with a high growth economy (the pro-cyclical nature of revenues aside – that relationship isn’t  infinitely linear).  The national debate over reducing our nation’s budget deficit is framed by two choices or their combinations,  increasing tax rates (or eliminating temporary reductions and reducing tax breaks etc.) or by cutting spending.  Revenues at 18% of GDP seems to have worked reasonably well over the past one-half century with the past decade being the exception.  It may be time to aim for a different ratio for the sake of longer-term fiscal balance, but I wouldn’t do it without first exhausting opportunities for spending reductions that maintain a ratio close to the historical average of 18%.  But whatever the combination of spending reductions and revenue increases that eventually becomes the strategy for addressing the nation’s long-term fiscal imbalances, I hope economic growth is the ultimate goal, because as the chart above shows, achieving that goal will make addressing fiscal imbalances a much more manageable task.

Will NH’s Fiscal System Get Better Looking Each Year?

November 9, 2012

Up close everyone sees the wrinkles, greys and infirmities that come with age,  but some things do, in fact,  get better looking with age.  Surprisingly,  NH’s revenue structure  may be one of them.  For a lot of people New Hampshire’s fiscal system has been out of balance for a long time.  I see it somewhat differently.  The state was able to maintain a fiscal structure that was unlike any other in the country.  Some hate it, some like, but one thing it absolutely most depends on is balance.  Specifically, those identifying with the left of the political spectrum had to be satisfied with doing the things that state government has to do and only a limited amount of what it may want to do.  While those on  the right of the political spectrum had to be willing to occasionally adjust the tax price of services (adjust rates and fees etc. temporarily or in some cases permanently).  Without a recognition of the need for balance from either side, the pressures from one side that were met with complete inelasticity from the other could cause the system to burst.   If NH has lost some of that balance I hope it regains it quickly because while some may see our system as flawed, it has also been a big part of our successes.

Looking toward the future, our current system is likely to suffer less from some of the demographically and economically induced changes in the growth in state-level revenues.  I don’t know if we will be the envy of other states but we should consider the impacts of the changes before walking too far down the path of big changes.  The biggest change is the fact that growth in the working age population is slowing and may continue to do so for decades (see below for NH).

That, of course, implies slower growth in wage and salary income and states most reliant on income taxes will feel that pinch the most.  On the flip side, with more older citizens, likely more income will be in the form of interest and dividends, a benefit for NH’s current system if interest and dividends tax revenue grows proportionately .  NH’s business enterprise tax (BET) depends on wage and salary payments so that revenue source would be negatively affected but because of the way the BET interacts with the business profits tax(BPT), a decline in either source is cushioned by impacts to the other source.  Moreover, as labor becomes more scare, the capital intensity of businesses should increase as businesses look to produce more with fewer people.  While the BPT impacts will be mostly neutral, it is possible that a deepening of capital in the economy could  increase in the relative profitability of businesses which would provide more lift to the BPT.

As the age structure of the population changes to include more older residents, in the aggregate, less money will be spent on the types of things subject to general sales taxes and more on goods and services that are not taxed (health care being the most notable), thus sales tax revenue growth rates could slow.  Combined with more sales occurring digitally via the internet and the generally increasing geographical separation of  buyers from the location of sellers, this does not bode well for long-term growth in sales taxes.  NH’s hybrid mix of taxes and fees collectively are likely to suffer less as a result of demographically induced changes in revenue .  As the risk of impacts is spread over a greater number of sources, any negative impacts on one source will have less of an effect than if the state relied on either of the two major sources of most other state’s revenue, the income and general sales tax.  For the most part, property taxes will also be relatively less affected by demographically induced changes.

It may not look like it now, but with the kind of balance that characterized fiscal policy making in NH for decades, and with coming shifts in revenue growth resulting from demographic and economic changes, NH’s fiscal structure  may well be better positioned to avoid the next (and inevitable)  fiscal calamity to hit states.

Whoever Wins, I’m Rooting for Propserity

November 6, 2012

The winners of today’s state and national elections face some daunting budgeting tasks.  Compounding those difficulties is the fact that winners will likely begin their efforts having disappointed close to 50 percent of the people who care enough about their country and state to exercise their right of franchise.  Its hard to set a course when half the oarsmen and women are are using them to poke you in the eye rather than right the ship of state.  This is not a circumstance unique to this election, but what does seem different is how many people think they still win even when their candidate loses, if the country or the state fail to prosper under the administration of the victor.    Some may have, but I never have  been better off when the economy is weak,  so whether or not my candidates win today, I’m rooting for prosperity.

In NH, today’s winner of the race for governor will confront pent-up demand for limited state resources that show no near-term signs of significant increase.   The state’s largest source of general fund revenue, the combined business profits and business enterprise taxes, has shown limited growth recently.  In the past, this source of revenue has demonstrated an ability to rise quickly and dramatically as the state’s and nation’s economies rebound, but a severe recession and changes to the state’s business loss carry forward provisions will dampen some of these effects that typically occur early in a recovery.  The chart below shows the seasonally adjusted,  annualized, business tax revenue over the past decade, along with our forecast for the next two years.  This forecast uses a statistical model (ARIMA) that makes no assumptions about changes in the strength of the economy and it indicates that, without significant changes,  business tax revenues can be expected to increases by about 5.3 percent over the next two years.  We will update the forecast as new data becomes available as well as use modeling that incorporates key assumptions about changes in state and national economic variables, but as it stands now, it appears that  little of the pent-up demand for state spending  is likely to be satisfied under the current path.