Archive for the ‘NH Economy’ category

“A Chicken in Every Pot and a Car in Every Garage”

September 28, 2015

I say this with all of the sagacity of Herbert Hoover who is quoted above: New Hampshire will once again exceed the U.S.  rate of employment growth in 2015 and will have the highest growth rate in the Northeast.  It has been our state’s decade long nightmare to have sub-par job growth after becoming accustomed to superior job growth for much of the prior three decades.  After several years of playing the pessimist it is nice to be able to argue that New Hampshire will once again be a leader in economic performance. Private sector job growth has accelerated and NH is moving up in the state rankings over the past twelve months. A steep decline in energy prices is helping the state by lowering the price of fuel oil, gasoline, and natural gas, lowering some costs for businesses and increasing disposable income of households in a state and region burdened by higher energy costs. Energy producing states are feeling the brunt of price declines. A year ago North Dakota could not be displayed on the graph below without ruining the scale of the Y axis, now they, along with Alaska, Wyoming, Oklahoma and other energy producing states are the laggards. Energy isn’t the reason NH had sub-par job growth but a reduction in energy prices is helping accelerate growth in the state.

Gottlob 2015 Savings Bank of Walpole Presentation

The quality of job growth is also improving, with jobs in better paying industries increasing more than jobs in industries that tend to have fewer well-paying jobs. The troubling exception is in professional, scientific, and technical industries where there has been no job growth.

job quality

Private sector job growth is accelerating despite the fact that help-wanted ads have declined. I believe this indicates that more jobs are being filled, lowering the number of unfilled jobs, and thus help-wanted ads, even as job growth is increasing. One exception may be jobs in professional, scientific, and technical fields which comprise the largest category of help-wanted ads but where industries that employ the largest number of these occupations appear to have had no net job growth over the past year. A large number of these jobs appear to be going unfilled and indicate a technical and professional labor supply problem in the state.

help wanted

I expect New Hampshire to add about 16,000 non-farm jobs in 2016, a rate of about 2.5% annual growth. This is a rate higher than any in the past decade and comes with a few caveats. First, energy prices must remain stable and relatively low, this I think is a lock. NH faces more upside potential (things will get better) than downside risk on the energy front. Second, the pace of government job cuts has to slow or reverse. The reduction in local government employment has been a significant drag on overall employment growth in the state, subtracting about 0.5% from the state’s total non-farm job growth rate. And stop please, anyone who thinks cutting local government jobs is a reason for accelerating private sector job growth. Third and most importantly, NH’s labor force has to grow at rates above the past few years. I have recently written about the labor force being the most significant constraint on the NH economy, and largely responsible for NH’s sub-par job growth (as opposed to some fundamental erosion of the business climate). One thing is clear, labor force growth will not come from just absorbing the “slack” in NH’s labor market. The chart below shows that NH is essentially at full employment with the exception of individuals who are working part-time for economic reasons (that is they would like to work full-time but can’t get full-time employment). There will always be some level of unemployment regardless of the strength of the economy, both for frictional reasons as people change careers or jobs, as well as structural reasons as the economy and industries change and the demand for different skills and occupations shifts. There are now  more people working part-time for economic reasons in NH than there are unemployed individuals. Three quarters of part-time workers in NH work part-time by choice according to my analysis of Bureau of Labor Statistics Current Population Survey data. The remaining 25 thousand or so part-timers wanting full-time work shows an equal number of men and women, spread fairly evenly over the age distribution between 22 and 64. More than one-third have at least an associate’s degree and 24% a bachelor’s degree. This source of labor can be more fully utilized boosting overall output but they are already working and don’t expand the size of the labor force. Discouraged workers number less than 1,500 with about that number again who are conditionally discouraged but would enter the workforce for the right job. They are predominately male (80%) and older (75% age 45+) and overall have lower levels of educational attainment (although a percentage of college grads is included).

unemployement rate

Hope for expanding the labor force in NH comes mostly from a return to net in-migration from other states. NH’s primary source of for increasing the skill and talent of its labor force for three decades, this source became a net negative factor in recent years. Data on this comes with a long lag but some unofficial, non-government statistics suggest that in-migration is returning and accelerating in some parts of the state, supplying an influx of talent and additional labor that will contribute to expanding differential rates of growth in the state. Areas of the state that have seen labor force growth in recent years have been adding jobs at a much faster rate than the remainder of the state and is one reason why I advocate giving as much attention to making a community, region, or state “attractive to individuals and families”  as making them attractive to business. The Seacoast will continue to lead in job growth because of the region’s ability to attract “talent” and expand its labor force. Job growth in the Manchester region is picking up and I expect a stronger performance for that region in 2016, while the Nashua region will continue to lag.

labor forcde growth

Jobs Just Don’t (and Won’t) Grow Like They Used To

June 29, 2015

A late boss of mine used to say “We all know the time when education in this country started to go downhill; it was the day after each of us graduated.” I am trying to not let nostalgia influence my views of the current labor market and prospects for job and economic and growth. In prior posts I have tried to make the case that slower labor force growth (and to a degree a skills gap) is the fundamental factor constraining growth in the NH economy. In my last post I wrote: “Looking ahead, population and demographic projections show that both nationally and in NH, the working age population (defined here as age 18-64) will show almost no growth over the next 25 years.” If that was written in another’s blog I would have dismissed it if it was not empirically supported, especially if it was as fundamental to the analysis as it was in my post. Regardless of whether you agree with or have even read the analysis in that post, the population and labor force trends it references are keys to understanding critical obstacles to future economic and employment growth.  In this post I provide some documentation and my interpretation of those trends.

It is important to make the distinction between growth in the “working age population” (which my prior post referenced) and “growth in the working age labor force,” (which is a more appropriate measure for the main thesis in that post.). While the two measures  move in the same direction, the magnitude of change can differ as the age composition of the population changes and as  trends in labor force participation among different age and demographic groups change over time. Longer-term trends (as opposed to shorter-term or cyclical trends – those affected by business and economic cycles) in labor force participation can mitigate or exacerbate some of the population trends affecting the size of the labor force.

“Prediction is very difficult, especially if it’s about the future”
—Neils Bohr, Nobel Laureate in Physics

First, let’s look at the assertion from my prior post that: “the working-age population …..will show almost no growth over the next 25 years.” That is a remarkably imprecise statement on which to base any analysis and its accuracy depends on your definition of “almost no growth,” as well as how you define the working-age population.  The chart below shows the U.S. Census Bureau’s “middle scenario” for U.S. population growth to the year 2060. In the chart I show four definitions of “working-age population” along with the cumulative growth rate of each. Three of the four definitions begin at age 22 to reflect the adult working age population. The three definitions include: ages 22-64 that recognizes a historical traditional retirement age at 65, as well as two others (ages 22-69 and ages 22-74) that reflect mortality, health, occupational, and retirement trends that have many individuals working beyond traditional retirement ages. To show that adding the younger population has relatively little impact on the trends I include a traditional definition of working-age population that includes individuals ages 16-64.

working age pop growth

The chart shows that the “adult working-age population” is projected to grow by about 10 percent over the next 25 years (between 2015 and 2040) in the first two (more traditional) definitions of working-age and by a much larger 15 percent for the definition that extends “working-age” population to ages 22-74. “Almost no growth” may overstate the decline in the rate of growth but, for me, 10 percent growth over 25 years is pretty close to almost no growth, especially by historical standards. I think the chart highlights the important role that older individuals could play in employment growth in the future. I like to call this the “revenge of the baby boomers” who first entered the labor market in competition with large numbers of other boomers and who experienced resulting demand for their labor that could not always keep up with the big increase in supply. Much later in life boomers who wish to continue working will likely see demand for their labor higher than it has been in the past for older workers.

The Distinction Between Population and Labor Force Growth

How growth in the “working-age” population translates into growth in the labor force is a function of the age composition of the labor force and the labor force participation rates among the different age groups in the population. Participation rates are highest between ages 25 and 54, much lower among teenagers, lower among 22-24 olds and much lower and declining at ages 55 and above. Thus when the population is growing in high participation age groupings (between 25 and 54) labor force growth will grow more similarly to population growth than when more of the growth in population is among younger (under 25) and older (55+ individuals). That is illustrated in the following two charts. The chart below compares cumulative population and labor force growth between 2015 and 2060 in the broadest definition of “working-age population” which here includes ages 16-74. Labor force projections incorporate a forecast of an increase in labor force participation rates for all age groups above age 55 (averaging about a 5% increase in participation rates) consistent with projections of participation made by the U.S. Bureau of Labor Statistics. The increase in labor force participation among individuals aged 65 and above is not simply a result of individuals who are not able to financially retire (although that does play a role), it is also a function of the better health of older individuals and a decrease in the percentage of jobs in the economy that are physically demanding, among other factors. For age groups in the middle age ranges there is a slight decline in participation rates (averaging about 0.4%), and for the youngest age groups a decline averaging 3.6 percent.

Combining the age distribution of the growth in the working-age population with trends in labor force participation shows that actual labor force growth among the population ages 16-74 is going to be much smaller than population growth because so much of the population growth will be among age groups with the lowest labor force participation rates.

16-74

When a the “adult working-age population” is examined (including ages 22-69), little difference between the cumulative population and labor force growth is seen, with time periods where growth rates are identical and some during which cumulative population growth is slightly higher.. This occurs because the combination of growth in the ages 55-64 population and an increase in the labor force participation rate of this age group compensates for the decline in participation among the youngest age groups and slower population growth in the high participation age groups (25-54).
22-69 growth

Population and Labor Force Growth Over the Next Several Decades Will Support Job Growth That is Less Than One-Half of Current Employment Growth Rates

Each of the graphs above show a labor force that is growing nationally (in fact some states will likely see an outright decline in their labor force). Because the charts show labor force growth it is easy to miss the significance of a slower rate of labor force growth on the U.S. economy and future job growth. Over the past three years the average monthly job growth in the United States has averaged about 200,000 jobs. Real labor force growth hasn’t been sufficient to accommodate that level of growth but because of the layoffs in the labor market during the recession there was enough slack (unemployed individuals and individuals temporarily out of the labor market) in the labor market to allow for that level of job growth. Eventually that slack will be taken-up and job growth will be more constrained because of labor force growth and wages will rise in response to tighter supply (that is just beginning to happen). That was the essence of my thesis about the interaction between NH’s business taxes and demographic and labor market trends.

During the non-recessionary years of the 1990’s the average monthly job growth in the U.S. was about 243,000. Those monthly job growth numbers include jobs going to individuals below the age of 22.  While my analysis primarily is concerned with the adult working-age population (ages 22+), including the labor force ages 16-21 into the analysis changes the population and labor force growth trends very little. Even including individuals ages 16-21 into labor force projections labor force growth will not support an increase in 200,000 plus jobs in the coming decades (except following a recession when substantial layoffs and slack in the labor market exist)..

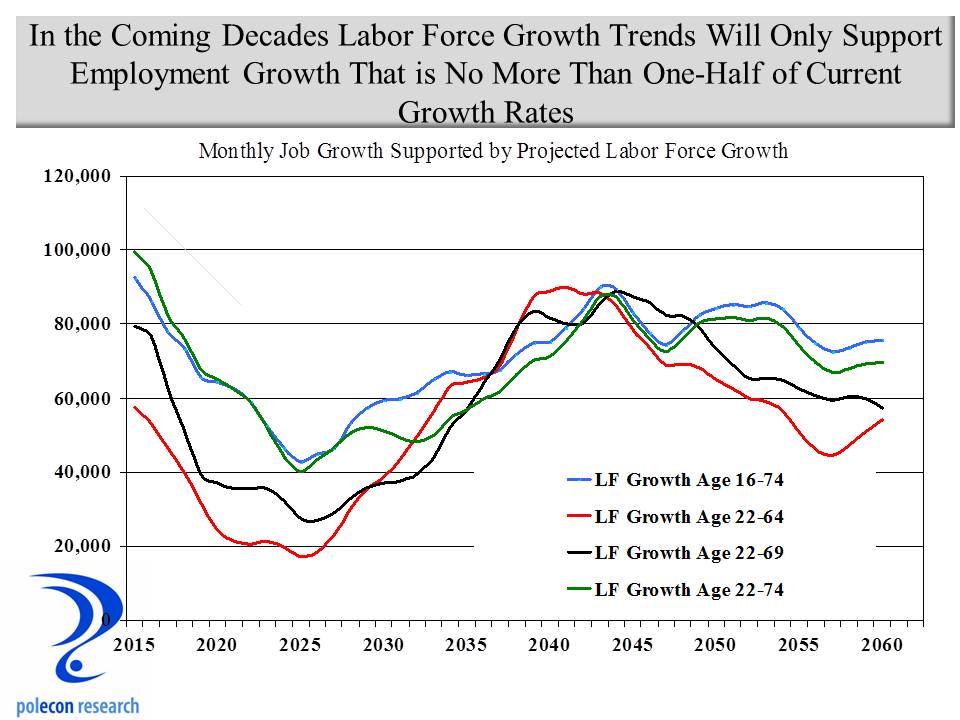
To illustrate that point the chart below translates the annual increase in the nation’s adult labor force into a potential monthly job growth for the nation (if all of the increase in labor force were employed) under four definitions of the labor force. The chart shows that under a traditional (ages 22-64) or a maximum expansion (ages 16-74) definition of the labor force, annual growth will not sustain current or historical rates of monthly employment growth. During years of the highest labor force growth, jobs would grow only at about one-half the current monthly rate of job growth in the U.S.

LF to job growth conversion

Caveats and Conclusions

Long range forecast and projections are always problematic but the scenario of slower labor force growth and greater competition for labor outlined in this and my previous post will play out even if the degree to which it does has some uncertainty. Despite the overall U.S. trends it is important to note that population and labor force growth will vary greatly among states. Unfortunately NH and other Northeastern states currently are confronting trends that are on the negative end of the spectrum for population and labor force trends.

When the percentage of women in the labor force increased dramatically beginning in the 1970s the labor market was fundamentally changed and the growth potential of the economy was given a tremendous lift. There are no equivalent transformative changes on the labor market horizon. More individuals will work later into their lives but it won’t have the same economic effects as did the increase in labor force participation among half the nation’s population. In addition there has been on ongoing trend of declining labor force participation rates among young people that is, in large part I believe, attributable to the increase in post secondary school enrollments over the past few decades and this partially offsets increases in participation among older individuals. Perceptions of the need for and value of a at four-year college degree are increasingly being challenged so it is possible that the trend of lower labor force participation rates among the young may begin to reverse. The scenario presented here is based on the assumption that current international immigration and state-to-state migration trends will continue unchanged into the future. It is possible that if labor shortages are severe enough in the northeast, we would we see increased net migration into the region, and once again into NH.  But the potential pool of labor which NH can attract will be growing more slowly, making attracting “talent” to the state ever more challenging. That is one reason why I stress the importance of making states and communities attractive to individuals (of all ages) as well as attractive to businesses. Net inter-state migration to NH will likely increase from recent low levels, however, only if the state and its communities offer enough of the amenities and enough of a value proposition to justify that net in-migration. Finally, it is also possible that labor shortages will spur action to increase rates of international immigration to the U.S.. Prediction is indeed very difficult – especially when it is about the future. and especially when it involves a long horizon and as many variables as do population and labor force growth. But for now, my money is on the scenario outlined in this and my previous post.

More on Shifting Economic Activity in NH

April 17, 2014

My post on the “Shifting Locus of Economic Activity in NH” back in January generated a lot of interest and emails. That post has more views than any other post on this blog over the past year and half. Admittedly that’s setting a pretty low bar as far as blog readership honors go. Nevertheless I want to thank my family as well as those with an interest in flying, swarming insects and an inability to spell “locust” in their search engines for making it possible.


As I noted in my first post on the topic, I believe there are a number of economic and demographic indicators that support my contention about the shift in economic activity. Still, there are some (many?) in the Granite State who disagree. In the spirit of giving the public what it wants and sparking debate, I present another of what will be several posts on the topic.
Some themes essential to my thesis are: that the ability to attract and retain talent (skilled individuals with higher levels of educational attainment) is the critical ingredient responsible for the shifting of activity in NH – as well as the key ingredient for producing a dynamic economy anywhere; and that communities offering amenities and services desirable to “talent” and at a relatively more affordable price are keys to attracting talent. I think price (the ability to offer desirable amenities and services at a relatively more affordable price lower than other communities that offer similar amenities) has been important. But I also think that patterns of economic activity in NH and throughout the country demonstrate that unless your community or state is sitting on a valuable store of fossil fuels or minerals, being cheaper isn’t enough to generate more robust economic activity. One interesting artifact of the debate over local government fiscal policies is the mistaken belief that communities spend more when they contain a higher percentage of lower-income residents. In fact, just the opposite is true – expectations for services, quality, and amenities, along with their costs, generally rise as communities (primarily cities – small and large) generate more economic activity and become wealthier. This typically creates a lot of conflict in communities that are experiencing new economic successes and associated demographic changes and can make sustaining a higher level of economic activity difficult for a community.
Getting back to the evidence that supports my contention about economic activity in NH, the previous decade has not been kind to NH or most states in terms of job growth. I documented the Seacoast’s increasing share of NH’s employment and in key industries in my prior post on the topic.  Here, and in future posts, I will look at some of the demographics of that job growth to support my thesis. The chart below shows the percentage change in jobs among individuals of all educational levels (age 25 and up) in different counties and the State of NH between 2003 and 2012, as well as the percentage of jobs held by individuals with at least a BA degree.

County Job Growth
Similar to my prior post, the chart shows that job growth has been higher in the Seacoast (defined here as Strafford and Rockingham Counties because of data availability while the prior post used data at the community level) than in either Hillsborough County or the State as a whole. More importantly, the chart shows that the rate of job growth in the Seacoast among those with at least a BA degree has exceeded the rates for either Hillsborough County or the State by an even wider margin. Strafford County has seen an especially large increase (largely in Dover – my domicile in the interests of full disclosure) but its much smaller employment base makes larger percentage changes easier to obtain. Again, however, it is not just job growth but the nature of that growth and the shifting of talent that is the key.
The Seacoast accounted for a higher percentage of the state’s net job growth between 2003 and 2012 (chart below). The percentage of the state’s net job growth accounted for by the Seacoast was 70% compared to 46% for Hillsborough County (note the percentages add to more than 100% because some counties had negative job growth during the time period).

Share of States Job Growth
Almost half of the net job growth in NH among workers with a BA degree occurred in the Seacoast. Hillsborough County still has a larger percentage of job holders in the state with a BA degree or higher (37% to 31% in the Seacoast) but that percentage has slipped by almost 1% over the time period, while the Seacoast’s percentage has increased by 1%. Still even shifts occurring at seemingly glacial speed are very powerful. I suppose it is possible that the Seacoast has just been more successful in adding jobs which overqualified BA’s are filling. Based on my initial examination of job growth by industry, I don’t think that accounts for the relative differences, but in future posts I will examine that and other possibilities.

Energy Prices Won’t Be Our Savior

March 24, 2014

For as long as anyone can remember New Hampshire (and most of New England and the Northeast) has had high energy prices compared to most other states.  We may narrow the gap some but as sure as tomorrow will be Tuesday, compared to most other states and regions of the country, our energy prices will be higher. There are a number of reasons for that and they can’t be adequately covered here so for now let’s move on to the real concern of this post.  Many will disagree with me about the prospects for relative energy costs in the state but even if I am wrong, and NH and New England could somehow be truly energy price competitive with the rest of the country, we are likely to be very disappointed in the resulting economic benefits.  I am all for lowering energy prices and doing whatever we can do to accomplish that.  Reducing energy costs will give households more discretionary income, ease the burden high energy prices place on many households, and benefit the cash flow of many businesses.  These are real economic benefits but based on op-eds and comments about how high electricity and energy prices are killing business, including by people and groups I like and respect, you might think that reducing the price of electricity will bring a new industrial revolution to the state.  The problem is, a new industrial revolution has been occurring and it is one that relies less on energy and is, in part,  a result of those high energy prices.

Energy BTUs per GS

Energy prices are becoming less important to the success of the New Hampshire economy all the time.  As the chart above shows, the energy content of what the state produces has been declining for decades.  More of what we produce relies less on energy content and the lower energy intensity of the NH economy indicates a lower price or cost of converting energy into GDP.  Reducing the price of an input that is becoming less important each year to the output of the NH economy is not a prescription for revitalizing the NH  or any state’s economy.

To cite just one example, high energy prices have hurt but certainly didn’t kill the pulp and paper industry in New Hampshire.  Industrial electricity rates in Georgia are almost exactly one-half (5.97 cents/kwh) what they are in New Hampshire (11.97 cents/kwh avg. as of Dec. 2013) but Georgia lost 10,000 pulp and paper jobs (40% of the industry in that state) over the last 11 years.  Industrial electricity rates are 40% lower in Wisconsin and Pennsylvania than they are in New Hampshire and those states lost 11,000 and 10,000 jobs respectively in paper-making industries.  California lost more than 13,000 jobs in the paper industry, Illinois 12,000, Ohio 10,000 etc., etc. etc., to the tune of about 200,000 jobs lost across the country and in states with both high and low energy prices.  So if you thought that lower electricity prices would reverse that  industry you would be wrong.

I hope NH does lower electricity prices and if we do, congratulations, we will have won a battle for the 1970’s and 1980’s.  Maybe then we can turn our attention to the battle for the future.   If you want an example of a NH paper company that is fighting (and winning) today’s and tomorrow’s battles consider Monadnock Paper, you can read an excellent online Forbes article about them here.

The future is as much or more about reducing energy intensity as it is about lowering energy prices.  In fact, while lowering energy prices would have been great for NH circa 1980, it might also have delayed the long-term economic adjustments and reductions in energy intensity needed for our state and region to thrive. An industry that can’t thrive in NH because of energy prices is an industry that probably could not thrive in a global economy for a number of other cost-related reasons.   Maine’s industrial electricity prices are about one-third lower than they are in the rest of New England and I don’t think it is a coincidence that Maine is the only state in the region with an economy as energy intensive as the rest of the nation (chart below). Maine’s reliance on more energy intensive natural resource industries hasn’t served that state’s economy well in recent decades.

state by state energy intensity

Our state’s (and our region’s) comparative advantage will never be natural resources or lower costs such as electricity.  For the most part, state economies have been adjusting to account for that fact in what has been at times a painful but necessary adjustment.  As the chart below shows, states with high electricity prices also generally use less electricity per dollar of gross state product.

Eelectricty prices and energy intensity

Although it can, becoming a less energy and electricity intensive economy does not just mean ‘de-industrializing” or becoming a more services-oriented economy.  The dollar value of what New Hampshire’s manufacturers produce continues to climb in real dollars, they just do so just using less electricity every year.  As the chart below shows, the electricity content per dollar of manufacturing output in the state continues to decline and it is not a coincidence that our manufacturing sector has been evolving from traditional to more advanced manufacturing.

electricity content of manuf

Although much of this trend in manufacturing  has to do with the loss of more energy-intensive industries and the emergence of newer, less energy intensive industries, as Monadnock Paper demonstrates, some is also about traditionally energy-intensive industries adapting to the state’s less competitive energy climate.   In either case, the NH economy and individual businesses are way ahead of energy policies in the state.  The question is whether energy policies can catch-up enough to help facilitate the energy and economic transitions and adaptations that are occurring in the state’s economy

The Locus of Economic Activity in NH is Shifting

January 21, 2014

I gave a presentation last month during which I argued that the locus of economic activity in New Hampshire is shifting to the Seacoast.  That is a provocative statement destined to offend the population centers of Manchester and Nashua and quite likely the individuals elected to represent them. Provocation isn’t my intent, it rarely is, but is often the result nevertheless.  This shift will take years to become more apparent but the evidence for its occurrence appears across a range of important economic and demographic metrics.  Over the past decade, private sector job growth in the combined Portsmouth and Dover/Rochester NECTAs** has outpaced growth in either the Manchester of Nashua NECTAs.  The Seacoast is home to only about 15% of private sector employment, but that percentage is growing.  The shift is not really about the job growth numbers because the Seacoast will always have smaller employment numbers than will the population centers of Manchester and Nashua.  It is about how so much more of the innovation and transformation that is occurring among businesses and industries in the state’s economy is occurring in the Seacoast region.

NH Regional job growth

Alone, the increase in private employment in the Seacoast relative to the Manchester and Nashua regions would not be that significant.  Rather, it is the increasing share of innovation and growth in key industries that the Seacoast is capturing that indicates the locus of key economic activity is shifting.  As the chart below shows, the Seacoast region has marginally increased its share of New Hampshire’s private sector employment since 2004, but it has, in relatively short time, substantially increased its share of finance and insurance industry employment, information industry employment, as well as both health care and manufacturing employment.  Annual town-level data stops in 2012 but with the coming addition of technology dependent, international companies like Safran, the manufacturing trend appears to be continuing.   The one key industry where the Seacoast has not gained share is in professional and business services.   This is a large, important, and growing sector of the New Hampshire economy.  In most states, key professional and business services firms often locate in the state’s largest city.  Major NH Law firms, engineering firms, advertising agencies, and many of the other industries that comprise this sector still seem to prefer to be centrally located and have their main offices in the state’s largest city, Manchester.  Having a main office anywhere other than  the largest city seems to signal, to some, that a business is “regional,” that it does not serve the entire state or the larger New England region. The Seacoast is also capturing a smaller share of retail employment, which is surprising given its location along two state borders.  It is not that retail is declining in the region but rather that it has grown faster elsewhere in the state.

Seacoast share of industries

Manchester and Nashua are still home to more companies in key industries than is the Seacoast and that will be true for some time, maybe always.  Still, there was a time when the Greater Nashua and Manchester areas were the technology and manufacturing center of New Hampshire and almost all important developments in manufacturing and technology industries occurred there.  These regions remain the technology leaders by numbers, but more key developments and new companies in technology and manufacturing are  occurring in the Seacoast.  The development of the Pease Tradeport into a premier location for industries of all types, along with the presence of a major research university (UNH), have played important roles in the shift.  But what is really sustaining the trend is the ability of the region to attract the talent (skilled individuals with higher levels of educational attainment) that companies in emerging, growing and higher value-added industries desperately need.   As I say far too often, brains are the most valuable resource in the 21st century.  Skilled, well-educated people have the most economic opportunities and they are the most mobile members of society.  Where they choose to locate, robust economic growth is likely to follow.  Examining Census data indicates that skilled individuals with higher levels of educational attainment have increasingly chosen to live in the Seacoast, and that has provided a key source of competitive advantage to the region.  The chart below shows how the population of individuals with a bachelor’s degree or higher has changed in some NH cities over the past two decades.  The chart shows that on a percentage basis, Portsmouth and Dover, by far, had the greatest increase of individuals over the age of 25 with a bachelor’s degree among their populations.  Somersworth, although beginning with a lower concentration of individuals with a bachelor’s degree, had the next largest percentage increase in subsequent decades.  Among the largest cities in the Seacoast, only Rochester has not seen a substantial increase in its population with a bachelor’s degree or higher.

Changes in Ed Attainment

If the Seacoast continues to increase its concentration of “talent,” then the locus of economic activity in the state will continue to shift toward the region.  Communities in the region continue to attract skilled individuals with higher levels of educational attainment because, to varying degrees, most have been able to provide a mix of services and social, cultural, and civic amenities, at a price more affordable than communities in other states.  But if being the “cheapest” place to live were the key, the Seacoast would not be thriving.  Rather, it is the combination of services and amenities at  relatively more affordable price (providing a good value) that has been attractive.  Many communities and regions are looking to thrive.   Like all regions in New Hampshire the Seacoast has heard, and for the most part heeded, the call for fiscal restraint (although you can never spend too little for some or too much for others), but most of its communities have looked for ways to continue to provide or increase the quality of their services and the amenities (natural, built, civic, social and cultural) they offer.  It is more difficult for urban areas to attract and retain the skilled individuals with higher levels of educational attainment that are increasingly the key to a vibrant economy because urban cities have to find ways to provide and encourage a level of services and amenities to compensate individuals for living in cities that have the problems associated with urban environments.

Most of the focus of economic development strategies is on creating policies to ensure a “good business climate.”  I think that is important and I also think NH has a pretty good business climate.  With so much concern over population and labor force growth and demographic changes in NH, more emphasis needs to be placed on creating a good “talent climate” as well as a good business climate. I don’t know that the Seacoast of NH has sought to do that but the demographic and economic data suggest they have done so regardless.   The result has been a competitive economic advantage. On a smaller and slightly different scale you can say the same thing about the Hanover/Lebanon area which serves as a nice control group to assure the importance of amenities don’t just mean having an ocean nearby.


** NECTA = New England City and Town Area, a grouping of towns into a connected labor market area, akin to a metropolitan or micropolitan statistical area.

The Lastest 50 State Economic Outlook

February 7, 2013

Back in October I posted about the Federal Reserve Bank of Philadelphia’s leading index for each of the 50 states.  The Fed’s leading index for each state contains the same, six, state and national variables so I think they miss some of key indicators that can affect individual states but they are a great way to quickly compare the trends across states.  It is  also good to get a dispassionate, “outsider’s” view of the direction of every state’s (including your own)  economy.  Below is the latest summary of what each state’s  leading index is saying about the growth prospects over the next six months.

LeadingIndexes1212

Unfortunately, NH is again showing up in the group of states that is expected to lag in economic growth over the short-term.  PolEcon’s NH Leading index contains more NH specific economic indicators than does the Philly Fed’s NH Leading Index but the two indices generally agree on the short-term direction of the NH economy.  Not this time.  PolEcon’s NH leading Index is signalling an uptick in the rate of NH’s employment growth.  As I noted back in October, statistical tests show a stronger relationship between PolEcon’s Leading Index and the rate of NH’s employment growth than the relationship between the Philly Fed NH Index and NH’s employment growth.  I wish I could say I was confident my index was going to be more accurate this time but I can’t.  I do take some comfort in knowing  that whenever I have had the most doubts about the predictive ability of the NH Leading Index it always seems to do the most to confirm its value.

NH Leading Index

The Sun Will Come Out Tommorow

January 3, 2013

I have been uncharacteristically and uncomfortably gloomy in my assessment of the NH economy lately, but I still hold out hope that New Hampshire’s job growth numbers for 2012 will be revised upward early in 2013 based on the volume of help-wanted advertising in the state and reported growth in aggregate wage and salary income in the state.  Even if that doesn’t happen there are encouraging signs that job growth will accelerate.   PolEcon’s NH Leading Index increased this month to a value of 13.0, down slightly from 16.7 the prior month, but it has registered its highest three-month reading since early in 2010.    At least some uncertainty around the  “fiscal cliff” that caused many firms to postpone hiring has been removed.   The U.S. Treasury debt ceiling still needs to be raised this month and a repeat of the last debt ceiling antics could produce another big drop in business and financial market confidence, but overall, the national and NH economies appear poised to see accelerating job growth as 2013 progresses.

Polecon NH  Leading Index

PolEcon’s NH Index of Leading Indicators is a diffusion index consisting of nine state and national indicators of economic activity designed to predict changes in the rate of employment growth in NH.  When index scores are above zero, more of the leading indicators are moving in a positive direction and the NH economy is expanding. The Index has a strong statistical relationship with changes in NH employment, Index scores lead changes in the rate of NH employment growth by 3-6 months.  Using statistical techniques, Index scores can also be converted into a probability that NH will be in  a recession sometime within the subsequent six months.

Leadin Index Components

The Most Important Ideological Debate of 2013

January 2, 2013

It is hard to fix a problem that you don’t  know you have.  That seems to be the case in NH where I still hear “NH has fared better than most states since the recession.”  I disagree and the U.S. Bureau of Labor Statistics is on my side.   Just before Christmas the Bureau of Labor Statistics issued its  monthly report on November employment and unemployment in  the 50 states.  Once again the news was not good for New Hampshire.  Most media reports chose to report that NH’s unemployment rate dropped slightly during the month without noting that the number of jobs located in the state declined in November (John Nolan of the Foster’s Daily Democrat and Rochester Times was a notable exception).

Nov 2011 to Nov 2012 Job Growth

Compared to employment in November 0f 2011,  November 2012 employment in NH was lower by1,700 on a seasonally adjusted basis and lower by 2,500 on a not seasonally adjusted basis.  Only five states have fewer jobs located in their state in November of 2012 than they had in November of 2011.  As I have suggested before, NH’s job growth goes a long way toward explaining why the state’s housing market isn’t seeing the same recovery in prices that appears to be occurring in many other states.

50 state Job Growth Nov 11 to Nov 12

I am hoping that in 2013 policymakers focus much of their debates (ideological or otherwise) on policies that strengthen the NH economy.  I hope that most of those debates encourage the introduction of solid empirical evidence in support or opposition to any proposals (I tried last year but could not find any data or methodology to determine the impact that allowing pistol duels in the statehouse would have on job growth) and are absent the vitriol and ad hominems that characterized so many debates last year.  Policies that can influence job growth can easily accommodate the needs of the two-party system to make the  sort of ideological arguments and distinctions that they feel are needed to influence elections.

Whether job growth is slower now than in the past because employers are not willing to add additional workers (supply side arguments) or because they are not able to find enough or enough qualified workers  (the human capital and “skills gap” argument) is among the most important issues to understand in setting both national and state-level economic policies.  If employers are unwilling to add employees that are readily available,  then the efforts to spur job growth focus more on factors affecting businesses (tax rates, regulations, costs etc.).  If job growth is constrained because employers are unable to find enough or enough qualified workers to fill open positions, then the focus of efforts to spur job growth will be more effective if they look to influence demographic trends, increase the skills of the labor force, and/or better match the skills of workers  to the needs of employers.  In reality this is not an either or question because inadequate attention to the needs of either employers or the workforce will produce sub-optimal economic growth. I’ve tried in this blog to introduce some evidence related to the human capital argument for job growth trends and I will bring some supply side evidence in the future as well.
Ideological or not, respectful and civil or not, recent trends in NH’s job growth and the implications for future growth have to be the first and most important policy debate of 2013.

Hiring by Age: More Evidence of a Skills Gap?

December 10, 2012

I know its a tough labor market for young people and recent college grads, but they still represented a larger portion of new hires in NH in 2011 than would be expected based on the percentage of employment by age in the state.  The chart below shows the age distribution of  employment in NH in 2011 along with the percentage of new hires in the state by age group.   Although job growth has been slow this recovery, the chart still shows that among those who have been hired for a new job (that is the hiring that is not a “call back” of a previously laid-off worker), younger workers make up a disproportionate number of the new hires.

Emp by age

This could be more evidence of, as well as a subset of,  the “skills gap” debate.  Many employers complain that the skills that young workers and recent grads posses don’t match their needs, and this is true for many occupations, but what this data also seems to suggest is that the mismatch between the demands of employers and those seeking work among the existing workforce is even greater than that for younger workers and new entrants to the labor force.  It suggests a bigger problem than just getting kids into the right majors and training programs (although that is a big part of it).  It points to a larger problem of a fundamental change in the types of occupations in demand (or the skills required of the same occupations) as well as a “twist” in the labor market that results in differences in the occupational make-up of industries.  It is a much more difficult , slower, and likely painful process to have the existing workforce adapt to these changes in order to increase their employment prospects than it is to begin with the next generation of workers, although both will challenge future employment and economic growth for some time.

Of course it is possible that employers just prefer younger and perhaps less expensive workers and that is what accounts for their outsized share of recent new hires.  Or it could be a function of the type of industries that were hiring in 2011 (I will be examining this hypothesis).  It may be more comforting to view labor market trends from those perspectives but it won’t get us any closer to taking the personal and policy actions necessary to create greater alignment between the skills of our workforce and the skills needed for a more prosperous economy.

A Simpler But No Less Troubling Explanation for Job Growth Trends

December 5, 2012

A lot of analysts, me included, have been looking for reasons why employment growth has been slower much of this recovery.  That prompts questions about whether the slow recovery from recession is the result of cyclical factors (related to swings in the business cycle) or structural factors that fundamentally and longer-term alter the ability of NH and the nation to create jobs.   While some wait for cyclical factors to improve job growth, in NH there is a lot of talk about demographics, migration, and too often (by me at least) the skills gap or mismatch between job openings and the skills of job seekers.  Much of the demographic story, especially concerns about NH’s ability to attract people from other states,  is relevant – except perhaps for the overblown concerns about NH’s “aging” (more about that in future posts).  I believe demographics and things like the skills gap play an important role in the slow recovery and more general downward trend in job growth, both before and following the recession.  But today, I offer another, simpler thesis, but  one that may be no less troubling.   If you look at job growth trends in NH by industry, you see that since the recession, employment weakness has really been most concentrated in  three sectors of the economy;  construction, government, and financial services.   The chart below shows job growth trends over the past several years for total non-agricultural employment in NH,  as well as total employment minus construction, government, and financial services.  Absent the three hardest hit sectors of the economy, job growth following the recession (until recently that is) didn’t look that much different than the recovery from the briefer, milder recession of the early part of the last decade.

recovery

I know construction,  government, and financial services are important but they still represent just over 20 percent of employment in the state, so the weakness in employment isn’t as broad-based as pessimists (including me at times) suggest.   But what is more troubling is that the weakness in these sectors are more structural than cyclical and thus we may be waiting for a rebound that may never occur.  I don’t think that is true for construction, where at least some rebound will occur as the housing market improves, as business investment strengthens, and whenever the fiscal health of governments improve enough for infrastructure spending to pick up.   But weakness in government and financial services employment is likely more structural.  New financial services regulations are likely to be an impediment to job growth in that industry for some time and there is no end in site for the budgetary impediments that will likely continue to weigh on job growth in the government sector.   I, and others, will continue to look at the implications of such things as demographics and skills gaps on recent and prospective job growth, but we can’t fail to recognize that sometimes  answers are less complex than the questions.