I say this with all of the sagacity of Herbert Hoover who is quoted above: New Hampshire will once again exceed the U.S. rate of employment growth in 2015 and will have the highest growth rate in the Northeast. It has been our state’s decade long nightmare to have sub-par job growth after becoming accustomed to superior job growth for much of the prior three decades. After several years of playing the pessimist it is nice to be able to argue that New Hampshire will once again be a leader in economic performance. Private sector job growth has accelerated and NH is moving up in the state rankings over the past twelve months. A steep decline in energy prices is helping the state by lowering the price of fuel oil, gasoline, and natural gas, lowering some costs for businesses and increasing disposable income of households in a state and region burdened by higher energy costs. Energy producing states are feeling the brunt of price declines. A year ago North Dakota could not be displayed on the graph below without ruining the scale of the Y axis, now they, along with Alaska, Wyoming, Oklahoma and other energy producing states are the laggards. Energy isn’t the reason NH had sub-par job growth but a reduction in energy prices is helping accelerate growth in the state.

The quality of job growth is also improving, with jobs in better paying industries increasing more than jobs in industries that tend to have fewer well-paying jobs. The troubling exception is in professional, scientific, and technical industries where there has been no job growth.

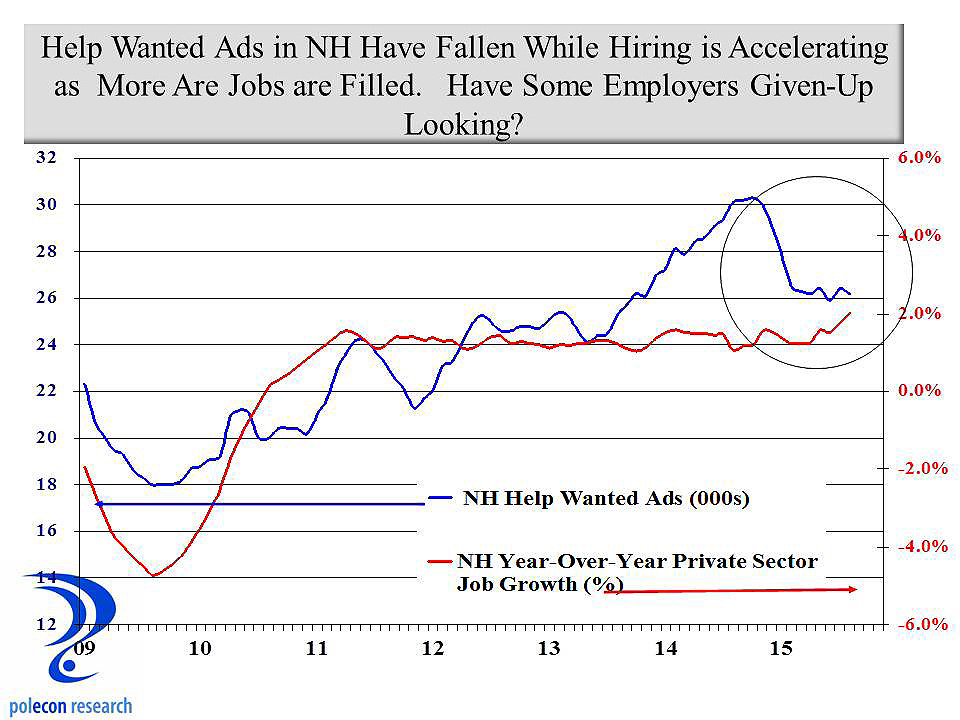
Private sector job growth is accelerating despite the fact that help-wanted ads have declined. I believe this indicates that more jobs are being filled, lowering the number of unfilled jobs, and thus help-wanted ads, even as job growth is increasing. One exception may be jobs in professional, scientific, and technical fields which comprise the largest category of help-wanted ads but where industries that employ the largest number of these occupations appear to have had no net job growth over the past year. A large number of these jobs appear to be going unfilled and indicate a technical and professional labor supply problem in the state.
I expect New Hampshire to add about 16,000 non-farm jobs in 2016, a rate of about 2.5% annual growth. This is a rate higher than any in the past decade and comes with a few caveats. First, energy prices must remain stable and relatively low, this I think is a lock. NH faces more upside potential (things will get better) than downside risk on the energy front. Second, the pace of government job cuts has to slow or reverse. The reduction in local government employment has been a significant drag on overall employment growth in the state, subtracting about 0.5% from the state’s total non-farm job growth rate. And stop please, anyone who thinks cutting local government jobs is a reason for accelerating private sector job growth. Third and most importantly, NH’s labor force has to grow at rates above the past few years. I have recently written about the labor force being the most significant constraint on the NH economy, and largely responsible for NH’s sub-par job growth (as opposed to some fundamental erosion of the business climate). One thing is clear, labor force growth will not come from just absorbing the “slack” in NH’s labor market. The chart below shows that NH is essentially at full employment with the exception of individuals who are working part-time for economic reasons (that is they would like to work full-time but can’t get full-time employment). There will always be some level of unemployment regardless of the strength of the economy, both for frictional reasons as people change careers or jobs, as well as structural reasons as the economy and industries change and the demand for different skills and occupations shifts. There are now more people working part-time for economic reasons in NH than there are unemployed individuals. Three quarters of part-time workers in NH work part-time by choice according to my analysis of Bureau of Labor Statistics Current Population Survey data. The remaining 25 thousand or so part-timers wanting full-time work shows an equal number of men and women, spread fairly evenly over the age distribution between 22 and 64. More than one-third have at least an associate’s degree and 24% a bachelor’s degree. This source of labor can be more fully utilized boosting overall output but they are already working and don’t expand the size of the labor force. Discouraged workers number less than 1,500 with about that number again who are conditionally discouraged but would enter the workforce for the right job. They are predominately male (80%) and older (75% age 45+) and overall have lower levels of educational attainment (although a percentage of college grads is included).

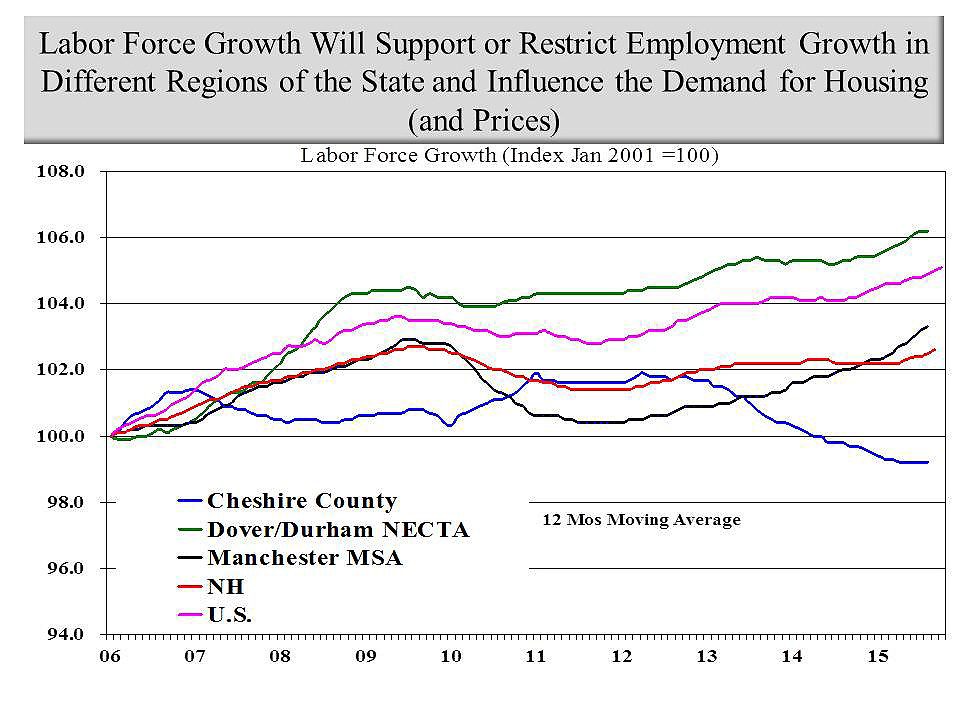
Hope for expanding the labor force in NH comes mostly from a return to net in-migration from other states. NH’s primary source of for increasing the skill and talent of its labor force for three decades, this source became a net negative factor in recent years. Data on this comes with a long lag but some unofficial, non-government statistics suggest that in-migration is returning and accelerating in some parts of the state, supplying an influx of talent and additional labor that will contribute to expanding differential rates of growth in the state. Areas of the state that have seen labor force growth in recent years have been adding jobs at a much faster rate than the remainder of the state and is one reason why I advocate giving as much attention to making a community, region, or state “attractive to individuals and families” as making them attractive to business. The Seacoast will continue to lead in job growth because of the region’s ability to attract “talent” and expand its labor force. Job growth in the Manchester region is picking up and I expect a stronger performance for that region in 2016, while the Nashua region will continue to lag.