Archive for the ‘job growth’ category
December 10, 2012
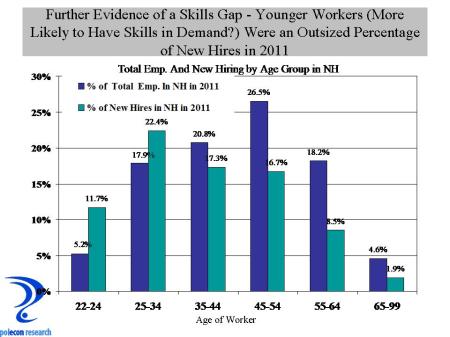
I know its a tough labor market for young people and recent college grads, but they still represented a larger portion of new hires in NH in 2011 than would be expected based on the percentage of employment by age in the state. The chart below shows the age distribution of employment in NH in 2011 along with the percentage of new hires in the state by age group. Although job growth has been slow this recovery, the chart still shows that among those who have been hired for a new job (that is the hiring that is not a “call back” of a previously laid-off worker), younger workers make up a disproportionate number of the new hires.
This could be more evidence of, as well as a subset of, the “skills gap” debate. Many employers complain that the skills that young workers and recent grads posses don’t match their needs, and this is true for many occupations, but what this data also seems to suggest is that the mismatch between the demands of employers and those seeking work among the existing workforce is even greater than that for younger workers and new entrants to the labor force. It suggests a bigger problem than just getting kids into the right majors and training programs (although that is a big part of it). It points to a larger problem of a fundamental change in the types of occupations in demand (or the skills required of the same occupations) as well as a “twist” in the labor market that results in differences in the occupational make-up of industries. It is a much more difficult , slower, and likely painful process to have the existing workforce adapt to these changes in order to increase their employment prospects than it is to begin with the next generation of workers, although both will challenge future employment and economic growth for some time.
Of course it is possible that employers just prefer younger and perhaps less expensive workers and that is what accounts for their outsized share of recent new hires. Or it could be a function of the type of industries that were hiring in 2011 (I will be examining this hypothesis). It may be more comforting to view labor market trends from those perspectives but it won’t get us any closer to taking the personal and policy actions necessary to create greater alignment between the skills of our workforce and the skills needed for a more prosperous economy.
Categories: employment, job growth, Labor, NH Economy, Skills Gap
Tags: age, employment, job growth, NH, Skills gap
Comments: 1 Comment
December 5, 2012
A lot of analysts, me included, have been looking for reasons why employment growth has been slower much of this recovery. That prompts questions about whether the slow recovery from recession is the result of cyclical factors (related to swings in the business cycle) or structural factors that fundamentally and longer-term alter the ability of NH and the nation to create jobs. While some wait for cyclical factors to improve job growth, in NH there is a lot of talk about demographics, migration, and too often (by me at least) the skills gap or mismatch between job openings and the skills of job seekers. Much of the demographic story, especially concerns about NH’s ability to attract people from other states, is relevant – except perhaps for the overblown concerns about NH’s “aging” (more about that in future posts). I believe demographics and things like the skills gap play an important role in the slow recovery and more general downward trend in job growth, both before and following the recession. But today, I offer another, simpler thesis, but one that may be no less troubling. If you look at job growth trends in NH by industry, you see that since the recession, employment weakness has really been most concentrated in three sectors of the economy; construction, government, and financial services. The chart below shows job growth trends over the past several years for total non-agricultural employment in NH, as well as total employment minus construction, government, and financial services. Absent the three hardest hit sectors of the economy, job growth following the recession (until recently that is) didn’t look that much different than the recovery from the briefer, milder recession of the early part of the last decade.

I know construction, government, and financial services are important but they still represent just over 20 percent of employment in the state, so the weakness in employment isn’t as broad-based as pessimists (including me at times) suggest. But what is more troubling is that the weakness in these sectors are more structural than cyclical and thus we may be waiting for a rebound that may never occur. I don’t think that is true for construction, where at least some rebound will occur as the housing market improves, as business investment strengthens, and whenever the fiscal health of governments improve enough for infrastructure spending to pick up. But weakness in government and financial services employment is likely more structural. New financial services regulations are likely to be an impediment to job growth in that industry for some time and there is no end in site for the budgetary impediments that will likely continue to weigh on job growth in the government sector. I, and others, will continue to look at the implications of such things as demographics and skills gaps on recent and prospective job growth, but we can’t fail to recognize that sometimes answers are less complex than the questions.
Categories: employment, job growth, NH Economy
Tags: construction, economic recovery, Financial services, government, job growth, NH, recession
Comments: Be the first to comment
November 28, 2012
Small businesses fared the worst during the recent recession and hiring by small businesses has been slower to recover after this recession than it was following past recessions. Robust economic growth does not occur unless small businesses are confident, healthy, and hiring. With a fragile national recovery from recession that has not quickly helped to repair the balance sheets of most small businesses, and with a number of important public policies (regulatory, tax, health care etc.) still uncertain, it is not surprising that small businesses have been less than sanguine about the prospects for the economy and reluctant to hire. That may be changing, however, as the NFIB’s national index of small business optimism has begun to increase. The NFIB index is a pretty good predictor of the direction of job growth in NH and its latest up-tick is consistent with last month’s increase in payroll employment in New Hampshire.

Categories: job growth, NH Economy, Small Business
Tags: employment growth, NFIB, NH, optimism, Small businesses
Comments: Be the first to comment
November 21, 2012
A quick review: The “skills gap” explanation for slower employment growth this recovery posits that there are large numbers of jobs waiting to be filled but hiring is sub-par after the recession because of a lack of qualified candidates to fill those positions. Twice I have presented some evidence on the issue, here and here. Most of the concern and evidence about the existence of a skills gap addresses very high-skill technical, scientific, computer, and engineering occupations because our nation, and by extension our state, seem to perpetually be unable to produce enough individuals in those fields to satisfy industry demand. As a result we “import” a lot of that talent from foreign countries (more about this – I promise – in a future post). There is some evidence of this in NH. As the chart below shows, professional, scientific, and technology occupations are the largest, broad category of help wanted ads in the state. But they have also evidenced the smallest increase (a decrease actually) since the recession. There is still a significant demand but it may be that an inability to find qualified applicants has companies in need of those occupations from considering more hiring in the Granite State. A quick review of data for Massachusetts shows that demand for professional, scientific and technical occupations has increased during the same time period.

But more direct evidence of a skills gap comes from the demand for construction and production workers. I am especially interested in the potential skills gap for production workers. The chart above shows that demand for construction, production, and transportation workers has increased significantly since the recession. Although still a much smaller category of help-wanted ads than professional and technical jobs, the increased demand is consistent with anecdotal evidence I heard this week at a roundtable discussion of the Seacoast economy. At that discussion, representatives from industry, higher education, and economic development organizations cited specific examples of companies frustrated at their ability to hire skilled production workers. Some are forming partnerships with NH’s community college system to increase the supply of needed occupations. Those initiatives show promise and I hope the state’s four-year colleges and universities develop more partnerships to address the skills gap in professional, scientific and technical occupations as well because, increasingly, job growth in NH appears to depend on it.
Categories: Help Wanted, job growth, NH Economy, Skills Gap
Tags: help-wanted, job growth, NH, occupation, occupational demand, Skills gap
Comments: 1 Comment
November 20, 2012
The U.S. Bureau of Labor Statistics released its monthly report on state and local employment today and the good news is that, preliminarily, New Hampshire added 1,000 jobs in October. The bad news is that this is just 1,200 more jobs than the state had one year earlier in October of 2011. For optimists, the most recent trend is likely to be the most important and the monthly report is consistent with the rise in PolEcon’s NH Leading Index.

Nevertheless, the longer-term job growth trend in NH has been weak. Looking at growth in just private sector employment, the situation is no better for NH. As I have noted here, I believe job growth in NH is being underestimated but even if that is true, it is hard to see how the recent past will be revised enough to make NH’s job growth picture look comparable to that of our neighbor to the south or the U.S. as a whole.

Categories: job growth, NH Economy, U,S, Economy
Tags: employment, employment growth, job growth, jobs, NH
Comments: 2 Comments
November 2, 2012
A good national job growth report was released today that showed private sector job growth was up 184,000 in October. With government job losses at -13,000, total employment increased nationally by 171,000. We have to wait a few weeks to see NH’s job growth for the month but regardless of the number, the underlying causes of the state’s relatively slow recent job growth still need to be debated . A solid and empirically-based understanding of the factors influencing job growth rates is the only way to formulate effective economic policy in the state. I am on record as saying (probably too often) that I believe NH’s job growth numbers will be revised upward at some point (probably with the annual revisions released early next year). But even if that is true (errr, when it is conformed to be true), by historical standards, recent job growth in NH will still have underperformed. Whether job growth is slower now than in the past because employers are not willing to add additional workers or because they are not able to find qualified workers (the “skills gap” argument) is among the most important issues to understand in setting both national and state-level economic policies. If employers are unwilling to add employees that are readily available, then the efforts to spur job growth focus more on factors affecting businesses (tax rates, regulations, costs etc.). If job growth is constrained because employers are unable to find qualified workers to fill open positions, then the focus of efforts to spur job growth will be more effective if they look to increase the skills of the labor force, and/or better match them to the needs of employers. In reality this is not an either or question because inadequate attention to the needs of either employers or the workforce will produce sub-optimal economic growth. But in today’s polarized policy environment whatever light is shed on these issues is too often separated by an ideological prism that produces policy proposals aimed at either the needs of business or the needs of the workforce to the exclusion of the other. If job growth is slowed because there are too few qualified workers to meet the needs of businesses then it is not policy maker’s fault but they can help alleviate the problem by adopting more “human capital” policies. Businesses bear some of responsibility for any skills gap because studies have shown that businesses spend less time and money training workers than they did decades ago, and that more of the training that does occur is concentrated on management positions rather than mid- and lower- level positions. In an age when job turnover has accelerated, and the tenure of workers with one businesses continues to decline, it is understandable that businesses would be less willing to invest in workers who may only be with their firm for a short while. But who is more responsible for the decline in employer-employer loyalty and tenure? The labor market has been signaling strong demand increases in many occupations – especially technical and scientific occupations and increasingly skilled production occupations. Older and experienced workers may have difficulty responding to these demands if their experience, education or training is in occupations in less demand but why are younger and new entrants to the labor market not responding to these labor market signals by selecting the majors or training programs that would qualify them for more occupations in demand? One reason is that regardless of whether or not the labor market is signaling many job opportunities in technical and scientific occupations (or skilled production occupations), if large numbers of the emerging workforce don’t have the intellectual and academic rigor to study these subjects the positions will increasingly go unfilled, go elsewhere, or as I will document in a later post, be filled by foreign born workers.
Ok, that was a bit of a rant, now back to the core issue. Is there evidence of a skills gap in NH that is constraining job growth? The answer of course, as it is with almost all economic issues, is both yes and no and also something in-between and with a twist. I will share this evidence across several postings, today I offer one, small bit of evidence that suggests the skills gap is playing a larger role in disappointing job growth trends. I noted in an earlier post that help-wanted advertising has generally been on the rise in NH, while job growth has not. Some of this will be corrected with job growth revisions, but evidence that a skills gap is playing a role comes in the form of the percentage of help-wanted ads each month that are “new ads”. If help-wanted ads are rising and the number or percentage of new ads is rising similarly each month, that means positions are being filled at a fairly consistent rate, but if the number of ads is increasing, but the percentage of ads that are “new ads” is declining, that suggest that positions are not being filled or taking longer to fill – perhaps suggesting employers are having a harder time filling the positions or a skills gap. The chart below shows that indeed, the percentage of monthly help-wanted ads in NH that are :new ads” for the month has been slowly declining, providing some small bit of support for the skills gap explanation for job growth. A lot more evidence is needed, but given the importance of the issue in policy making, it is worth the effort to find or refute it.

Categories: Educational Attainment, Help Wanted, job growth, NH Economy, Skills Gap
Tags: help-wanted, job growth, NH, Skills gap
Comments: 1 Comment
October 30, 2012
For an economy struggling to gain altitude it is hard to see how the impending spending cuts and tax increases associated with the “fiscal cliff” will do anything in the short-term but bring the economy to stall speed or push it back into recession. At a time when compromise is seen as weakness and ideological impurity, an agreement must be reached in order to avoid the negative effects of the the fiscal cliff. Depending on what is included, the ‘fiscal cliff includes anywhere from $500 to $700 billion in combined spending cuts and tax increases (many via the expiration of temporary cuts).

All states will feel the effects of the elimination of the temporary cut in the payroll tax but states with a higher percentage of high-income taxpayers will likely be affected more by the expiration of Bush era tax cuts. Despite often being characterized as a “tax haven” for the rich, NH is much more a “haven for the middle class” as it has a somewhat higher percentage of high-income households than the U.S. (but much lower than MA) and a relatively smaller percentage of lower- income individuals. The percentage of high-wealth individuals in NH is above the U.S. average, but the percentage of income taxes paid by those making $200,000 or more in NH is lower than 24 other states.

States where higher-wealth individuals pay a larger portion of the state’s tax burden are likely to be relatively more affected by the tax cut expiration provisions of the fiscal cliff. But NH will still see an estimated increase in payroll taxes of about $650 million, a significant drop in disposable income in the state. In addition, a study by George Mason University’s Center for Regional Analysis estimates that the defense department and non-defense department budget cuts that will result from the fiscal cliff will cost NH about 6,300 jobs and $325 million in labor income. NH no doubt will take some solace from the fact that Massachusetts is likely to see nearly 10 times the job losses from budget cuts to defense and other purposes (especially medical) and as a result of their high percentage of high-wealth households.
I want to think a reasonable resolution will be found that avoids the worst of the potential problems from the fiscal cliff. Fiscal tightening is clearly warranted, and it appears almost certain that at a minimum the payroll tax holiday will be allowed to expire as well as the Bush era tax cuts for upper income households. It is also almost certain that long term unemployment insurance benefits will be allowed to run out. After that, it all depends on one four-letter word – compromise.
Categories: Fiscal Cliff, Fiscal Policy, job growth, NH Economy, Politics
Tags: budget cuts, fiscal cliff, household income, middle class, NH, tax cuts, tax increase
Comments: 3 Comments
October 22, 2012
Nothing gets you thinking about gender equity issues more than being the father of three daughters, except maybe being the father of four or more daughters. In my upcoming October edition of “Trends Lines” I am looking at trends in NH’s labor force. One of the more significant trends is the increasing percentage of women employed at businesses in NH. Despite the fact that men participate in NH’s (and the nation’s) labor force at higher rates (about 9% higher in NH) than do women, women now are a slight majority of employees at businesses in NH. Women comprised 51% of employees covered by unemployment insurance during the third quarter of 2011 – the most recent data available. Only in Hillsborough and Sullivan Counties are men a majority (and by less than 1%) of employees at NH businesses.

Among workers with the highest level of educational attainment, those with a bachelor’s degree or higher, women comprise 52% of those employed by NH businesses. Moreover, the percentage of NH workers with the highest levels of educational attainment who are women is likely to increase because the percentage of new hires (not including recalls of layoffs), with at least a bachelors degree, who are women, is now even higher (53% – see chart below). These differences don’t seem large, but over time they have tremendous implications for the economy and for society.

I don’t know if this data says more about the changing nature of the workplace or the changing nature of the male workforce, but as the father of three daughters, my anecdotal experience leads me to believe it is more about the latter.
Categories: Demographics, Gender, Help Wanted, job growth, Labor, Recession
Tags: educational attainment, feminization, labor force, new hires, NH
Comments: 2 Comments
October 19, 2012
The Philadelphia Region Federal Reserve Bank is producing a leading economic index for each state. The index contains the same economic variables for each state so it is not customized to the specifics of each state’s economy. Some of the index variables are national (similar to my “PolEcon NH Leading Index”) but all of the key economic indicators included yield important information about the likely direction of any state’s economy. The graph below from the Philly Fed suggests that NH, along with VT and CT, will lag the region and much of the country in economic growth over the coming months.

The Philly Fed index isn’t designed to predict just job growth like PolEcon’s (my) NH leading index, but the two indices move in similar ways with changes in the NH economy. I’ve test the ability of both to accurately forecast near-term (6 month) job growth and the PolEcon index does a significantly better job. But the PolEcon Index was modeled and fit specifically to NH data, testing a number of economic variables that have the strongest relationship to NH’s near-term job growth. Doing that for 50 states might be prohibitive, especially for an institution (The Philly Fed.) that primarily serves one economic region of the country. I like the Philly Fed index because and it is great to have a readily available (read free), state-by-state, near-term, economic outlook from a respected and unbiased source. I like it even more when it agrees with the PolEcon Index, as it does now.

Categories: job growth, NH Economy, U,S, Economy
Tags: Federal Reserve, Leading Index, PolEcon, PolEcon Leading Index, state leading index
Comments: 1 Comment
October 18, 2012
Two charts may tell an important story about New Hampshire’s labor market and perhaps trends in the economy. Help-wanted advertising has been rising in NH and as I’ve written before, it suggests job growth should be higher in NH based on the long-term relationship between help-wanted ads and employment growth in the state. A “skills gap” is one explanation for the divergence between help-wanted and job growth in NH, but I also offered that the divergence, along with trends in aggregate wage growth in NH may mean employment numbers will be revised upward. My money is still on an upward revision of job growth, with the skills gap playing an important role for some industries and occupations, because NH has more help-wanted ads per 100 individuals in the labor force than all but 10 states – job growth should be higher (chart below).

I would be more convinced of the skills gap being broadly responsible for slow growth in the state if a high percentage of help-wanted ads in New Hampshire were for the highest skill occupations (professional, technical, scientific and management), but as the chart below shows, NH ranks well down the list of states on the percentage of help-wanted advertising that is for the highest skill occupations. A skills gap could still exist between available jobs and available labor for occupations requiring specialized skills and training, even if they are not in professional, technical , or managerial occupations. Anecdotal evidence suggest many employers are having difficulty finding workers with the right skills. The skills gap demands further investigation, right now I am more concerned about what the relatively lower demand in NH for the highest skill occupations implies about our state’s economy.

Categories: employment, Help Wanted, job growth, Labor, NH Economy, Skills Gap
Tags: Economy, help-wanted, labor demand, NH, Skills gap
Comments: 1 Comment


