Archive for the ‘Fiscal Policy’ category

What’s Behind the Weak Jobs Report?

April 5, 2013

Bad news arrived today with the release of the monthly employment report by the U.S. Bureau of Labor Statistics.  Only 88,000 non-farm jobs were added across the country in March. Following  two months which saw the U.S. add 148,000 and 268,000 jobs respectively in January and February, the low number raises concerns that the U.S. may again be heading for a “Summer slump” after showing signs of stronger job growth early in the year.

I share that concern but I am most interested in what the job growth numbers may or may not imply about recent U.S. economic and domestic policies.  I know sequestration is the hot policy topic and may be blamed or credited for all evil or good that occurs in the U.S, economy this year, but it is really too early for it to register much  impact on March’s job growth.  Two other policies have the potential to more significantly impact job growth in the near term.  The details of the March employment report provide some clues about if and how these policies may affect job growth in the future. The elimination of the temporary reduction in the payroll tax and health care coverage mandates in the Affordable Care Act are policy impacts that we worried about before we started worrying more about the potential impacts of sequestration.

I last posted that gains in home values, stocks and, retirement accounts along with increases in wages and salaries would help the economy overcome the large potential impact on consumer spending from the rise in the payroll tax (elimination of the temporary rate reduction) that took effect in January.  I may have been a little too optimistic about those factors ability to help the U.S. economy overcome more than $100 billion in lost consumer spending power (over $600 million in New Hampshire).   For me, the most troubling piece of data from the March job growth report was the seasonally adjusted decline of 24 thousand retail trade workers and generally downward trend since January, that has followed several months of solid gains in late 2012 (chart below).

U.S. Retail emplyoyment

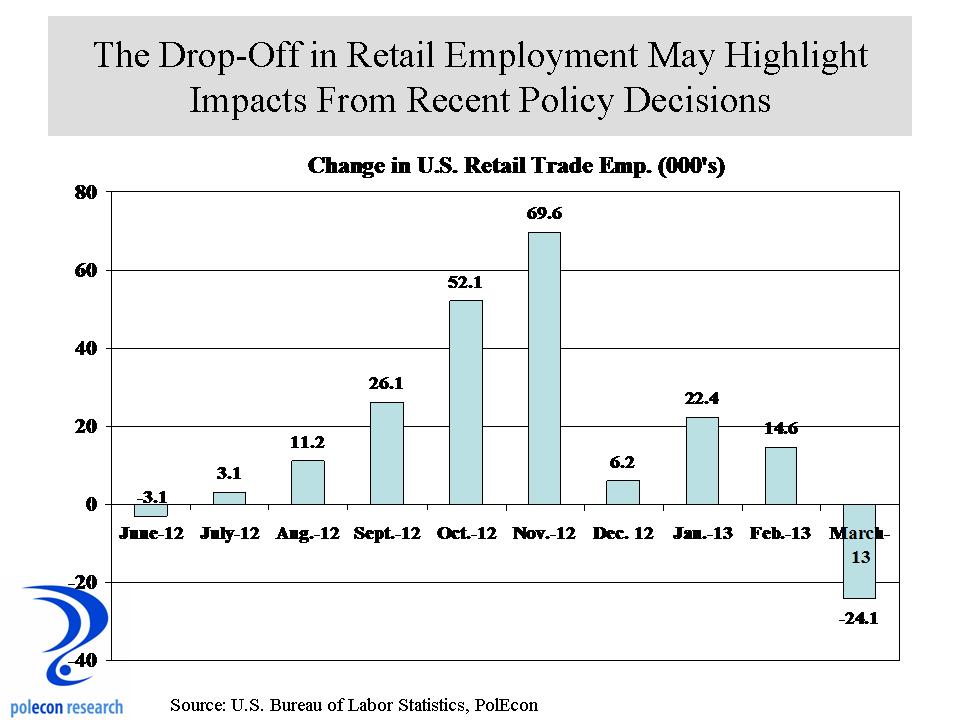
When housing values are recovering, homeowner’s equity is rising, and employment and wages are growing, retail employment should not decline.  The elimination of the payroll tax cut (along with higher gasoline prices early in the year) likely provided a greater shock to consumers than anticipated.  But another explanation is that implementation of the health care mandates of the ACA could be affecting employment more in some industries.  If so, it would likely impact industries that typically are less likely to offer their employees health care coverage and industries that employ more part-time workers.  Retail and leisure and hospitality industries  meet those criteria but only retail trade lost employment in March.  Because the ACA mandates coverage for full-time employees, one way to avoid the mandate would be to increase part-time employment.  In that case I would expect the average weekly hours of workers in retail or other industries that may be more  affected by the mandate to decline, as more workers were shifted to part-time status but average hours have increased slightly in retail over the past three months.  Looking more closely at the data on part-time employment is needed to get a handle on any ACA impacts.  Over the next few months I will be looking for evidence of  increases in the number of workers working “part-time for economic reasons” – meaning they are working part-time when they want to be working full-time, as well as employment trends in businesses employing between 50 and 499 workers (those most affected by ACA).  Trends in these employment data would provide stronger evidence of any ACA effects but for now, it looks like the payroll tax is the culprit in the retail employment data.

Funding Roads and Bridges to Perdition

March 25, 2013

Gasoline taxes, road tolls and highway infrastructure spending are issues at the forefront of a lot of heated debates in state legislatures across the country.  I am going to write about the issue a couple of times this week.   Some lawmakers want to raise sales or other taxes to pay for infrastructure and others want to increase gasoline taxes and other “user fees” to pay for it.   The highway infrastructure spending and revenue issue can illustrate classic principles of sound fiscal and economic policy so it is too bad that the debates have generally taken the “low road” by framing the issue almost entirely as either one of “who wants to raise taxes and who doesn’t,” or “who wants to makes roads and bridges safe and who doesn’t”.

User fees are a good thing and it is sound fiscal policy to have the users of roads pay for them via gasoline taxes, road tolls, and other fees that reflect an individual’s usage of roads and bridges.  When general revenues are used to pay for roads and bridges people who don’t necessarily use them wind-up paying for a portion of highways and subsidize the usage of roads of those who travel them a lot.  When you subsidize something you can bet you are going to get more of it than you would have gotten without the subsidy and in this case that means more travel on roads which, of course, means there will be more need for roads and spending on roads and that means more subsidy and that approach is surely a road to perdition.

It was nice to see New Hampshire rank high in a recent report (issue brief) by the Tax Foundation on the percentage of  highway spending that is funded by user fees like gasoline taxes, tolls and other fees.  Unfortunately, in making good points about user fees, the Foundation draws the wrong conclusion about the data it uses to make them.  That happens a lot when you use bivariate analysis to draw conclusions in a multivariate world.  Instead, using multivariate (regression) analysis on the data, it becomes clear that it is less the use of good principles of fiscal policy that results in states paying for a higher percentage of the costs of highways with user fees, than it is a function of the volume of federal government grants they receive.  So a cursory look at the Tax Foundation’s report can give NH a sense of superiority in fiscal policy over many states (while I generally think that is true about NH it is not so much in this case),  and especially over Vermont because that state funds just under 20% of its highway spending with user fees compared to NH’s 42%.  The real reason those percentages are what they are is that Vermont receives about 64% more federal highway funds per capita than does NH ($220 to $134 in 2010). The chart below shows the simple relationship between the percentage of highway spending in a state that is funded by gas taxes and user fees and the amount of federal highway funding per capita in each state.

User fees and Fed funds

States like NH that fund a higher percentage of highway expenditures with user fees do generally receives lower amounts of highway funds from the feds (the data point slope downward to the right).  There are even more intervening variables, like the amount of federal highways (by mile) and as a percentage of all highways that are in a state but still, by far, the amount of federal highway funding per capita is the best predictor of the volume of highway spending per capita in each state. The amount of motor vehicle-related user fees per capita were a distant second but still significantly related to highway spending.

Fed Highway per capita

Almost everyone agrees that NH’s (and every other state’s) roads and bridges are in need but I don’t think the debate is ever going to be about the wisdom of user fees versus general revenues in paying for highway infrastructure.  It is too bad because if it were we just might reduce the need for more spending in the future.

Where The U.S. Leads the World (Almost)

March 13, 2013

According to a report by KPMG, the U.S. has the second highest corporate income tax among all nations.   I don’t know what the workforce is like in Vanuatu and I am not certain how I would feel about worshiping at a shrine that is the remnants of a wrecked WWII B17 bomber, but if those aren’t concerns to you they have a 0.0% corporate tax rate.  So also do Bahrain, Georgia, Saba, as well as some well known industrial powerhouses such as the Bahamas, Bermuda, and the Cayman Islands.

That we (the U.S.) have almost the highest statutory corporate tax rate in the world is the focus of a lot of debate in Washington, but what is probably more relevant is the dramatic differences in the effective tax rates of different industries in the U.S..  Aswath Damodaran, Professor of Finance at the Stern School of Business at New York University, calculated the average tax rate of various business sectors using public financial statements.  The chart below illustrates the disparity between the average tax rates  paid by different sectors of the U.S. economy and includes only the highest and lowest twenty industries.  My purpose isn’t to single-out any industry or group of industries so the chart isn’t a commentary on the merits of any particular industry, I’ll let readers make their own assessments about the implications of varying rates on different industries.    The chart shows the average rate based on the public filings of over 6,000 publicly traded companies and includes only the rates  for profitable companies.    Effective marginal rates would be better to show but public data does not allow for that estimation.

Tax rates by industry

Unfortunately, it does not seem that the high level of concern about the world  ranking of  the U.S. corporate tax rate is matched by a concern about the large differences in effective rates by industry.  A lot of people are all for reducing the statutory corporate rate in the U.S., they just aren’t so keen on reducing or eliminating  the $100 billion + in preferences and breaks that could pay for it without adding to the nation’s deficit.

Educational Attainment, Economic Prosperity and Fiscal Reality

March 4, 2013

I write and speak a lot about the importance of demographics to community and regional prosperity.  Over the past several years I have written and spoken about my belief that communities wanting to increase the number and quality of employment opportunities available in their town increasingly need to recognize the importance of being an attractive place for skilled individuals with higher levels of educational attainment.  Employers in emerging and growing industries  locate in areas where the pool of talent (skilled, well-educated individuals) is “deep” or growing.   A community can still see employment growth even if it doesn’t have a lot of skilled, well-educated individuals if it is located in a region that does have enough of them but the impact on and benefits to the community will be very different.

It is hard to empirically test the importance of skill levels and educational attainment to job growth in individual communities but anyone involved with the location and expansion decisions of employers knows how important the availability of a skilled and educated labor force is.  Because the occupational needs of employers in different industries varies greatly, I, and others, often use the percentage of the population age 25+ with at least a bachelor’s degree as a surrogate for trends in the education and skill-level of the workforce in a community or region. It’s a good way to labelled an elitist, at least by those who don’t know anything about you.  I don’t think only college graduates can get good jobs but it is clear to me that trends in the educational attainment of the population of cities and towns is a pretty good indicator of how the economic fortunes of a community are changing. I’ve tested the relationship statistically and found that there is a  relationship between the change in the percentage of individuals age 25+ with at least a BA degree in a community and employment growth over the past decade.  There are a lot of factors that influence employment growth but over past decade communities that have had larger increases in the percentage of individuals with high levels of educational attainment generally have had better job growth (or at least less negative growth).  The relationship narrowly missed statistical significance when tested on NH’s 40 most populated communities.  Since the recession in the early 2000’s, there has been virtually no private sector job growth in NH (primarily because the last “‘great recession” wiped-out gains from the middle of the decade).  The chart below crudely divides NH’s larger communities into quartiles according to the change between 2000 and 2010 in the percentage of their population age 25+ that has at least a BA degree and the mean change in private sector employment between 2003 and 2011.  One caveat, the figures for 2010 used to calculate this is based on the three-year average of American Community Survey values and smaller communities have larger margins of error in the survey results.  It is just one of the challenges in documenting the relationship between demographics and economic performance at the community level.  Nevertheless, I think  the data point to a relationship were towns that are seeing increasing levels of educational attainment among their population are performing better economically than than those that are seeing less of an increase.

job growth and ed attainment change

It also says a lot about how the character of a community might be changing.  I live in city that has seen a significant increase in the percentage of its population with a BA degree or higher over the past two decades.  That change has contributed to changing expectations of the community (the type of services and amenities it offers).  That type of change creates a clash between the old and new that has and continues to characterize many communities.  In many ways I believe local tax cap debates are more about demographic and socioeconomic changes than they are about economics and fiscal policies.  But I digress.

Skilled individuals with higher levels of educational attainment have the most economic opportunities and they are the most mobile.  I think keeping and attracting skilled individuals with higher levels of educational attainment is an increasingly important economic development strategy for communities.  Looking at changes in educational attainment between 2000 and 2010 among NH’s largest communities shows some interesting patterns.  Not surprisingly, some of the communities that have done the most to restrain expenditures have seen the smallest increases in educational attainment levels (some towns like Durham had such high levels – 77%  – they have no way to increase much).

ed attainment change by town

Spending liberally is never a good thing but providing the services and amenities desired by skilled and educated individuals and families at a price (in terms of local taxes) lower than other communities is a good way to accumulate the talented workforce that can increase real prosperity in a community.  Just adding skilled and educated individuals isn’t enough for employment growth, particularly if a community doesn’t want to be a center of employment or is otherwise inhospitable to employment growth.   I don’t think a low tax price alone is enough to attract talent and I don’t think providing amenities and services without regard to price is enough either, but too often never the twain shall meet in striking a balance between prices and  services and amenities and longer-term community development objectives.  I don’t know many local budgets that can’t be cut but unfortunately the cuts usually come at the expense of those services and amenities most likely to help a community attract or retain individuals with the most economic opportunities and choices of where to locate.  When I say or write these things I risk being labeled a big spender or liberal.  In reality I am just documenting trends that seem pretty clear to me.  Nevertheless, my advice to others is never bring data to an ideological fight if you want to escape unscathed.  In an age of austerity, spending decisions need to consider both the current  fiscal reality as well as the longer-term implications for the economic prospects  of  a community.

Raising Issues With Raising the Gas Tax

January 28, 2013

“With the Patriots headed to the Super Bowl, now is not the time to increase the beer tax.”   Either the Governor strongly identifies with us commoners or there was going to be one heck of a Super Bowl party at the Hassan household.   I hope our Governor’s positions on important fiscal issues are more considered than her sports predictions and  I wonder  how she feels about raising the gas tax in New Hampshire now that many Patriots fans are more likely than they were a couple of weeks ago to go driving to ski, shop, or hike next Sunday.

No doubt revenues from NH’s gasoline tax and its road tolls are stagnant or declining.  Higher gasoline prices have reduced discretionary driving and prompted greater fuel efficiency in our choice of automobiles and a steep recession further dampened gasoline consumption.

NH gasoline sales

No doubt there are a lot of transportation infrastructure needs that are clamoring for state revenues that are not likely  to increase organically.  Gasoline sales (and the revenues derived from them) will not rebound to levels seen early in the past decade.  Beside greater fuel efficiency, the volume of traffic at key border locations (I93, I95, Everett Tpk.) has declined by 7.4% between 2004 and 2011.  Traffic volume at toll booths on these roads, however, declined by just 3.9% during the same time period (chart below).

Border traffic

Of course the implications for gas tax and road toll revenues are significant, but those trends follow trends across the nation.  When I look at the data, the smaller decline in toll booth traffic than in overall border traffic suggests to me  that commuting is being less affected than is more discretionary travel.  That has even more profound implications for longer-term trends in NH’s general revenues because they depend so heavily on discretionary travel and discretionary spending.   One measure of how important discretionary travel is to NH is the fact that the state ranks fourth in spending per capita on gasoline.

Gasoline Exp per capita

Like beer or cigarettes, its not that we drink or smoke that much more than residents of other states, its that our numbers are increased by the high volume of visits the state receives.    I appreciate that the implications of the gas tax in terms of infrastructure investments is an important discussion to have.  I also think a discussion of the implications of a higher gas tax on the larger revenue issues facing the state ought to be evaluated.  That evaluation needs to be more thoughtful than the typical arguments made by opponents of any excise tax increase (“if we raise the gas tax we will lose not only gasoline sales but a billion dollars in potato chip and chewing gum sales”).  I don’t know whether the gas tax should be raised and I don’t know what the impact of an increase would be in a larger economic and revenue context but  I do know that higher gasoline prices affect a number of revenues because I have analyzed that in the past.  That isn’t reason enough to drop the idea of raising the gas tax, but it is reason enough to discuss it in a broader context than just the funding of infrastructure.  Maybe I’ll get that chance when my invitation to the big Super Bowl party in Exeter arrives, I’m eagerly off to the mailbox now to look for it.

Striking an Economic Strategy With Maslow’s Hammer

January 22, 2013

The great psychologist Abraham Maslow is famously quoted as saying:  “When the only tool you have is a hammer you tend to see every problem as a nail.”   Maslow gave us all too much credit. When we (NH) have a hammer and know how great it is, we not only treat everything as a nail, we actually perceive everything to be a nail.  We (me included) develop a blindness to “non-nail” problems and creative problem solving takes a back seat to picking up that hammer and smashing the problem.

NH’s relatively low state and local tax burden, especially compared to other states in the Northeast, has and should continue to provide the state’s economy with significant competitive economic advantages.  In an era where “talent” – skilled, well-educated individuals are the resource businesses are most in need of, our state’s fiscal structure has been a magnet for higher-skill, more highly-educated and more mobile individuals and families.  So why does it currently not appear to be offering a competitive advantage (based on job growth and population migration data)?   The question is whether our fiscal system will be enough of an advantage in today’s economy to assure the kind of growth and prosperity the state became accustomed to over much of the past several decades.  Based on the screams of joy I heard last week, the answer for many in NH is a resounding yes.  The news that Massachusetts’ Governor Patrick is proposing to raise income tax rates in that state has been greeted by many in New Hampshire as if the cloud that is NH’s slow job growth is about to be lifted.  Once those new Massachusetts tax rates are enacted NH’s schools and students will perform better, our electricity prices will drop, our young people will choose to enroll in the  newly affordable colleges in NH,  and our communities will be safer, cleaner and offer more and better services at ever lower prices.  For too many in our state,  the future of  NH’s economy is largely determined not by what we do as a state, but by the mistakes that other states make.  I’m no Doc Rivers or Bill Belichick but I don’t think their game plan is ever solely predicated on the other team’s mistakes.   Great states, like great teams, can succeed even when the other “team”  is playing their best.

The monthly state job growth numbers for December, released late last week, continue a disappointing trend that should have NH businesses, policymakers, and citizens asking whether Maslow’s hammer is the only tool to use in shaping an economic strategy for NH’s future.

Annualized Emp. Growth

In the case of economic policy in NH, the “nail” is the high taxes which we have been pounding with our hammer for decades.  For the most part,  NH has successfully pounded that nail well below the surface.  As the chart below shows, state and local taxes as a percentage of personal income in NH are well below the U.S. and neighboring state averages.  Occasionally the nail it pops-up but is usually driven down.  Note that while it did rise for a time during the recession, this was a result of a slow and declining income growth rather than a rise in taxes.

State and Local Tax Burden

The problem is that our love of the “hammer’  as our primary economic tool appears to result in us using a longer and longer nail set in an effort to achieve the same levels of economic success as we have in the past.   Governor Patrick’s proposal to raise Massachusetts’ tax rates may benefit NH, I hope it does, but if it increases the use of our hammer, to the exclusion of other tools,  the benefits may be illusory.  A low tax burden is a great asset but the skilled, well-educated, individuals that drive economic success for the most part (it is certainly not unanimous)  also want the amenities and services that people free from want generally like to enjoy – things like good schools, civic, cultural, social, natural  and recreational amenities.  People want to pay as little as possible for these amenities for sure (and in many cases they expect them for free), but they want them nevertheless.  I think NH’s advantage is really been about providing ‘value” as much as it is about providing just a low tax burden.  As long as we can provide the services and amenities that people want, at a tax price lower than other places, we should be a magnet for the kind of individuals that will help our state thrive.

Our state’s hammer is and will continue to be a great tool, but not for every job, and not if it is used indiscriminately.  Every increase in a tax or raising of a fee isn’t an end to the “NH advantage.”  It wasn’t during the 1980’s or 1990’s when the state was growing remarkably even as taxes and fees with tinkered with (and even one or two major changes) by both Republican and Democratic administrations.  The key is knowing the true economic consequences of changes to different fiscal policies, which ones really hurt or help the economy and which ones have little impact  and by how much.

I like NH’s hammer and I have argued how it has been a great tool in helping us build a house that withstood the ill winds that blew through the Northeast region for decades.  I hope NH’s basic fiscal structure doesn’t change.  But we have become so comfortable wielding our hammer that in our casual over-reliance on it we may just be pounding on the thumbs of those who would live in the nice house with which it was built.

Ideologically Uncomfortable Economic Growth in New England

January 11, 2013

State government revenues in NH have grown more slowly over the past few years than almost every other state in New England and there aren’t any signs on the horizon that revenue will grow substantially over the next biennium.

General Revenue Growth

Some of that is the result of policy decisions that looked to reduce taxes in NH in order to increases economic growth, some is the result of other states willingness to expand or raise taxes, and some of it is the result of the fact that NH’s economy has been growing more slowly than most NE states with the exception of Rhodes Island and Maine.  How much of the slow revenue growth is attributable to a weaker economy and how much is attributable to policy changes is difficult to discern.  In some cases it is easy, the cigarette tax was reduced and produced less revenue (almost exactly the amount that I forecast) but more generally, slower growth (or declines) in revenues will occur in a weak economy regardless of policy changes.   Even without a definitive answer to that question we can still learn something from the fiscal and economic experiences of NH and neighboring states over the past few years.

Because it seems that it  is all ideology all the time in public policy debates these days, lets filter the revenue and growth debate through the ideological prism that characterizes most legislative bodies and public debate today.  For some in NH, it is bad enough that both Massachusetts and Vermont (that would be two-thirds of the Holy Trinity of New England socialism if socialists were allowed to believe in the Holy Trinity) have enjoyed stronger economic growth than NH over the past nearly two years.  But it is even tougher to accept that each of these states can enjoy faster growth than NH at the same time they are seeing stronger growth in revenues, and maybe even at a time when they took steps to keep revenues from falling too far, because to ideologues on one side, more revenue has to mean slower economic growth and the only way to get stronger growth is to cut revenues.

NE emp growth

The other end of the political spectrum will argue that the collecting more revenue has allowed these states to invest in more of what their economies need to grow, but there hasn’t been a whole lot of “investing” by state and local governments anywhere in recent years and each of these states has taken some steps to reduce the size and scope of state government expenditures in recent years.  The reality of course, as it almost always is, is somewhere in that wasteland (according to ideologues) known as “the middle”.   The stronger revenue growth of some states is largely a function of stronger economic growth and not necessarily the “investments” those revenues allowed but it can also be said that their generally higher levels of taxation have not disadvantaged their economic performance in relation to NH with its lower level of taxation.  Some of NH’s slow revenue growth is the result of policy decisions but most is related to an economy growing more slowly than neighboring states.  If there is anything to learn from recent economic and revenue trends it is that taking less in revenue  does not, in itself, guarantee stronger growth and that more revenue doesn’t always stifle (although it could) economic growth.  I know business taxes in NH remain high, but that has been true for as long as almost anyone can remember.  It didn’t keep NH from growing faster than any other state in the region for most of 30 years so I doubt it is the singular reason why we are growing more slowly now.  That doesn’t mean it isn’t an issue that should be addressed, it just means that its not likely the only answer to NH’s problem of slower economic growth.  For all of us non-ideologues, I hope lawmakers look to broaden the range of issues in the policy debates over how best to strengthen NH’s economy.

Brother (or Sister) Can You Spare a Dime?

January 7, 2013

Tomorrow I will have the opportunity, along with several people a lot smarter than me,  to address the NH House Committee on Ways and Means to talk about some of the forces and factors affecting revenue growth at the state level.  I’ve forecasted (pretty accurately I think) the impacts of policy changes on state revenues for a number of clients and projects (here is one example I’ve written about in this blog).  Things like energy and gasoline prices that affect the disposable income  of NH residents and the willingness of out-of-state residents to travel to NH for recreation or shopping (energy prices can affect the price differential calculus for an out-of-stater coming to NH to purchase  goods or avoiding travel costs by purchasing higher-priced goods in their home states) are just a couple of examples that can make the difficult task of revenue estimation that much more difficult for NH lawmakers.  It’s a tough and thankless job and if I can help I am happy to.   It is especially difficult these days because the news on revenues is rarely good, as the chart below shows,  year-over-year quarterly state revenue growth ( from the state’s 8 largest “own source” revenues) has performed more poorly, for a longer period of time, than at any time over the past decade.

NH revenue growth

Some policy actions contributed to that (the decrease in the cigarette tax is an example – although that was only a small contributor to slower revenue growth) but the biggest reason is weak economic and job growth.

NH Job and Revenue Growth

Tomorrow I will present a number of charts and talk about a number of factors that influence various revenue sources but the bottom line is this:  until we have more than tepid employment growth, revenues aren’t going to grow significantly and forcing them to grow (via a major policy change) will not contribute to stronger job growth.  That isn’t the same thing as saying “any policy change (rate adjustment etc.) will harm job growth and revenue growth in the long run.”   NH’s unique fiscal system has survived far longer than many thought possible (and longer than many wanted it to survive) because of balance – those on the left of the political spectrum had to be satisfied with the state doing what it “needed to do”  rather than what it “wanted to do” and those on the right had to be willing to allow for some adjustments in tax rates and revenues to keep call for major policy changes at bay.  I think that worked pretty well for a long time but it only works when their is a modicum of flexibility and compromise in the policymaking process.    That, in fact, may be the best estimator of revenue growth moving forward and you don’t need an expert panel of wonks and nerds to tell you that.

Can We Be Different Like Everyone Else?

January 4, 2013

I was surprised to see the number of states that have allowed casino gambling.  In a prior post I focused on what I thought were the states that are perhaps most identified with casino gambling (Nevada, New Jersey, and Connecticut).  Twenty three (23) states and five since 2005 (if you count Massachusetts) now allow some type of casino gambling.  As the map below shows, the Northeast region of the country is the king of casinos.  I don’t know what that says about the Northeast but Vermont and New Hampshire are now the only states in the region that do not have some form of casino gambling. (a note about the data in the charts below:  I have taken reasonable steps in the limited time I allocate to this blog to provide accurate information – if anything appears inaccurate please let me know).

Note: Map is Updated thanks Curtis!

 Competitive Casino Map

I think whether or not to become more like other states in the region is an important and ongoing debate in New Hampshire, whether it be about our revenue structure, which stands out in the region, or our political, legislative, and regulatory structures which to a lesser degree do as well.  I’ve long argued that the state was able to buck the region’s unfavorable demographic and  economic trends because it was somewhat unique in the region.  Some who disagree with me on that argue that the state should, in the case of casino gambling, refuse to become more like the rest of the Northeast region.  While others who agree with me on the benefits of NH’s uniqueness are arguing that NH should have casino gambling because other states in the region are doing it.  Consistency isn’t what it used to be or perhaps I just confuse consistency with rigidity.  It is also possible that I am misreading the whole consistency and change aspect of the debate.  Could it be that gambling is consistent with NH’s fiscal traditions but inconsistent with its uniqueness in the region?  I don’t expect there will be a lot of testimony on that at any public hearings on casino proposals.  For those more interested in the pedestrian issue of how much state revenue we can expect, below is a chart that shows how much states currently take in from casinos (in very broad categories).  Interesting to see that Pennsylvania is now the champion in terms of state revenues from casinos.  That state is, in large part, responsible for the decline in revenues in New Jersey.  Things are definitely changing in NH and the upcoming debates over whether or not to allow casino gambling will, I think, tell us a lot about the direction of that change.

State Revenue from Casinos

If We Can Beat the Mayan Apocalypse Why Not the Fiscal Cliff?

December 21, 2012

If the Mayan apocalypse can be postponed (I am not sure exactly at which time it is supposed to occur so I may be speaking too soon here) then surely the U.S. Congress can agree to actions to avoid the fiscal cliff.  Lawmakers are poised to give us over $500 billion in tax increases and over $100 billion in spending cuts to begin the new year.  The fiscal cliff is a  pretty big lump of coal as a gift to begin 2013.

What is extraordinary about the cliff’s self-inflicted harm is that it appears  almost all sentient beings realize what needs to happen. More importantly, there also appears to be substantial agreement on most of the actions necessary to avoid the economic harm resulting from the fiscal cliff.   Spending clearly has to be cut  just as surely as revenues have to be raised.

deficit trends

With so much apparent agreement on actions needed to avoid the damage, it is hard to understand the calculus of lawmakers as the lack of an agreement begins to  demonstrably affect business and consumer confidence as well as financial  markets.  Congress always comes up with a temporary fix for the alternative minimum tax and can easily do so again.  Almost everyone wants the payroll tax cut to expire (for different reasons – Republicans because they don’t like the temporary nature and believe it has no incentive for work and saving and Democrats because of its impact on the Social Security trust fund).  There is little support for extending unemployment benefits.  It seems like neither party really wants the spending cuts (Republicans opposed to defense cuts and Democrats to non-defense cuts).   There is disagreement over the tax increase for high income individuals included in the Affordable Care Act and Medicare reimbursements for doctors but those are a miniscule portion of the cliff’s effects.   Beyond all the posturing,  the fight in congress is really  about whether to extend tax cut provisions to 98% or 100% of U.S. households.

cliff effects on growth

I know I am simplifying here.  Even with many agreed upon temporary  fixes,  longer-term solutions must be found.  But lawmakers could still salvage strong economic benefits by avoiding the worst of the cliff’s impacts in the short-term while resolving longer-term issues in the first-half of 2013.  Such a “grand bargain”  would both increase business and consumer confidence and set the nation on a more sustainable budgetary and debt path that would quickly overcome any of the short-term negative impacts  resulting from necessary spending cuts and revenue increases.