Posted tagged ‘job growth’

The Incredible Shrinking Labor Force

January 10, 2014

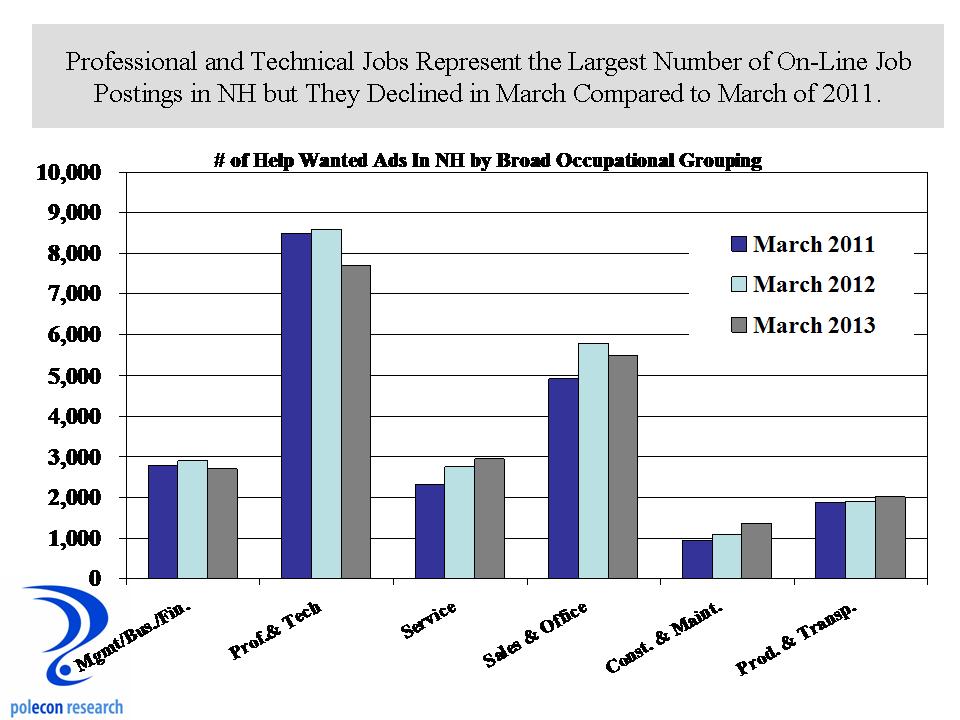
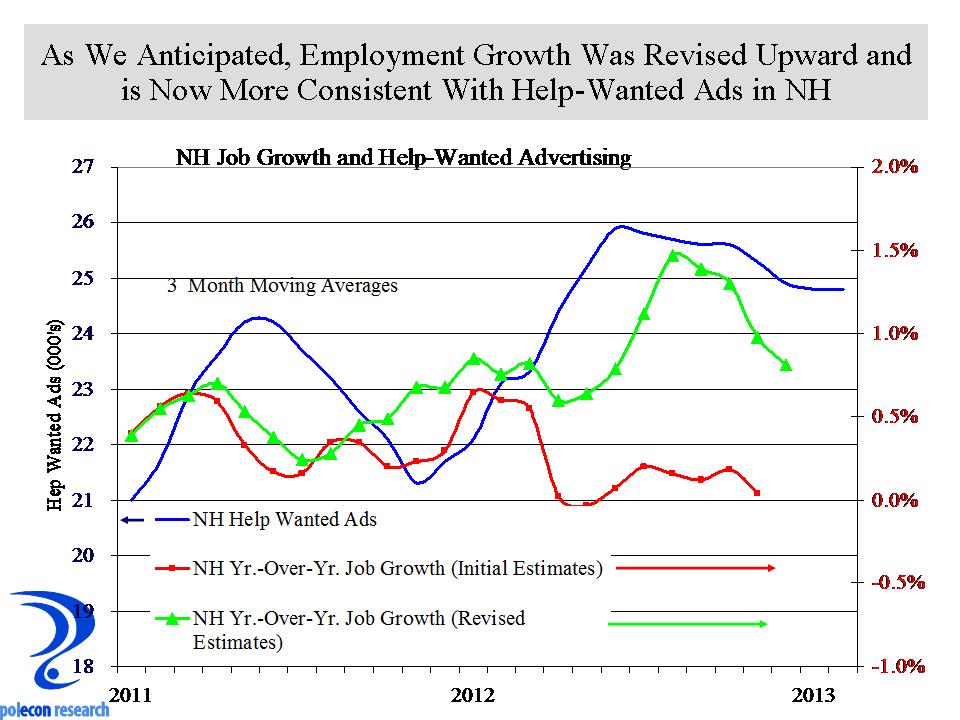
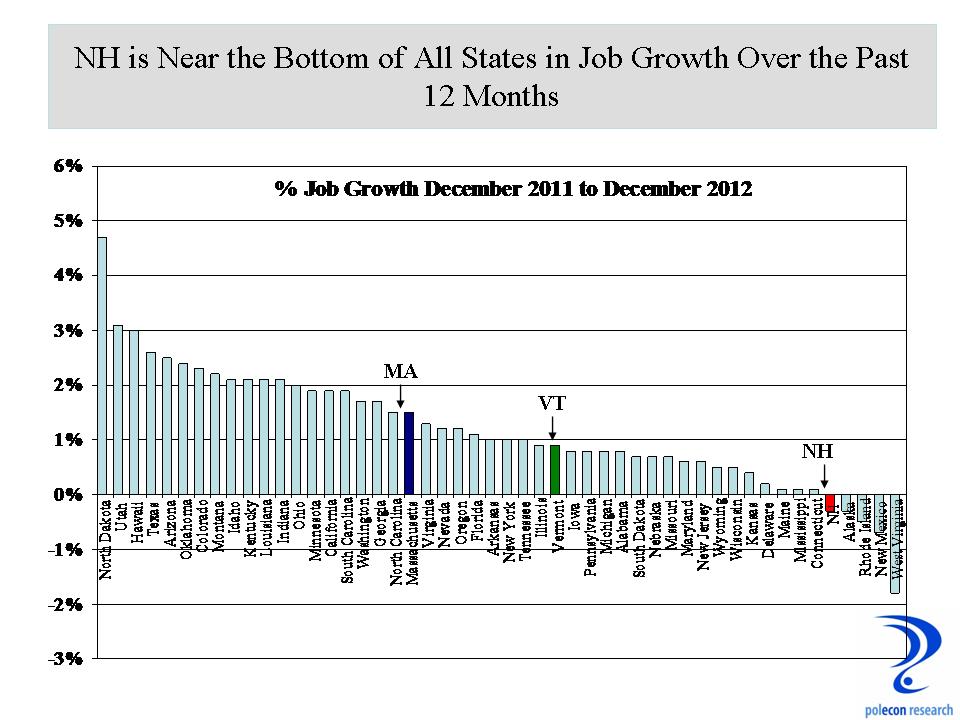
The employment growth report released today by the U.S. Bureau of Labor Statistics was disappointing for sure (74,000 job growth when 200,000 was the consensus estimate) but December employment numbers are more prone to seasonal adjustment errors because of the large amount of hiring that occurs prior to the holidays and this year presented even more issues because of the shortened time between Thanksgiving and Christmas (Thanksgiving was on the 28th, its latest possible date).  December’s employment growth may still be disappointing but my bet is that December’s numbers will be revised up in future months.  Help wanted ads have been increasing for the past six months and the labor supply/demand ratio has been falling.  Unless there is an even bigger “skills gap” than many think, that implies stronger job growth than was reported in December.

The best thing about the report was that it helps focus more attention on the nation’s incredible shrinking labor force, a problem that significantly lowers the potential economic growth of our nation’s economy.  Too many media reports on the nation’s and NH’s economy focus almost entirely on the unemployment rate.  That is especially true in New Hampshire where, because of our demographics (a lower percentage of harder to employ populations are in our state’s labor force), we always have a lower unemployment rate than the U.S.   No matter how weak job growth is in New Hampshire, many will cite our lower than the U.S. unemployment rate as a sign of economic strength.  Some reporters (hat tip to John Nolan of the Rochester Times) have avoided confusing job growth with the unemployment rate but too many in our state confuse the two.

The problem of smaller or slower growing labor force is an important and vexing one for New Hampshire and the entire U.S. A smaller or slower growing labor force implies slower economic growth because the output of the economy grows when more people are producing, when more capital (equipment and machinery) allows the same number of people to produce more, or when knowledge/technology/skill levels improve and allow greater productivity per worker. So unless productivity is increasing to compensate, a shrinking or slow growth labor force means slower economic growth.

There are several reasons a labor force can shrink or grow more slowly. Some related to economic conditions, some related to demographics, and some (such as the current situation) seem to have an unexplained element. Nationally, population trends have meant slower labor force growth as lower birth rates over the past few decades and as baby boomers reach ages where labor force participation starts to decline. NH benefited from strong population growth in the 70’s and especially 80’s and 90’s. That provided a strong boost to our economy, especially since much of that pop. growth was the result of in-migration from other states by skilled, well-educated individuals (a good characterization of our in-migrants from other states is a two wage earner, married couple family, probably both college educated with children). That migration added tremendous talent to our labor force and made NH an attractive location for many business looking to employ skilled workers.

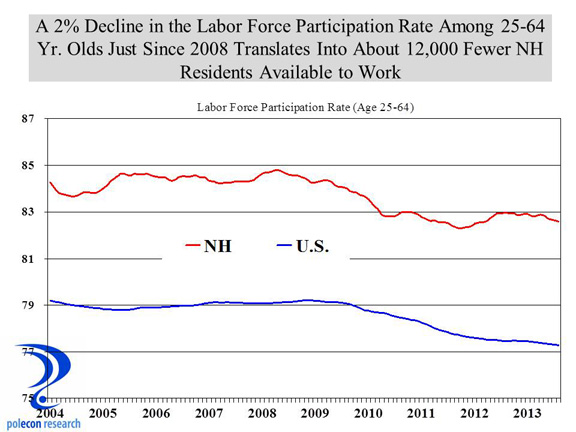
The labor force grows or shrinks by population growth in the working age population, or by changes in labor force participation (those of working age who choose to be in the labor market or not). NH and the U.S. have seen slower population growth in the working age pop., but more disturbingly, both have seen a decline in the labor force participation rate.  Yes NH still has a relatively higher participation rate but the trend decline is similar to the U.S.  The graph below shows the decline in participation among individuals aged 25-64 (to minimize schooling and retirement decisions as possible causes).

nh us labor force particpation 25-64

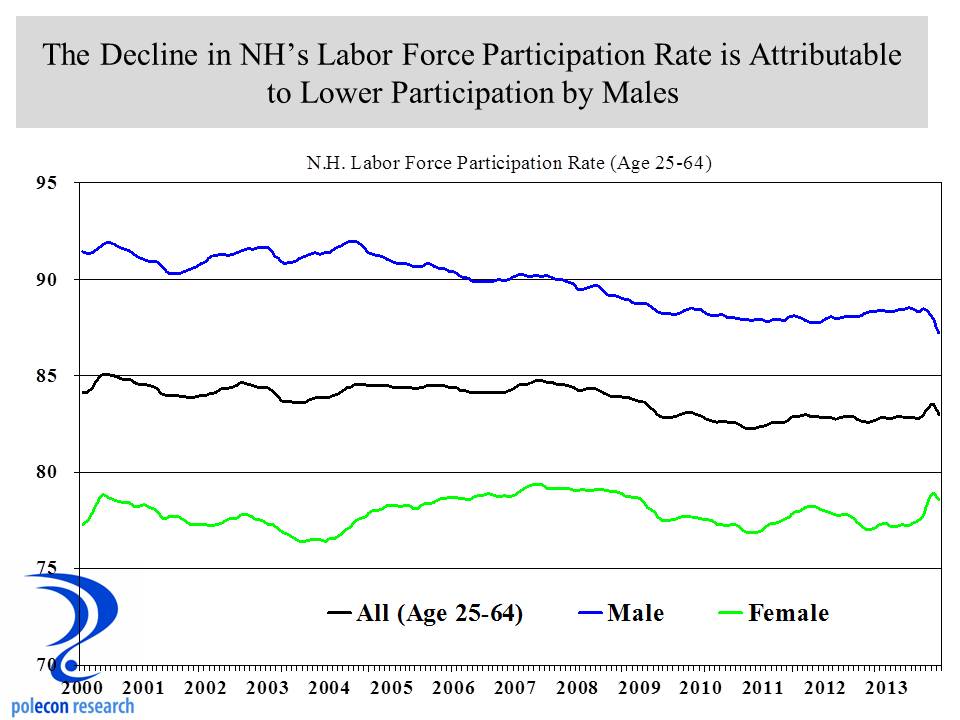
If your working age population isn’t growing, having high labor force participation rates is critical for economic growth.   NH has had very high participation rates compared to the U.S. because of our favorable demographics (few people who traditionally have lower levels of participation – minorities, those without a high school diploma etc., and because our population overall has higher levels of educational attainment that is associated with labor force participation).  Women in NH especially tend to have higher participation because of higher levels of education and lower fertility rates (child-bearing lowers labor force participation).  I have written many times on gender and employment (search on gender in this blog) and the “feminization of the workforce” is a theme (non-pejoratively as the father of daughters) I believe is continuing.   As the chart below shows, virtually all of the decline in the labor force participation rate in NH is a result of a reduction in the rate among males.

male female labor force participation

Labor force participation always drops during recessions as workers get discouraged and drop out.  What is especially troubling today is that labor force participation continues to be weaker even as the economy has improved. Some has to do with demographics as more of the working age population ages into groups with lower participation rates although participation among those with higher levels of educational attainment seems to have held-up best. The best explanation of why labor force participation has continued to be lower than in the past is that the skills required by the economy have been changing, making many workers less qualified than before and creating more discouraged workers. I think that is part of the issue but I don’t think the “skills gap” could have so abruptly hit the labor market to cause participation rates to fall so much over the last half-decade. The skills gap has been a more slowly growing phenomenon.  Among older men without a post-secondary degree, participation has been declining for decades.  The skills mismatch between the supply of labor among males and the demand has been ongoing for decades.  Did it peak so suddenly in the past decade to create a permanent decline in the male workforce?  I don’t think so, additional factors are contributing.  I remember in the 70’s when the first real oil crises hit (related to Middle East wars) and a lot of job losses resulted, especially in mill towns like the one I festered in as a youth.  Someone whom I thought was wrong about almost everything said to me at that time “a man should never be ashamed of any job he takes to feed his family.”   I didn’t think much about that back then, but today it seems especially appropriate, even as it appears to be increasingly a relic of an outdated ethic.  Economic conditions today aren’t the result of people not wanting to work and a labor market where many individuals are working at jobs that don’t fully utilize their skills is not desirable.  Changes in and the performance of the economy are  obviously largely responsible for declining labor force participation.   Still, with so many troubling indicators for males  – especially younger males (educational performance and attainment, household formations etc.)  emerging over the past decade or more , I can’t help wonder how much of the decline is the result of a lost ethic among my gender.

What Do Help Wanted Ads Say About the “Skills Gap”?

April 18, 2013

It has been quite a while since I wrote about some of my favorite topics, the “skills gap” and occupational supply and demand.  But since there are recent media reports about the issue and more and new or renewed groups in NH looking to influence the debates and discussions on the issue, let me once again add my $.02.

I’ve made the plea for empirical rather than anecdotal or ideological evidence on the issue and produced a little evidence myself that both points to a skills gap as a contributor to slower than desired employment growth as well as evidence that suggests the issue may not be as prominent an explanation for slower job growth as some believe.  I’ve also noted the larger economic policy debate that engulfs the skills gap issue.  The data I’ve presented in this blog only hints at  answers to the fundamental question of whether slower job growth is more of a problem of labor supply (the number and/or quality available workers with the education, skills and training desitred by employers), or one more of labor demand (not enough employers looking to hire qualified, educated and skilled workers in NH).  I think the charts below  again provide some clues to labor supply and demand trends in NH and also illustrate some bigger trends in the NH economy.

The first chart most directly addresses the skills gap issue.  It shows that in terms of broad occupational groupings, professional and technical job openings are the largest component of on-line help wanted advertisements in NH.  Because these tend to be among the most-skilled and highest-paying jobs we assume that if there were a sufficient supply of labor then job growth in the industries that most employee these occupations would be relatively strong.  In fact, one  industry grouping – business and professional services  – employs a lot of professional and technical occupations and it is growing almost twice as fast as is overall private sector employment in NH.

The crux of the skills gap issue is this: “would a larger or better qualified supply of individuals in these occupations result in faster job growth in NH, or are there other or complimentary factors that also need to contribute to faster growth?”   How you define the problem of slower job growth also largely defines the range of your solutions. Increasingly, and I think somewhat disappointingly,  it also seems to define your ideology (if you have one).

March 2013 HW

The chart  below is less sanguine.  It shows that compared to the same month in 2012, March 2013 help wanted ads in NH for professional and technical ads declined by more than 10 percent.  One month isn’t a trend but recent months have shown more weakness than strength in this indicator.  The chart also shows that the largest improvements in labor demand are not among the most skilled occupations, although changes in the occupational make-up of manufacturing industries makes it increasingly likely that production workers will  have higher levels of education, training and skills.

Pct Change in HW in March


What’s Behind the Weak Jobs Report?

April 5, 2013

Bad news arrived today with the release of the monthly employment report by the U.S. Bureau of Labor Statistics.  Only 88,000 non-farm jobs were added across the country in March. Following  two months which saw the U.S. add 148,000 and 268,000 jobs respectively in January and February, the low number raises concerns that the U.S. may again be heading for a “Summer slump” after showing signs of stronger job growth early in the year.

I share that concern but I am most interested in what the job growth numbers may or may not imply about recent U.S. economic and domestic policies.  I know sequestration is the hot policy topic and may be blamed or credited for all evil or good that occurs in the U.S, economy this year, but it is really too early for it to register much  impact on March’s job growth.  Two other policies have the potential to more significantly impact job growth in the near term.  The details of the March employment report provide some clues about if and how these policies may affect job growth in the future. The elimination of the temporary reduction in the payroll tax and health care coverage mandates in the Affordable Care Act are policy impacts that we worried about before we started worrying more about the potential impacts of sequestration.

I last posted that gains in home values, stocks and, retirement accounts along with increases in wages and salaries would help the economy overcome the large potential impact on consumer spending from the rise in the payroll tax (elimination of the temporary rate reduction) that took effect in January.  I may have been a little too optimistic about those factors ability to help the U.S. economy overcome more than $100 billion in lost consumer spending power (over $600 million in New Hampshire).   For me, the most troubling piece of data from the March job growth report was the seasonally adjusted decline of 24 thousand retail trade workers and generally downward trend since January, that has followed several months of solid gains in late 2012 (chart below).

U.S. Retail emplyoyment

When housing values are recovering, homeowner’s equity is rising, and employment and wages are growing, retail employment should not decline.  The elimination of the payroll tax cut (along with higher gasoline prices early in the year) likely provided a greater shock to consumers than anticipated.  But another explanation is that implementation of the health care mandates of the ACA could be affecting employment more in some industries.  If so, it would likely impact industries that typically are less likely to offer their employees health care coverage and industries that employ more part-time workers.  Retail and leisure and hospitality industries  meet those criteria but only retail trade lost employment in March.  Because the ACA mandates coverage for full-time employees, one way to avoid the mandate would be to increase part-time employment.  In that case I would expect the average weekly hours of workers in retail or other industries that may be more  affected by the mandate to decline, as more workers were shifted to part-time status but average hours have increased slightly in retail over the past three months.  Looking more closely at the data on part-time employment is needed to get a handle on any ACA impacts.  Over the next few months I will be looking for evidence of  increases in the number of workers working “part-time for economic reasons” – meaning they are working part-time when they want to be working full-time, as well as employment trends in businesses employing between 50 and 499 workers (those most affected by ACA).  Trends in these employment data would provide stronger evidence of any ACA effects but for now, it looks like the payroll tax is the culprit in the retail employment data.

Small Business is Not Booming

March 12, 2013

The National Federation of Independent Businesses just released its monthly report on the condition of  small businesses nationally.  The report is based on a national survey and state-level results are not available.  However you feel about NFIB or their advocacy positions their monthly report is a valuable source of  information about the issues and factors affecting small businesses.

Robust economic growth does not occur unless small businesses are confident, healthy, and hiring.  That seems especially true in NH and is one reason NH’s job growth has been slower than the national average.  I especially pay attention to the headline portion of the NFIB’s monthly survey,  it’s “Small Business Optimism Index”,  because it seems to be a pretty good indicator of near-term job growth in the U.S. and NH.  The simple correlation between the NFIB Small Business Optimism Index (lagged 3 months because it takes some time for optimism/confidence to affect hiring plans) and U.S. Job Growth  is about .68, while the correlation between the NFIB Index and NH employment growth is about .74.   Thus the relationship is slightly stronger between the Index and job growth in NH than it is for the U.S. as a whole.  The NFIB Index inched-up in February, but overall it remains relatively low, suggesting that small businesses aren’t yet ready to provide the boost to hiring that typically occurs in a strong recovery from recession.

NFIB Index and Job Growth


A more troubling indicator of the health of small businesses (and thus hiring plans) comes from the Experian/Moody’s Analytics Small Business Credit Index.  This quarterly assessment of the financial health of small businesses suggests the balance sheets of small businesses (in the aggregate) deteriorated in the fourth quarter of 2012.   According to the quarterly report:

“Delinquent balances rose, pushing the share of delinquent dollars higher to 9.7 percent from the prior quarter’s 9.4 percent. A slowdown in personal income growth led to sluggish retail sales, hurting small-business revenues. Though small firms have worked to trim their labor costs in recent months, sales have fallen more quickly, forcing many small companies to borrow funds to cover their payroll expenses…..The next six to nine months likely will be lean ones for small businesses as rising taxes strain household budgets  and nervous firms of all sizes postpone hiring, thereby stunting the jobs recovery. Consumer sentiment is likely to remain subdued, and spending will be underwhelming, which will keep pressure on small-business balance sheets.”

Experian Moodys  Credit Conditions


Even A Broken Clock is Accurate Twice a Day

March 8, 2013

I am frequently in error but rarely in doubt, so when I am right I have to make sure someone notices.  Good news was reported today  on job growth nationally, as an estimated 236,000 jobs were added across the country in February.   I hate to sound jaded but in each of the prior two years job growth looked to be accelerating early in the year only to experience a significant mid-year  slump.  For now, however,  it is a positive sign.  I have been especially and uncharacteristically gloomy in my characterization of NH’s economy but there was some little reported good news on that front released last week.  The annual benchmark employment revisions showed that NH has 9,600 more jobs than originally estimated.  I won’t get into why the revisions are necessary and can result in some significant changes in the numbers  but in my very first post in this blog back in October I highlighted the disconnect between the volume of  help-wanted advertising in NH and estimates of job growth in the state.

“In the first ever Trend Lines blog post I begin by asking a basic question:  Could the most recent job growth picture in NH be distorted by numbers that will later be revised?”

I also suggested that growth trends in reported wages and salaries  in the state were also inconsistent with estimated job growth trends. In that post and in subsequent  posts (here and here) and others as well, I talked about a potential “skills gap” as a contributor to the disconnect between help-wanted ads and NH’s reported job growth.  I think a “skills gap” is a contributing factor  but as I argued in my first and subsequent  posts –  my money is on job growth being revised upward.  It is nice to be right but it really doesn’t change the overall theme of NH’s economy- that it continues to under perform relative to states it typically outperforms.  That was also predictable:

“…that the jobs data is wrong and will be revised upward early next year, is real,  but that doesn’t mean the revisions will show NH is again outperforming its neighbors or the nation.  It just means we will look less bad over the past year or so than we do right now.”

Five months later I think that still  sums-up my feelings about the revisions, its good to know we have more jobs but we are still in a growth mode that is too slow.  With the revised job numbers for NH the relationship between help-wanted advertising and reported job growth looks more appropriate.

NH Revised Emp

The revised job numbers also are more consistent with PolEcon’s NH Leading Index which had been signalling stronger employment growth in NH than was first reported.  The revised job numbers are more consistent with the signals provided by the Leading Index.   That may not mean much to anyone but to me it means I won’t have to spend a lot of time re-calibrating the Index and that means a more enjoyable weekend.  Enjoy yours.

Leading index and revised emp

Educational Attainment, Economic Prosperity and Fiscal Reality

March 4, 2013

I write and speak a lot about the importance of demographics to community and regional prosperity.  Over the past several years I have written and spoken about my belief that communities wanting to increase the number and quality of employment opportunities available in their town increasingly need to recognize the importance of being an attractive place for skilled individuals with higher levels of educational attainment.  Employers in emerging and growing industries  locate in areas where the pool of talent (skilled, well-educated individuals) is “deep” or growing.   A community can still see employment growth even if it doesn’t have a lot of skilled, well-educated individuals if it is located in a region that does have enough of them but the impact on and benefits to the community will be very different.

It is hard to empirically test the importance of skill levels and educational attainment to job growth in individual communities but anyone involved with the location and expansion decisions of employers knows how important the availability of a skilled and educated labor force is.  Because the occupational needs of employers in different industries varies greatly, I, and others, often use the percentage of the population age 25+ with at least a bachelor’s degree as a surrogate for trends in the education and skill-level of the workforce in a community or region. It’s a good way to labelled an elitist, at least by those who don’t know anything about you.  I don’t think only college graduates can get good jobs but it is clear to me that trends in the educational attainment of the population of cities and towns is a pretty good indicator of how the economic fortunes of a community are changing. I’ve tested the relationship statistically and found that there is a  relationship between the change in the percentage of individuals age 25+ with at least a BA degree in a community and employment growth over the past decade.  There are a lot of factors that influence employment growth but over past decade communities that have had larger increases in the percentage of individuals with high levels of educational attainment generally have had better job growth (or at least less negative growth).  The relationship narrowly missed statistical significance when tested on NH’s 40 most populated communities.  Since the recession in the early 2000’s, there has been virtually no private sector job growth in NH (primarily because the last “‘great recession” wiped-out gains from the middle of the decade).  The chart below crudely divides NH’s larger communities into quartiles according to the change between 2000 and 2010 in the percentage of their population age 25+ that has at least a BA degree and the mean change in private sector employment between 2003 and 2011.  One caveat, the figures for 2010 used to calculate this is based on the three-year average of American Community Survey values and smaller communities have larger margins of error in the survey results.  It is just one of the challenges in documenting the relationship between demographics and economic performance at the community level.  Nevertheless, I think  the data point to a relationship were towns that are seeing increasing levels of educational attainment among their population are performing better economically than than those that are seeing less of an increase.

job growth and ed attainment change

It also says a lot about how the character of a community might be changing.  I live in city that has seen a significant increase in the percentage of its population with a BA degree or higher over the past two decades.  That change has contributed to changing expectations of the community (the type of services and amenities it offers).  That type of change creates a clash between the old and new that has and continues to characterize many communities.  In many ways I believe local tax cap debates are more about demographic and socioeconomic changes than they are about economics and fiscal policies.  But I digress.

Skilled individuals with higher levels of educational attainment have the most economic opportunities and they are the most mobile.  I think keeping and attracting skilled individuals with higher levels of educational attainment is an increasingly important economic development strategy for communities.  Looking at changes in educational attainment between 2000 and 2010 among NH’s largest communities shows some interesting patterns.  Not surprisingly, some of the communities that have done the most to restrain expenditures have seen the smallest increases in educational attainment levels (some towns like Durham had such high levels – 77%  – they have no way to increase much).

ed attainment change by town

Spending liberally is never a good thing but providing the services and amenities desired by skilled and educated individuals and families at a price (in terms of local taxes) lower than other communities is a good way to accumulate the talented workforce that can increase real prosperity in a community.  Just adding skilled and educated individuals isn’t enough for employment growth, particularly if a community doesn’t want to be a center of employment or is otherwise inhospitable to employment growth.   I don’t think a low tax price alone is enough to attract talent and I don’t think providing amenities and services without regard to price is enough either, but too often never the twain shall meet in striking a balance between prices and  services and amenities and longer-term community development objectives.  I don’t know many local budgets that can’t be cut but unfortunately the cuts usually come at the expense of those services and amenities most likely to help a community attract or retain individuals with the most economic opportunities and choices of where to locate.  When I say or write these things I risk being labeled a big spender or liberal.  In reality I am just documenting trends that seem pretty clear to me.  Nevertheless, my advice to others is never bring data to an ideological fight if you want to escape unscathed.  In an age of austerity, spending decisions need to consider both the current  fiscal reality as well as the longer-term implications for the economic prospects  of  a community.

Where Never is Heard a Discouraging Word

February 27, 2013

Without an accurate assessment of where you are you can’t chart a course to get to where you want to be.   In the context of efforts to strengthen regional and state economies, however,  plotting your coordinates seems especially difficult.   For decades New Hampshire (including me) has become accustomed to hearing that its economy is “doing better than most other states”  and that we can expect to grow faster than a majority of states and all other states in the Northeast.  I have blogged here several times about how that is not currently the case but because about five people read this blog there isn’t much fallout.  But  when someone like me suggests, in a public forum,  that NH is lagging and that superior growth is not currently the case for the state, you can expect some incredulity and push back.

State 12 Month Job Growth

When you speak in a community and present lots of data that suggests it is lagging even more, then you can expect the push back to more likely come with a closed fist.  And when that community is close to where you live, well  it’s probably best to get an unlisted phone number.  I’m no prophet but if I were I  think it would  probably be impossible to be one in your own land.  I like to be the bearer of good news but when the data doesn’t suggest good news is warranted I don’t change the data or the news about it that I bring.  Long ago I learned that being right too early will feel a lot like being wrong.  I don’t know who was more offended by my presentation yesterday at a local chamber of commerce, people who feel I know nothing about their community, the people who think I know nothing about New Hampshire, the people who think I don’t understand the U.S. economy, or the people who think I know nothing about any of these.   An informal tally to-date suggests about an even split.

I am not a twitter user or follower, I am only marginally able to follow my own thoughts and activities throughout the day, but if I were and if I were able to expand the size of a tweet, this is how it would summarize my remarks at the chamber forum:

Economic growth is increasingly associated with concentrations of skilled, well-educated individuals and any state’s, region’s, or community’s longer-term prosperity is likely to be correlated with its ability to attract and retain these individuals.  The ability to keep and attract this demographic is as much a requisite for job growth as it is a result so any region’s development strategy should attend to its capacity to appeal to this  demographic and look to leverage the associated economic benefits .  Understanding the direction of these trends in your community or region, likely tells a lot about recent and future economic performance.

If you happen to discover oil or shale gas under your state or community that tweet applies a lot less.  In addition, small communities can see strong growth from just one or two businesses, but with some exceptions and over the longer-term,  I think the summary holds true.   I am a first generation college graduate and my beginning, and likely my ending, doesn’t warrant even a whiff of elitism of any sort.  But making an association between educational attainment and economic growth apparently implies a disparaging of those who are not college graduates, just as the notion that NH’s economy is growing more slowly than some of the states that we are accustomed to regularly outperforming apparently implies an indictment of “the NH way” compared to to other states.

One or two years of weaker economic growth is not a signal of apocalypse, but its not a bad idea to wonder if it is and to consider ways to avoid it.   For me, the apocalyptic story  for NH would be that, over the longer-term, we become a slow employment growth state that is also a higher cost-of-living state.

State Cost of Living

High costs and slow employment growth have characterized too many states in the Northeast as well as California and they have all suffered as a result.  But at least in California you still have nice weather.

Striking an Economic Strategy With Maslow’s Hammer

January 22, 2013

The great psychologist Abraham Maslow is famously quoted as saying:  “When the only tool you have is a hammer you tend to see every problem as a nail.”   Maslow gave us all too much credit. When we (NH) have a hammer and know how great it is, we not only treat everything as a nail, we actually perceive everything to be a nail.  We (me included) develop a blindness to “non-nail” problems and creative problem solving takes a back seat to picking up that hammer and smashing the problem.

NH’s relatively low state and local tax burden, especially compared to other states in the Northeast, has and should continue to provide the state’s economy with significant competitive economic advantages.  In an era where “talent” – skilled, well-educated individuals are the resource businesses are most in need of, our state’s fiscal structure has been a magnet for higher-skill, more highly-educated and more mobile individuals and families.  So why does it currently not appear to be offering a competitive advantage (based on job growth and population migration data)?   The question is whether our fiscal system will be enough of an advantage in today’s economy to assure the kind of growth and prosperity the state became accustomed to over much of the past several decades.  Based on the screams of joy I heard last week, the answer for many in NH is a resounding yes.  The news that Massachusetts’ Governor Patrick is proposing to raise income tax rates in that state has been greeted by many in New Hampshire as if the cloud that is NH’s slow job growth is about to be lifted.  Once those new Massachusetts tax rates are enacted NH’s schools and students will perform better, our electricity prices will drop, our young people will choose to enroll in the  newly affordable colleges in NH,  and our communities will be safer, cleaner and offer more and better services at ever lower prices.  For too many in our state,  the future of  NH’s economy is largely determined not by what we do as a state, but by the mistakes that other states make.  I’m no Doc Rivers or Bill Belichick but I don’t think their game plan is ever solely predicated on the other team’s mistakes.   Great states, like great teams, can succeed even when the other “team”  is playing their best.

The monthly state job growth numbers for December, released late last week, continue a disappointing trend that should have NH businesses, policymakers, and citizens asking whether Maslow’s hammer is the only tool to use in shaping an economic strategy for NH’s future.

Annualized Emp. Growth

In the case of economic policy in NH, the “nail” is the high taxes which we have been pounding with our hammer for decades.  For the most part,  NH has successfully pounded that nail well below the surface.  As the chart below shows, state and local taxes as a percentage of personal income in NH are well below the U.S. and neighboring state averages.  Occasionally the nail it pops-up but is usually driven down.  Note that while it did rise for a time during the recession, this was a result of a slow and declining income growth rather than a rise in taxes.

State and Local Tax Burden

The problem is that our love of the “hammer’  as our primary economic tool appears to result in us using a longer and longer nail set in an effort to achieve the same levels of economic success as we have in the past.   Governor Patrick’s proposal to raise Massachusetts’ tax rates may benefit NH, I hope it does, but if it increases the use of our hammer, to the exclusion of other tools,  the benefits may be illusory.  A low tax burden is a great asset but the skilled, well-educated, individuals that drive economic success for the most part (it is certainly not unanimous)  also want the amenities and services that people free from want generally like to enjoy – things like good schools, civic, cultural, social, natural  and recreational amenities.  People want to pay as little as possible for these amenities for sure (and in many cases they expect them for free), but they want them nevertheless.  I think NH’s advantage is really been about providing ‘value” as much as it is about providing just a low tax burden.  As long as we can provide the services and amenities that people want, at a tax price lower than other places, we should be a magnet for the kind of individuals that will help our state thrive.

Our state’s hammer is and will continue to be a great tool, but not for every job, and not if it is used indiscriminately.  Every increase in a tax or raising of a fee isn’t an end to the “NH advantage.”  It wasn’t during the 1980’s or 1990’s when the state was growing remarkably even as taxes and fees with tinkered with (and even one or two major changes) by both Republican and Democratic administrations.  The key is knowing the true economic consequences of changes to different fiscal policies, which ones really hurt or help the economy and which ones have little impact  and by how much.

I like NH’s hammer and I have argued how it has been a great tool in helping us build a house that withstood the ill winds that blew through the Northeast region for decades.  I hope NH’s basic fiscal structure doesn’t change.  But we have become so comfortable wielding our hammer that in our casual over-reliance on it we may just be pounding on the thumbs of those who would live in the nice house with which it was built.

The Sun Will Come Out Tommorow

January 3, 2013

I have been uncharacteristically and uncomfortably gloomy in my assessment of the NH economy lately, but I still hold out hope that New Hampshire’s job growth numbers for 2012 will be revised upward early in 2013 based on the volume of help-wanted advertising in the state and reported growth in aggregate wage and salary income in the state.  Even if that doesn’t happen there are encouraging signs that job growth will accelerate.   PolEcon’s NH Leading Index increased this month to a value of 13.0, down slightly from 16.7 the prior month, but it has registered its highest three-month reading since early in 2010.    At least some uncertainty around the  “fiscal cliff” that caused many firms to postpone hiring has been removed.   The U.S. Treasury debt ceiling still needs to be raised this month and a repeat of the last debt ceiling antics could produce another big drop in business and financial market confidence, but overall, the national and NH economies appear poised to see accelerating job growth as 2013 progresses.

Polecon NH  Leading Index

PolEcon’s NH Index of Leading Indicators is a diffusion index consisting of nine state and national indicators of economic activity designed to predict changes in the rate of employment growth in NH.  When index scores are above zero, more of the leading indicators are moving in a positive direction and the NH economy is expanding. The Index has a strong statistical relationship with changes in NH employment, Index scores lead changes in the rate of NH employment growth by 3-6 months.  Using statistical techniques, Index scores can also be converted into a probability that NH will be in  a recession sometime within the subsequent six months.

Leadin Index Components

The Most Important Ideological Debate of 2013

January 2, 2013

It is hard to fix a problem that you don’t  know you have.  That seems to be the case in NH where I still hear “NH has fared better than most states since the recession.”  I disagree and the U.S. Bureau of Labor Statistics is on my side.   Just before Christmas the Bureau of Labor Statistics issued its  monthly report on November employment and unemployment in  the 50 states.  Once again the news was not good for New Hampshire.  Most media reports chose to report that NH’s unemployment rate dropped slightly during the month without noting that the number of jobs located in the state declined in November (John Nolan of the Foster’s Daily Democrat and Rochester Times was a notable exception).

Nov 2011 to Nov 2012 Job Growth

Compared to employment in November 0f 2011,  November 2012 employment in NH was lower by1,700 on a seasonally adjusted basis and lower by 2,500 on a not seasonally adjusted basis.  Only five states have fewer jobs located in their state in November of 2012 than they had in November of 2011.  As I have suggested before, NH’s job growth goes a long way toward explaining why the state’s housing market isn’t seeing the same recovery in prices that appears to be occurring in many other states.

50 state Job Growth Nov 11 to Nov 12

I am hoping that in 2013 policymakers focus much of their debates (ideological or otherwise) on policies that strengthen the NH economy.  I hope that most of those debates encourage the introduction of solid empirical evidence in support or opposition to any proposals (I tried last year but could not find any data or methodology to determine the impact that allowing pistol duels in the statehouse would have on job growth) and are absent the vitriol and ad hominems that characterized so many debates last year.  Policies that can influence job growth can easily accommodate the needs of the two-party system to make the  sort of ideological arguments and distinctions that they feel are needed to influence elections.

Whether job growth is slower now than in the past because employers are not willing to add additional workers (supply side arguments) or because they are not able to find enough or enough qualified workers  (the human capital and “skills gap” argument) is among the most important issues to understand in setting both national and state-level economic policies.  If employers are unwilling to add employees that are readily available,  then the efforts to spur job growth focus more on factors affecting businesses (tax rates, regulations, costs etc.).  If job growth is constrained because employers are unable to find enough or enough qualified workers to fill open positions, then the focus of efforts to spur job growth will be more effective if they look to influence demographic trends, increase the skills of the labor force, and/or better match the skills of workers  to the needs of employers.  In reality this is not an either or question because inadequate attention to the needs of either employers or the workforce will produce sub-optimal economic growth. I’ve tried in this blog to introduce some evidence related to the human capital argument for job growth trends and I will bring some supply side evidence in the future as well.
Ideological or not, respectful and civil or not, recent trends in NH’s job growth and the implications for future growth have to be the first and most important policy debate of 2013.


%d bloggers like this: