The Business Tax Discussion NH Should Have

Posted June 23, 2015 by Brian Gottlob
Categories: corporations, job growth, Labor Force, New Hampshire, NH, Tax Revenue

Tags: , , ,

What to do about New Hampshire’s business taxes is near the top of lawmaker’s agenda in the Granite State. Many policymakers are concerned that the business tax climate is contributing to a fundamental erosion of New Hampshire’s business climate that is reflected in lackluster employment and revenue growth. Reports that NH has recently outperformed  New England and the U.S. in gross state product (GSP) growth highlight the disconnect that can occur between economic metrics of output (GSP) and measures that more directly affect individuals in their daily lives, such as employment and wage growth. Better than regional or national average growth in GSP is good but state-level GSP numbers are relatively imprecise and should not obscure the fact that employment, wages, and state revenue growth have all been disappointing in NH by the standards of the past few decades. Sustained, disappointing employment and revenue growth since the end of the recession have prompted well-meaning lawmakers in NH to consider a number of policies to accelerate growth in the state.

NH and US emp Growth

Business Taxes Seen as Key

Business tax rates impact business decisions but I don’t believe they are the fundamental factor behind NH’s disappointing economic performance. Lawmakers should consider “what to do about business taxes” but that consideration should go well beyond current tax rates and regulations. Lawmakers should also be concerned with the long-term prospects (revenue yield) of business taxes because business taxes are the largest source of general revenue supporting state government.  New Hampshire’s fiscal structure is fundamentally tied to the performance of the state’s business taxes.  As importantly, lawmakers should be concerned with how NH’s business taxes will interact with key economic and demographic trends to influence the state’s future economic performance. The chart below shows combined quarterly business profits and business enterprise tax collections on an annualized basis and illustrates that nearly six years post-recession and more than seven past their high mark, business tax revenues in NH have not fully recovered. Some of the failure of revenues to rebound following the recession is a result of changes in the state’s business tax rules and some is the result of total private sector wages and salaries (the largest portion of the BET tax base) that declined in  2009 and 2010. Whatever the reason it highlights concerns about the viability of business taxes as the primary source of support for state government. I don’t believe that either raising or lowering rates is likely to improve the performance of business tax revenue enough to alleviate those concerns or even result in revenue gains that match those seen in the first half of the 2000s.

NH Business Tax Revenue

The Business Tax Burden in NH

Using tax rates to measure burdens over time is not a true measure of the impact that business taxes have on companies. Comparing state business tax climates using rates is problematic because of the various provisions of each state’s tax code that affect nominal rates. Here I assess business tax “burdens” using an economic measure – business tax collections as a percentage of private sector gross state product (GSP). This metric documents the state’s business tax burden placed on the total value of private sector goods and services produced in a state. Even using this measure of “burden” is problematic because it does not include all of the taxes, fees, and charges that may apply to a business in each state. Nevertheless, when it comes to addressing the primary sources of tax burden and the ‘headline taxes” that are identified with a state’s business climate, it is a better measure than looking at just business tax rates.

As the chart below shows, as a percentage of GSP, business tax burdens have nearly doubled in New Hampshire since the early 1990’s. Much of that is the result of the addition of the Business Enterprise Tax in 1993, as well as increases in the BET’s rate from 0.25% to 0.50% in 1999, to 0.75% in 2001. But some is also the result of increases in the rate of the business profits tax (BPT) which began the time period shown at 8.0% (from FY 92 through FY 93), dropped to 7.5% in FY 94 and hit a low of 7.0% (from FY 95 through FY 99) and finally rose to its current rate of 8.5% in FY 02. Importantly, the chart also shows that business tax revenue as a percentage of private sector gross state product has fallen since the recession and is now at a level seen at the beginning of the last decade. Again, changes in rules and a decline in wages and salaries both play a role in that decline. For comparison purposes the chart also shows the percentage of GSP that corporate income taxes take in Massachusetts, however, as noted, a number of other taxes are applied to or affect business in addition to corporate income taxes.

Taxes as a pct of GSP

What’s Ailing the NH Economy?

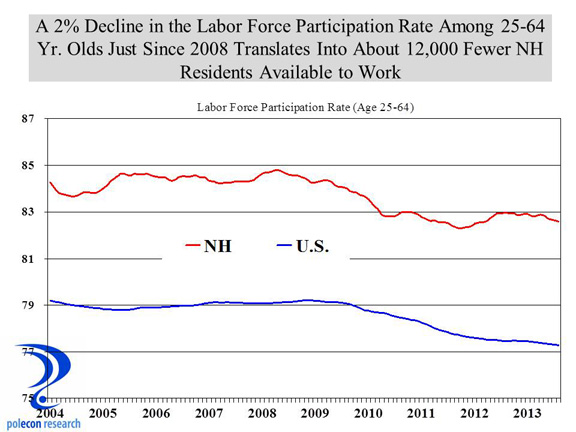
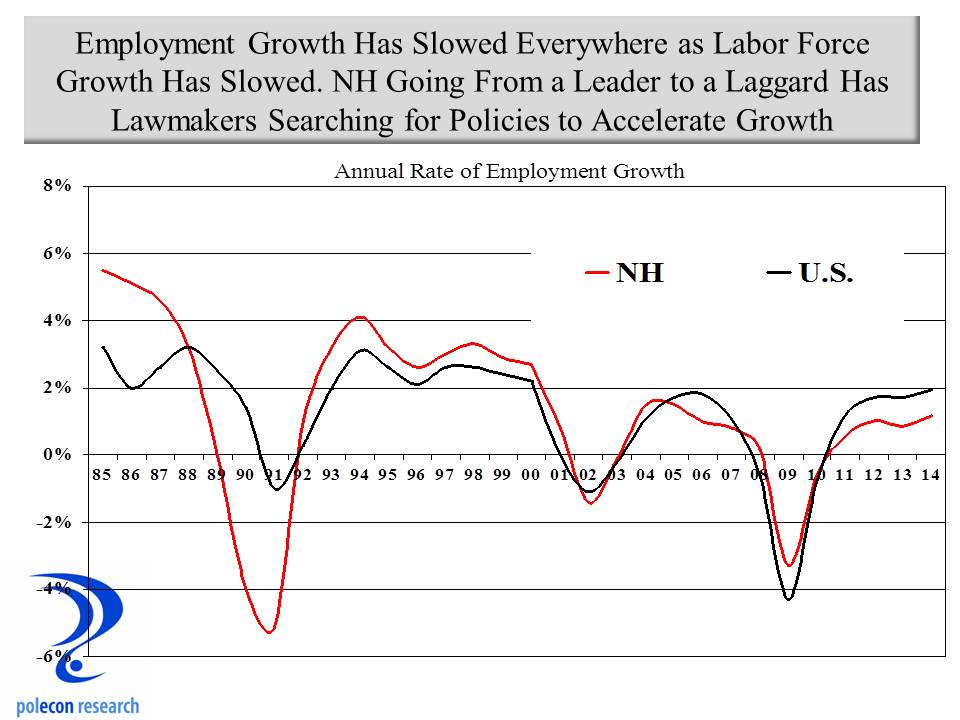
I don’t believe there has been a substantial, fundamental erosion of the ‘business climate” in NH. Slow labor force growth is by far the largest factor contributing to New Hampshire having gone from a leader to a laggard in job growth. That labor force issue is much broader and more complicated than the simplistic and too often noted “young people moving out-of-state.” The chart below shows that labor force growth has slowed more in NH than nationally in recent decades. Where once NH enjoyed a significant advantage in labor force growth, the state now lags the nation as a whole. Above average labor force growth is what allowed NH to have exceptional job growth in the 1980’s and much of the 1990’s.

lf growth 3 time periods

Labor force growth (largely via in-migration of skilled, educated individuals and families from other states) provided NH with a resource advantage for decades. Slow labor force growth is now capping the amount job growth that is possible in the state. Some believe the state’s labor force would experience stronger growth if more job opportunities existed in NH and that simply reducing business taxes will make that happen. While that is true to a degree, today, businesses rarely locate where there is not clearly a sufficient supply of needed labor. A sharp rise in help-wanted advertising in NH in recent years even as private sector employment growth has remained relatively constant and disappointing (chart below) shows that in the near-term at least, demand for labor does not necessarily increase its supply.  Significantly, the chart also shows that after a rapid rise in help wanted advertisements that was not accompanied by a noticeable increase in the rate of private sector job growth, help wanted ads have begun to decline in what may be a sign that employers, because of labor supply constraints, are increasingly looking  elsewhere for labor.

help wanted june 2015

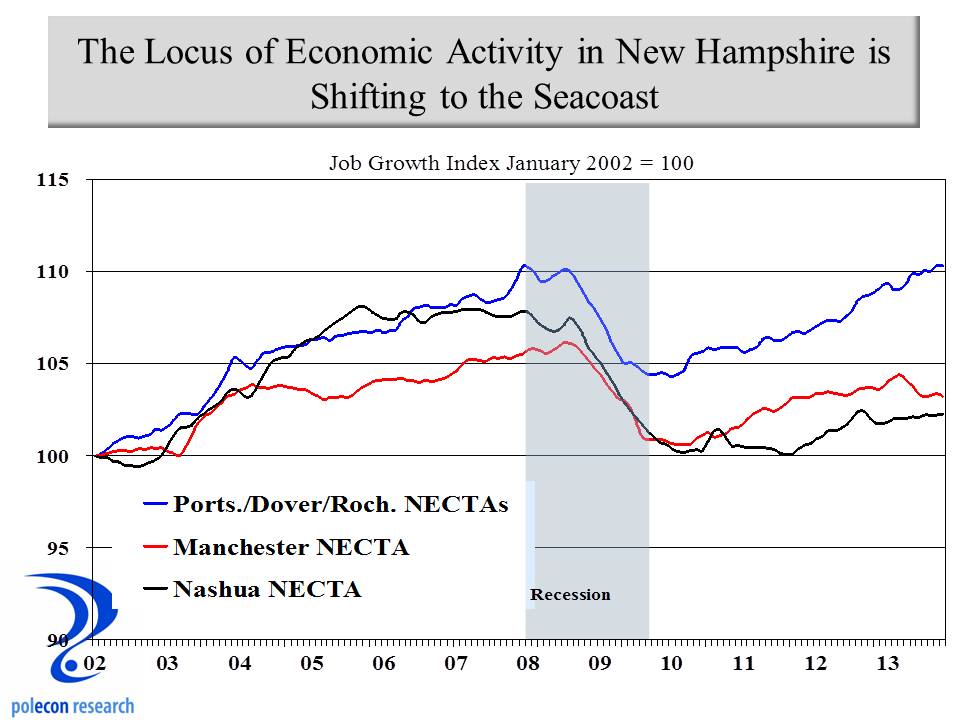
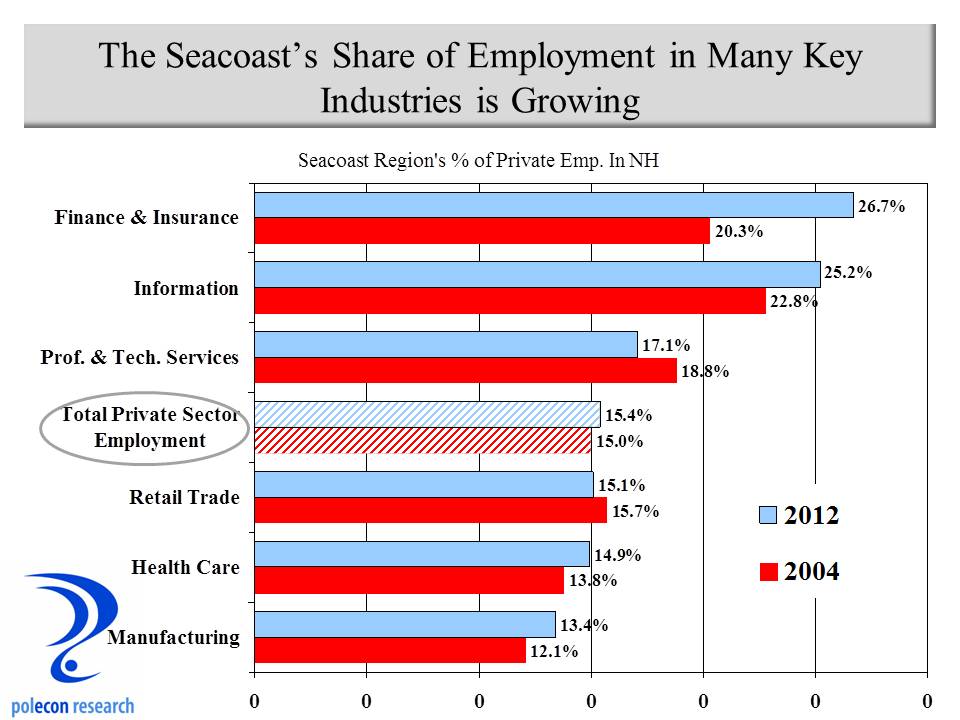
The demand for labor does generally increase the supply of labor but when the supply is growing slowly everywhere (especially in the Northeast where NH has typically attracted much of its increase in labor force), supply will respond accordingly. Increasingly businesses follow labor rather than the other way around and they do not rely on their demand to increase labor supply.  Looking ahead, population and demographic projections show that both nationally and in NH, the working age population (defined here as age 18-64) will show almost no growth over the next 25 years. Competition for labor among businesses will become more intense and to keep and attract a labor force businesses will have to offer more than just the promise of a paycheck. I would argue that states and communities will also have to offer more (in terms of amenities – natural, social, civic, cultural, and services) to attract and retain the labor force needed for employment and economic growth. Evidence of the importance of amenities to labor supply (and employment growth) can be seen in the differential employment growth between some of NH’s regions such as the Seacoast (which has had higher population, labor force, and employment growth and which has several high amenity communities) and other regions of the state.

New Hampshire can improve its business taxes and business climate but whatever reforms are enacted, alone, are not going to overcome demographic and labor force imposed constraints on employment growth in the state. Lawmakers should, however, seek to assure that business taxes do not worsen key constraints on the NH economy moving forward.

The Longer-Term Problem

NH’s combination of a traditional tax on the profits of business profits (the business profits tax or BPT), along with its “business enterprise tax” or BET (on the combined compensation, interest, and dividends paid by businesses) may well exacerbate some of the disadvantages the state’s economy will face as a result of national and state demographic trends, making it more difficult for NH to overcome key constraints on employment growth in the state.

Reducing business tax rates that many see as too high is a near-term solution to a longer-term problem. The longer-term problem is slow or no labor force growth nationally and in NH in the coming decades that will limit profit growth everywhere but which will also place additional burdens on NH businesses. The labor force problem and NH’s reliance on business taxes will present NH businesses and state government with challenges that are unique to the state.

Wages and salaries are generally lower for comparable positions in NH than they are in Massachusetts. At one time it was easy to justify that wage differential because of large differences in the cost of living between the two states. Today, the cost of living differential between the two states has narrowed and NH is considered a high cost-of-living state. The U.S. Bureau of Economic Analysis (BEA) produces a “regional price parity index” Regional Price Parities (RPPs) measure the differences in the price levels of goods and services across states for a given year. RPPs are expressed as a percentage of the overall national price level (100). As the chart below shows (apologies for the poor quality – I lifted it directly from a BEA publication), NH (seen in red) has become a high cost state (largely because of housing costs), nearly as costly as Massachusetts.

price parityIn a state (NH) with living costs that are increasingly comparable to Massachusetts, workers in NH can be expected to seek wages nearly comparable to wages available in Massachusetts. For the most part, however, NH employees do not receive wages comparable to wages in Massachusetts and that contributes to some of NH businesses inability to hire needed workers and to NH’s modest job growth, despite increased job openings in the Granite State.   It may also be a contributing factor to NH’s significant drop in its unemployment rate with only modest job growth (the unemployment rate is a residency-based measure that considers only whether or not a resident of NH has a job or not, regardless of where that job is located).  Little or no growth in the labor force in the coming decades will increase competition for workers and will put more pressure on NH businesses to narrow wage and salary differentials with other, higher-cost states, if higher-skill jobs located in NH are going to grow. The catch 22 is that higher wages increase the BET liability of businesses at the same time they can reduce profitability (if productivity isn’t rising along with wages). A growing disconnect between the profitability of businesses in NH and the tax burden placed on them is not likely to be an incentive for businesses to compete for labor in a era when it is ever more scarce.

Higher wages would not be a problem as long as productivity increases justify wage growth. When workers produce more they should see higher wages. Productivity growth has been modest over the past decade and shows little sign of accelerating. Thus increasing wages will likely mean slower profit growth for businesses in NH and elsewhere. I think we have seen the high mark nationally for corporate profitability for some time. But in NH, the higher wages needed to attract labor will also increase the business enterprise tax (BET) liability of companies. If profitability is indeed more modest because of faster wage growth and modest productivity growth, the BET liability of NH businesses relative to their business profits tax (BPT) liability will increase. An ad valorem tax on a resource (labor) in short supply with a rising price and that is paid regardless of the profitability of a business may increase (or cushion from decline) state revenue for a time but it also seems like a disincentive for businesses to pay the wages necessary to compete for labor and to hire in New Hampshire over the longer term.

New Hampshire’s tax structure has never really been a boon or an advantage for business but it has been attractive to large numbers of individuals and families over the years and it contributed to growth in the state’s labor force via inter-state migration into NH. Growth in key demographic groups within the labor force – skilled individuals with higher levels of educational attainment  and regardless of their age ( two wage-earner, college educated, married couple families with children characterized the typical inter-state migrant to NH) made New Hampshire a much more attractive place for businesses to operate. The in-migration of “talent” fueled the state’s transition to a more sophisticated, technology dependent economy. But there is less state-to-state migration everywhere today and national and regional population, demographic, and labor force growth make it much less likely that NH will continue to realize those benefits from its fiscal structure. In the coming decades as competition for labor increases because of limited growth in the labor force, stronger wage growth will be needed to attract a limited pool of labor. Taxing compensation (as NH’s BET does) will increase tax liabilities for many NH businesses even as higher wages limit their profitability.

It is time for a discussion of NH’s business taxes, but that discussion needs to involve a lot more than just tax rates, credits, and how the rules apply to publicly traded companies.

A Crisis of Our Own Making

Posted December 29, 2014 by Brian Gottlob
Categories: Electricity Generation, Energy, Natural Gas, NH, Uncategorized

Tags: , , , ,

Increased shale gas production as well as a December that is on pace to be the ninth warmest nationally since 1950 has natural gas prices in the U.S. plummeting by 18% in the last three months. Natural gas futures for January delivery fell to $3.144 per million BTU on the New York Mercantile Exchange. These all suggest that a crisis in the New England energy market caused by natural gas price spikes will be less than many predicted this winter.

To be clear, to this point the New England energy “crisis” has largely been a winter phenomenon. The chart below shows the weighted average price of natural gas for electricity generation in New England and the U.S. It shows, natural gas prices for electricity generation are roughly the same in New England and the U.S. with the exception of the winter months, when increased demand for home heating along with the region’s increased reliance on gas-fired electricity generation combine to exceed the capacity of the limited natural gas pipelines in the region. The result is a limited supply and exceptionally high natural gas prices for power generation in the region. As the chart shows, the premium (over average U.S. prices) paid for natural gas by New England power producers has increased each of the past several winters. Abundant supplies and lower prices nationally and a winter forecast of 11% higher mean temperatures compared to the Winter of 2013-14, will lessen but not eliminate natural gas issues or the larger issue of longer-term energy production in the New England region.
Cost of nat gas for generation

The chart below graphically depicts perhaps the most fundamental problem confronting the New England energy market, one that currently prevents the region from fully realizing the benefits of our nation’s booming production of natural gas. The chart highlights the dearth of natural gas pipeline capacity in the New England region compared to most other regions, including much more sparsely populated regions of the country.

ngpipelinesThere is a reason the chart shows a concentration of pipelines in Ohio, West Virginia, Pennsylvania, and other nearby (to New England) Eastern states. These states currently produce about 40% of the nation’s shale gas but they promise to produce an even greater percentage of the nation’s gas in the future. Together, these states (along with small amounts from states near them) hold over 60% of the proved reserves of shale gas in the entire U.S. according to the U.S. Energy Information Agency. Unfortunately, the chart also shows that the increasing number of pipelines emanating from the region don’t make their way into New England. When the U.S. was more at the mercy of the exigencies of the world’s energy suppliers than it is now, New England had someone to blame for its energy disadvantages. With an emerging abundance of natural gas so close by, it is more appropriate to ask ourselves why we don’t benefit from the boom in nearby production.

shale gas productionNew England is not a region that produces its own fossil fuels but few areas of the country do and they still manage to avoid the sort energy “crises” that periodically plague New England. To the extent that there is an energy “crisis” we have nothing or no one to blame but ourselves. Natural gas is generally more expensive in New England but not always for electricity generation, except during a few months of the year when pipeline constraints are the culprit. New England is “retiring” older “base-load” power plants but so are many other regions – seven coal-fired power plants that I know of in Ohio and another five in Western Pennsylvania alone. But these are also states where new gas fired power plants or other generating facilities are being built to replace them and neither of these regions is straining their natural gas pipeline capacity by adding new, gas-fired power plants. I have done studies for three new gas-fired power plants in Ohio in recent years and although subject to just as much regulatory and public scrutiny, none of the facilities faced the kind of parochial opposition characteristic of most proposed projects in New England. I have also done work on a wind energy project in New Hampshire and it faced as much or more opposition as would any fossil fuel generating project. In New England it seems, any energy project with a public benefit is seen as synonymous with trampling some individuals’ rights.

Whatever the extent of the looming energy crisis in New England it is of our own making. If you don’t want renewable energy production (wind, solar, hydro etc.), gas-fired power plants and the pipelines needed to support them, or any other power producing facilities built, you have no right to complain about the availability or cost of energy in the region. Personally, I would like to see more renewable energy produced in New England and New Hampshire but that doesn’t mean we should refuse the benefits from a greater supply of natural gas. If we do, we will only put ourselves at a greater energy disadvantage than we already face. There are many reasons (aesthetic, environmental, etc. technical) why renewables are not a more favored option for generating electricity in the U.S. but most of the arguments in opposition are based on costs. Too often these arguments are made by ideologues, vested interests, and others with an agenda, most of whom have no idea of how to measure the true cost (levelized cost of energy or LCOE) of production by different generation sources or the hidden as well as direct subsidies provided to each.

Despite highlighting the increase in natural gas production this is not a post about the merits of hydraulic fracturing. In the coming years the benefit/cost calculus of “fracking” will be refined. This post is about whether New England will realize any of the benefits that result from an increasing supply of natural gas in the country. I have written before that I do not believe energy prices are the root cause of New Hampshire’s recent slower economic growth (we have had high relative energy prices during the state’s boom periods and New Hampshire is producing more goods and services with a lower energy content per dollar of gross state product than ever before). But even if not a savior, a more stable and abundant supply of energy resources at lower prices would have real economic benefits. Whatever your views of its merits, there is little doubt about the impact of the boom in shale oil and gas production on U.S. energy independence, it will no doubt alter the economic, fiscal and the international geo-political landscape of the country. In ten years it is quite possible that the only nation from whom the U.S. imports oil is Canada. Whether the shale oil and gas boom also alters the prospect for NH’s energy and economic future is less certain but is almost entirely within our control.

The Demographic Trend NH Should Most Worry About

Posted April 25, 2014 by Brian Gottlob
Categories: Demographics, in-migration, migration, NH

Tags: , , ,

I believe that demographics explains two-thirds of everything and with more observers, analysts, and pundits also appreciating the explanatory power of demographics, the use of demography to account for economic, fiscal, and social phenomena has increased dramatically. That also means there are more inaccurate or misleading demographic analyses to sort through to find real insights.

The simple story about how NH is aging rapidly is a nice, if not completely accurate, dramatic story with intuitive appeal that makes it ideal for stimulating PowerPoint presentations as well as marketing and promoting a host of public policies and causes.  Most of the policy prescriptions justified on the basis of demographics will have no impact on the age structure of NH or any other state.   As I have noted before, aging is a permanent, irreversible consequence of low average family size and longer life expectancies in developed societies.   Unlike some states NH’s aging is more a result of its successes than of its failures.   As long as NH continues to have relatively healthier and wealthier (lowering mortality rates) older citizens who resist shedding their mortal coil in a timely manner, and as long as females in the state continue their preference for achieving relatively high levels of educational attainment and labor force participation (lowering birth rates), NH will have a relatively higher median age of its residents.   The youngest states (by median age) in the nation are those with higher birth rates i.e. Utah, California, Texas.   Adding population at age zero has the greatest impact and over the longest time on the age structure of a population.

It is possible for NH to achieve a relatively stationary median age through in-migration; even if the in-migration isn’t concentrated among the youngest age groups (this can be demonstrated mathematically but is not amenable to a blog post).   In fact, that is exactly what New Hampshire did for several decades during its boom years – it added a lot of individuals and families in the middle of the age distribution (30-44), typically two wage earner married couple families (probably both college educated) with children.

I think it is great, although somewhat unrealistic, to  think NH can retain all of its young people in an effort to address the “aging” issue (young people from smaller states and non-metro areas seem to have an understandable preference for locating in areas teeming with a similar demographic).   Even if NH keeps all of its young people in-state after completing their education I don’t think there is anything we can do to keep them from growing older, so as long fertility rates continue to decline the state will only be keeping a somewhat larger percentage of a declining demographic.   But that is not to say that efforts to make the state more attractive to young people aren’t valuable, whether or not they are directed at individuals born in New Hampshire.   In fact, NH should be more concerned with making the state attractive to the skilled individuals with higher levels of educational attainment, of all ages.

Our state’s ability to attract ‘talent” from other states has largely been responsible for NH’s increasing prosperity over the past several decades and that gets to the demographic trend NH should be very concerned with – the continuing decline in our nation’s mobility or rate of inter-state migration.   The recent decline has been attributed to economic conditions but there is a longer-term trend decline in inter-state migration that has been widespread across demographic and socioeconomic groups, as well as for moves of all distances.
National interstate migration rates

Researchers have noted that homeownership and the age distribution of the population (older households move less) can account for some, but not much of the decline, and some have hypothesized that changes in the labor market (reduced job changing and switching of employers) may be playing a significant role.   The chart above shows that both inter-state migration and individual rates of changing employers have been declining. While not indicative of causation, there is a strong correlation between the two variables over time.

NH has seen a larger drop in its annual inter-state migration rate between the decade of the 1980s and the decade of the 2000s than almost all other states. Of course some of that is attributable to the fact that we began with much higher rates (see the drop in other states with high rates of inter-state migration) but it is still an important trend to examine.

State interstate migration change

Examining the relationship between inter-state migration and switching employers with cross-sectional (state level) rather than as a time series, shows a similarly strong relationship, suggesting to me that a more dynamic labor market where individuals are less concerned about moving between employers will maximize NH’s opportunity to increase the net in-migration.   Still, developing a simple predictive model that includes rates of switching employers to explain inter-state migration rates suggests that NH should have seen a much smaller decline in net-migration than actually occurred.   The chart below shows the model’s residuals, or errors in predicting the change in inter-state migration for each state, it shows that NH’s decline in average annual inter-state-migration between the 1980s and 2000s was actually greater than predicted by the model.   At the other end of the spectrum, Massachusetts, while having a declining inter-state migration rate, experienced a much smaller decline than predicted.   A lot of self-serving hypothesis for the above expected decline in NH’s inter-state migration rate will be offered but understanding the real causes are critical for the state’s future.

Residuals of interstate migration
New Hampshire needs to concerned with demographic trends but it also needs to be concerned with the right ones and the ones that it has some ability to influence.   I don’t think the state can or perhaps even should do much about its lower birth and certainly not the lower mortality rates that are key drivers of population aging.   But I do think that achieving a relatively stationary (it will increase it is just a matter of how rapidly) median age is possible. But this will require policies that are concerned with making NH attractive to individuals as well as businesses.   At the local level this is working as evidenced by the differences in growth rates among NH regions, but as the data in this blog suggest, in doing so the state will be pushing against larger national economic and demographic trends.


More on Shifting Economic Activity in NH

Posted April 17, 2014 by Brian Gottlob
Categories: Demographics, Educational Attainment, job growth, New Hampshire, NH, NH Economy

Tags: , , ,

My post on the “Shifting Locus of Economic Activity in NH” back in January generated a lot of interest and emails. That post has more views than any other post on this blog over the past year and half. Admittedly that’s setting a pretty low bar as far as blog readership honors go. Nevertheless I want to thank my family as well as those with an interest in flying, swarming insects and an inability to spell “locust” in their search engines for making it possible.


As I noted in my first post on the topic, I believe there are a number of economic and demographic indicators that support my contention about the shift in economic activity. Still, there are some (many?) in the Granite State who disagree. In the spirit of giving the public what it wants and sparking debate, I present another of what will be several posts on the topic.
Some themes essential to my thesis are: that the ability to attract and retain talent (skilled individuals with higher levels of educational attainment) is the critical ingredient responsible for the shifting of activity in NH – as well as the key ingredient for producing a dynamic economy anywhere; and that communities offering amenities and services desirable to “talent” and at a relatively more affordable price are keys to attracting talent. I think price (the ability to offer desirable amenities and services at a relatively more affordable price lower than other communities that offer similar amenities) has been important. But I also think that patterns of economic activity in NH and throughout the country demonstrate that unless your community or state is sitting on a valuable store of fossil fuels or minerals, being cheaper isn’t enough to generate more robust economic activity. One interesting artifact of the debate over local government fiscal policies is the mistaken belief that communities spend more when they contain a higher percentage of lower-income residents. In fact, just the opposite is true – expectations for services, quality, and amenities, along with their costs, generally rise as communities (primarily cities – small and large) generate more economic activity and become wealthier. This typically creates a lot of conflict in communities that are experiencing new economic successes and associated demographic changes and can make sustaining a higher level of economic activity difficult for a community.
Getting back to the evidence that supports my contention about economic activity in NH, the previous decade has not been kind to NH or most states in terms of job growth. I documented the Seacoast’s increasing share of NH’s employment and in key industries in my prior post on the topic.  Here, and in future posts, I will look at some of the demographics of that job growth to support my thesis. The chart below shows the percentage change in jobs among individuals of all educational levels (age 25 and up) in different counties and the State of NH between 2003 and 2012, as well as the percentage of jobs held by individuals with at least a BA degree.

County Job Growth
Similar to my prior post, the chart shows that job growth has been higher in the Seacoast (defined here as Strafford and Rockingham Counties because of data availability while the prior post used data at the community level) than in either Hillsborough County or the State as a whole. More importantly, the chart shows that the rate of job growth in the Seacoast among those with at least a BA degree has exceeded the rates for either Hillsborough County or the State by an even wider margin. Strafford County has seen an especially large increase (largely in Dover – my domicile in the interests of full disclosure) but its much smaller employment base makes larger percentage changes easier to obtain. Again, however, it is not just job growth but the nature of that growth and the shifting of talent that is the key.
The Seacoast accounted for a higher percentage of the state’s net job growth between 2003 and 2012 (chart below). The percentage of the state’s net job growth accounted for by the Seacoast was 70% compared to 46% for Hillsborough County (note the percentages add to more than 100% because some counties had negative job growth during the time period).

Share of States Job Growth
Almost half of the net job growth in NH among workers with a BA degree occurred in the Seacoast. Hillsborough County still has a larger percentage of job holders in the state with a BA degree or higher (37% to 31% in the Seacoast) but that percentage has slipped by almost 1% over the time period, while the Seacoast’s percentage has increased by 1%. Still even shifts occurring at seemingly glacial speed are very powerful. I suppose it is possible that the Seacoast has just been more successful in adding jobs which overqualified BA’s are filling. Based on my initial examination of job growth by industry, I don’t think that accounts for the relative differences, but in future posts I will examine that and other possibilities.

To Divest or Not to Divest Electricity Generation

Posted April 9, 2014 by Brian Gottlob
Categories: Electricity, Electricity Generation, Energy

Tags: , , ,

Whether or not New Hampshire’s largest electric utility should divest its generating facilities is a hot topic again. The NH Public Utilities Commission issued a preliminary report last week which concluded that it is in the economic interests of PSNH’s retail customers for the company to divest its generating assets. The report was less sanguine about the economic impacts on customers not purchasing electricity from PSNH, but that depends on how the stranded costs are allocated in any divestiture.

“Staff continues to believe that over the long term, PSNH’s default service rate will be substantially higher than market prices resulting in continued upward pressure on default service rates. Based on La Capra’s forecast of wholesale prices in New Hampshire and adjusted for retail, Staff’s rate analysis indicates that PSNH’s default service customers would be better off under a divestiture of the PSNH assets if the stranded costs were recovered from all customers. Customers who do not receive default service from PSNH, however, would see rate increases through the imposition of a stranded cost charge. While we recognize the volatility in today’s energy markets, the value of PSNH’s “hedge” will likely diminish over the long term and will continue to be at risk due to potential environmental legislation.”

There are also smart and well-meaning people in New Hampshire who argue that that PSNH’s generating assets provide a valuable ‘hedge” given the volatility of fuel (primarily natural gas) prices and the impending retirement of several regional electricity generating facilities. But the value of that hedge depends, in part, on the price paid for it. This winter’s cold snap and concomitant spike in natural gas prices are times when the PSNH hedge did provide some benefits. But even in those instances, the net electricity generated by PSNH was below what it was in the early and mid-2000s (the latest available data is for January of 2014 so this may change with February and March data). The figure below shows the capacity utilization of PSNH’s coal-fired generating units on a monthly basis during three separate time periods. Capacity factors are the ratio of net electricity actually generated to the total potential electricity that could be generated by a facility (for this analysis I used the average of winter and summer coal-fired capacity for each facility -Merrimack and Schiller stations – rather than the nameplate capacity).

Monthy capacity
The chart shows that from 2004 to 2009, PSNH’s coal-fired generating units were primarily ‘baseload” generators, operating at 60% of capacity or higher. I have previously written about how electricity gets sold into the regional market and which generators will provide that electricity (which determines their capacity utilization) so I won’t cover that again here. Baseload generating units typically operate 24 hours per day year-round baring maintenance outages. At the other end of the spectrum are peaking generators, which mainly operate when hourly electricity load demand is at its highest (think the hottest summer and coldest winter days). Intermediate (or cycling generating units) operate between base load and peaking generators, varying their output to adapt as demand for electricity changes over the course of the day and year. After 2009 the decline in natural gas prices along with higher generating costs, including environmental, associated with PSNH’s coal facilities have resulted in the price at which it can supply electricity to the regional grid being higher than many other generators. As long as their generating cost remain higher, except for times of peak demand, limited capacity by other generators, or when events like the spike in natural gas prices occur, PSNH’s coal-fired units will produce little electricity for sale to the regional grid. During 2013 alone, there were six months when the coal units operated at less than 10% of capacity. PSNH’s coal-fired units have gone from baseload, to intermediate generators and as the chart below shows, when averaged over 12 months, they are looking a lot more like peaking units. Whether this pattern will continue is the heart of the debate over whether PSNH should be required to divest its generating assets.
Annualized generation
It becomes a lot harder to amortize the costs of generating units as their capacity utilization is lowered. There may be times when the hedge provided by PSNH’s generating assets provides a benefit and that would be truer if the units were baseload generators. But even with the extremes of this winter’s cold, price spike in natural gas, and high demand for electricity, the chart above shows, over the course of a year, the facilities have moved from baseload generators, to intermediate, and are trending toward peaking units. The NH Public Utilities Commission, its consultants, and a lot of other knowledgeable people think that, despite current market conditions and the uncertainties surrounding regional generating capacity and natural gas supply and price, these trends will continue.

Maximizing Costs and Benefits of the Minimum Wage

Posted April 1, 2014 by Brian Gottlob
Categories: Labor, minimum wage, Small Business, wages

Tags: , ,

Note: Links updated and some errors corrected at 6:23 pm

Lawmakers want to do the right thing on the minimum wage issue and even if some don’t, the issue is a highly symbolic indicator of one’s position on a number of important policy issues. That’s too bad because it reduces the probability that the issue will be decided entirely on its merits (benefits versus costs). With so much hyperbole on both sides of the debate it is difficult to know what the “right thing” is and raising wages for those at the bottom of the wage scale has a lot of appeal as an easier and faster way to augment income than is increasing the productivity and educational attainment of individuals.
This month the U.S. Bureau of Labor Statistics (BLS) issued a brief report on minimum wage workers. Anyone interested in the policy debates about minimum wage should at least peruse “Characteristics of Minimum Wage Workers, 2013.”  According to the BLS, about 59 percent of workers in this country are paid on an hourly basis and the percentage of that group that is working at or below the minimum wage declined to 4.3 percent last year. Thus about 2.6 percent of all workers (those paid hourly and those on salary) are paid at or below the minimum wage. Most of those workers are employed in a few industries, led by the food service industry which employs nearly one-half of all workers making at or below the minimum wage.
min wage industries

New Hampshire is immersed in its own debate over raising the state’s minimum wage. In what was largely a symbolic measure, the prior legislature repealed the minimum wage and the current legislature looks to reinstate and raise the minimum wage in the state. My analysis of data from the U.S. Census and BLS’s “Current Population Survey” (CPS) indicates that about 10,000 workers in NH earn at or below the national minimum wage of $7.25 (this number is slightly below the 11,000 estimate in the BLS report, but that report rounds the NH estimate so the discrepancy is probably less and well within the CPS’s sampling error).

number of min wage workersAnother 16,200 earn between $7.25 and the proposed new state minimum of $8.25. Thus about 26,000 hourly workers, about two-thirds of whom are mostly in the food services and retail industries, would be affected by a $8.25 minimum wage. A second proposed increase to $9.00 would affect another 13,600 workers. So all told, about 40,000 workers or about six percent of all workers in the state could be affected. I did not analyze the age composition of NH’s minimum wage workers but a 2007 study by the Federal Reserve Bank of Boston did and they conclude that younger workers comprise a larger portion of minimum wage workers in NH than in the U.S. as a whole. Almost one-half of workers at the minimum in NH are teenagers age 16-19 (chart below).

age of min wage workersWhatever the result of NH’s minimum wage debate, a lot of people earning far more than minimum are working to influence the outcome. I have no personal or professional stake in the minimum wage debate but I like the issue because it is a documentary on highly-charged policy fights, combining real and perceived forces of good and darkness: economics, emotion, populism, ideology, compassion, greed, idealism, labor versus management, as well as wealth versus want. The minimum wage debate also provides some of the clearest examples of the tradeoffs involved in public policy choices. In this case, the tradeoff is raising wages for some while reducing the employment opportunities (hours or jobs) for others. Despite what the media say, and the President’s statement that “there’s no solid evidence that a higher minimum wage costs jobs,” most economists do agree that minimum wage increases result in some economic damages (reducing employment). They don’t agree on everything about the impacts of the minimum wage, however, and a good number of reasonable economists believe that the negative employment impacts from minimum wages are offset or even outweighed by the benefits. The negative employment impacts are substantial but do not appear, to me at least, to be dramatic, which of course is a fairly insensitive view that could only be held by someone not negatively impacted by an increase in the minimum wage (who are likely to be the least skilled and with the fewest economic opportunities among us).

In any case, having some negative impacts is not, in itself, enough to reject a policy. Most people, me included, accept the fact that the tradeoff for a compassionate policy that provides a minimal cushion against the ravages of unemployment (unemployment compensation) is some increase in the rate of unemployment. There are just as many or more policies that benefit some businesses or industries but also have some negative competitive impacts or costs to consumers.

I don’t have strong feelings either way about re-establishing and raising the state’s minimum wage. Raising the state’s minimum wage will cost some businesses and/or consumers more and reduce and have some negative impact on employment and hours worked (see the Boston Fed’s study here if you don’t trust me). The chart below demonstrates (too busily) the impacts on a business of an increase in the minimum wage assuming they can’t or don’t raise prices and any increase in the minimum wage comes at the expense of profitability (that is increases is efficiencies can’t offset wage increases). Wages comprise close to 40 percent of business costs for both food service and retail businesses and the high-end of profit margin in those industries is about 5 percent so the chart also incorporates those two assumptions. Depending on what percentage of the businesses’ workforce is currently at or below the minimum wage, the chart shows how business costs increases for both the $8.25 and $9.00 increases (the red lines), as well as how profitability is affected (the blue lines). It may use simplifying assumptions but I think the chart demonstrates why businesses in affected industries are so opposed to a minimum wage increase. While expenses appear to rise modestly, profit margins can quickly erode.

business impactsMy issues with raising the minimum wage tend to be more about the distribution of the impacts than with their magnitude. Freedom from want for working Americans should be a national goal. If augmenting the income of individuals with the least earning power (because of experience, skills, education, etc.) is a national goal, it is it is hard to see why that responsibility should fall only on a few industries that employ these individuals, especially when doing so will only decrease the opportunities for employment.  That seems to be the philosophy behind the Earned Income Tax Credit.  There are other distributional impacts as well.   Those with the least opportunities bear the greatest negative employment impacts even as they also receive some benefits.   Big companies are more able to absorb higher costs and in any case are less likely to pay minimum wage, so smaller, local businesses already at a cost disadvantage can be put at even more of a competitive disadvantage.   This is especially true in rural areas. Small, rural towns have lower costs, especially for real estate, so an increase in the minimum wage gives cities and big companies competitive advantages at the expense of small and rural employers.

As is the case with most policy debates, proponents of a minimum wage increase maximize benefits and minimize costs while opponents minimize the benefits while maximizing the costs.

Energy Prices Won’t Be Our Savior

Posted March 24, 2014 by Brian Gottlob
Categories: Electricity, Energy, New Hampshire, NH Economy

Tags: , ,

For as long as anyone can remember New Hampshire (and most of New England and the Northeast) has had high energy prices compared to most other states.  We may narrow the gap some but as sure as tomorrow will be Tuesday, compared to most other states and regions of the country, our energy prices will be higher. There are a number of reasons for that and they can’t be adequately covered here so for now let’s move on to the real concern of this post.  Many will disagree with me about the prospects for relative energy costs in the state but even if I am wrong, and NH and New England could somehow be truly energy price competitive with the rest of the country, we are likely to be very disappointed in the resulting economic benefits.  I am all for lowering energy prices and doing whatever we can do to accomplish that.  Reducing energy costs will give households more discretionary income, ease the burden high energy prices place on many households, and benefit the cash flow of many businesses.  These are real economic benefits but based on op-eds and comments about how high electricity and energy prices are killing business, including by people and groups I like and respect, you might think that reducing the price of electricity will bring a new industrial revolution to the state.  The problem is, a new industrial revolution has been occurring and it is one that relies less on energy and is, in part,  a result of those high energy prices.

Energy BTUs per GS

Energy prices are becoming less important to the success of the New Hampshire economy all the time.  As the chart above shows, the energy content of what the state produces has been declining for decades.  More of what we produce relies less on energy content and the lower energy intensity of the NH economy indicates a lower price or cost of converting energy into GDP.  Reducing the price of an input that is becoming less important each year to the output of the NH economy is not a prescription for revitalizing the NH  or any state’s economy.

To cite just one example, high energy prices have hurt but certainly didn’t kill the pulp and paper industry in New Hampshire.  Industrial electricity rates in Georgia are almost exactly one-half (5.97 cents/kwh) what they are in New Hampshire (11.97 cents/kwh avg. as of Dec. 2013) but Georgia lost 10,000 pulp and paper jobs (40% of the industry in that state) over the last 11 years.  Industrial electricity rates are 40% lower in Wisconsin and Pennsylvania than they are in New Hampshire and those states lost 11,000 and 10,000 jobs respectively in paper-making industries.  California lost more than 13,000 jobs in the paper industry, Illinois 12,000, Ohio 10,000 etc., etc. etc., to the tune of about 200,000 jobs lost across the country and in states with both high and low energy prices.  So if you thought that lower electricity prices would reverse that  industry you would be wrong.

I hope NH does lower electricity prices and if we do, congratulations, we will have won a battle for the 1970’s and 1980’s.  Maybe then we can turn our attention to the battle for the future.   If you want an example of a NH paper company that is fighting (and winning) today’s and tomorrow’s battles consider Monadnock Paper, you can read an excellent online Forbes article about them here.

The future is as much or more about reducing energy intensity as it is about lowering energy prices.  In fact, while lowering energy prices would have been great for NH circa 1980, it might also have delayed the long-term economic adjustments and reductions in energy intensity needed for our state and region to thrive. An industry that can’t thrive in NH because of energy prices is an industry that probably could not thrive in a global economy for a number of other cost-related reasons.   Maine’s industrial electricity prices are about one-third lower than they are in the rest of New England and I don’t think it is a coincidence that Maine is the only state in the region with an economy as energy intensive as the rest of the nation (chart below). Maine’s reliance on more energy intensive natural resource industries hasn’t served that state’s economy well in recent decades.

state by state energy intensity

Our state’s (and our region’s) comparative advantage will never be natural resources or lower costs such as electricity.  For the most part, state economies have been adjusting to account for that fact in what has been at times a painful but necessary adjustment.  As the chart below shows, states with high electricity prices also generally use less electricity per dollar of gross state product.

Eelectricty prices and energy intensity

Although it can, becoming a less energy and electricity intensive economy does not just mean ‘de-industrializing” or becoming a more services-oriented economy.  The dollar value of what New Hampshire’s manufacturers produce continues to climb in real dollars, they just do so just using less electricity every year.  As the chart below shows, the electricity content per dollar of manufacturing output in the state continues to decline and it is not a coincidence that our manufacturing sector has been evolving from traditional to more advanced manufacturing.

electricity content of manuf

Although much of this trend in manufacturing  has to do with the loss of more energy-intensive industries and the emergence of newer, less energy intensive industries, as Monadnock Paper demonstrates, some is also about traditionally energy-intensive industries adapting to the state’s less competitive energy climate.   In either case, the NH economy and individual businesses are way ahead of energy policies in the state.  The question is whether energy policies can catch-up enough to help facilitate the energy and economic transitions and adaptations that are occurring in the state’s economy

Can “Paycheck Equity” be Mandated?

Posted January 28, 2014 by Brian Gottlob
Categories: Gender, Labor, Labor Force

Tags: ,

For decades, one of the most salient features of women’s status in the labor market was their tendency to work in a fairly small number of relatively low-paying, predominantly female jobs. That has changed and as it has differences in aggregate average wages between men and women (the most often cited data on the “wage gap”) have narrowed. Still, the aggregate average wages of women are  almost 20 percent lower than the aggregate average for men.  But that data say almost nothing about whether employers compensate men and women in similar positions differently.  Only a thin veneer of empiricism covers what seems to me to be fundamentally ideological arguments in the public debate on what, if anything, government should do to address the gender wage gap issue.  Proponents of “paycheck equity” measures don’t often acknowledge that research shows that differences in labor force participation, occupation, experience, etc. account for the majority of the difference between the average wages of men and women. While those who believe markets (including labor markets) operate perfectly, and who reject almost all government interjections into markets, fail to note that even accounting for differences in occupations etc., there is still a significant portion of the pay differences between men and women that is unaccounted for or “unexplained.”  The unexplained portion of the wage gap is probably 8 percent or less and whether this difference in wages is the result of biases or discrimination that can be remedied by legislation is the fundamental public policy at issue.

Living with four, smart, talented, women with strong opinions makes me approach this subject with trepidation.  It is possible that one or more of them may talk to me even less than they do now  (I am comforted knowing that it gets incrementally more difficult for this to occur as the amount approaches zero) if my interpretation of the issue is in error in their eyes.  Still, as the father of daughters, I want to know if there are any biases in the labor market that may constrain their earnings and limit their ability to care for me in my dotage.

To truly know whether biases or discrimination (intentional or not) contribute to the wage gap you have to do the impossible, you have to compare the wages of men and women with identical ages, education, qualifications, experience, motivations, work habits etc., in identical jobs, working for identical companies, and you have to do it for the entire male and female workforce (across all occupations).  Nobody can do that so in the absence of a Boston Celtics, Boston Bruins, or UNH hockey game on television this past Saturday evening I undertook a smaller task to gain the kind of first-hand insight into the issue that only analyzing data can provide.

My goal was to compare the wages and salaries of full-time working men and women who are as similar in education, age, experience, occupation and other factors (marriage, children etc.) as possible, to see if wage and salary difference exist when as many key characteristics of individuals are as similar as possible.  The 2009 March Supplement of the U.S. Census Bureau’s “Current Population Survey” contains information on the college majors of those who have earned degrees, in addition to the usual labor force, earnings, and demographic information it provides about survey respondents.  I extracted microdata for over 5,000 survey respondents nationally whose highest educational attainment was a bachelor’s degree in accounting and who were employed full-time as  accountants or auditors.  Focusing on just one occupation and one level of educational attainment limits the ability to generalize my results (that is, results and conclusions may not apply to other occupations or to other levels of educational attainment) but choosing just one occupation that has a relatively equal employment distribution between men and women, and just one education level is likely to provide the cleanest evidence or lack thereof for the wage gap.

Many factors contribute to gender wage differences between men and women in the same occupation.  In the end, like other researches, my analysis showed that under 10 percent of the difference between the wages and salaries of men and women (in accounting) cannot be explained by difference in hours worked, the presence of children etc.  This little exercise cannot say whether those “unexplained” or unaccounted for factors mean discrimination or bias or less pernicious forces that are not captured or measured with available variables.  Regardless, the results were fascinating (to me at least) for a number of economic and sociological reasons.

At all age levels, women in accounting worked (on average) fewer hours weekly than did men (Figure below).  This was true for women with and without children and whether they were married or not.  Regression models show that each additional hour worked per week actually added more to the annual wage and salary of women than to men ($641 to $568).  This suggest to me that women are rewarded equally for additional labor and that some of the wage gap in accounting is simply attributable to the longer (on average) hours worked by men.

hours workedChild birth and care is associated with lower labor force participation among women but on average, women in accounting worked fewer hours than did men whether or not they had children.  This is not an epiphany because child care responsibilities still disproportionately fall on women.  The presence of children, however, does have a much more negative impact on hours worked for women than it does for men. The effect on hours worked diminishes by age for women – presumably because children are more likely to be older and in need of less care.  Interestingly, among younger men, the presence of children reduces hours worked (not as much as it does for women) but among older men, the presence of children is associated with small increases in hours worked.  I hope this implies larger roles in child care among younger men that will contribute to a further narrowing of the wage gap.

Impact of Children on Hours workedWages grow with age and experience (typically for most individuals into their late fifties) but among accountants with bachelor’s degrees, they grow less, on average, annually for women than for men.  The cumulative effects of hours worked, breaks in labor force participation among women for child care, and other factors can account for some of this.  But key factors that can determine how much wages grow over time (getting promotions, asking for raises, motivation etc.) cannot be discerned from the data.  If women aren’t promoted as readily or don’t seek raises as often or as large,  their annual wage growth would be expected to be lower.

The figure below shows some of the wage and salary impacts for men and women of different variables.  Interestingly, marriage seems to have a much more positive impact on the earnings of men  than it does for women,  adding $3,415 to earnings of men but just $920 for women when controlling for other variables (i.e. age and hours worked, children,  etc.).

wage and salary impactsApparently some stereotypes are based in reality and it makes me wonder what aggregate economic and societal implications this may be having as more young men seem to resist or delay marriage or long-term relationships.  The big take away for me was the impact that marriage as well as the “unexplained” difference attributable to gender had on wages and salaries when earnings were not “constrained,” meaning that the data included the earnings from the highest earners, the “outliers” or top 15 percent who earn much higher salaries than typically earned in the occupation.  For most of my analyses I selected data for individuals whose wages and salaries were between the 15th and 85th percentile of all earners among accountants.  But I also ran the same analyses using data that was not constrained at the top of the earnings scale.  This would likely include business owners and individuals in higher level positions.   When data was not constrained based on wages and salaries, the impact of marriage on the wages and salaries of women was significantly negative in contrast to the wage and salary constrained data where it was positive (albeit a much smaller relationship with earnings than for males).  The unexplained difference attributable to gender was also disproportionately large compared to the constrained data set.  What this says to me is that the largest evidence of a gender wage gap occurs at the upper end of wages and salaries and may be more attributable to lower percentages of women in higher positions (a “glass ceiling” effect) than a paycheck fairness effect.  Does this mean that women are at a disadvantage in becoming high earners if they are married, and if so, is it the result of personal choices or does the labor market systemically punish them relative to men?  Does being married necessarily mean that a woman will be less likely to rise to the top of their occupation?   These results do suggest a glass ceiling that contributes to the wage gap and this should trouble all fathers of daughters, brothers,  husbands and even friends.  Unfortunately, it doesn’t say much about what we can do about it.

We do have laws that prevent wage and salary discrimination based on race and gender and yet the wage gap persists (even as it has shrunk).  As more women populate higher levels of occupations and organizations (it will happen as I suggest here and here and in several other posts), it is likely that whatever unexplained gender-based differences in wages and salaries (that are not based on occupation, education, experience etc.) will decline rapidly.  To me, addressing why more women don’t reach higher positions in organizations  is likely to be a much more effective prescription for whatever gender gap continues to exist than are mandates that seek to compensate for factors that we aren’t even sure contribute to wage and salary differentials between genders.

The Locus of Economic Activity in NH is Shifting

Posted January 21, 2014 by Brian Gottlob
Categories: economic development, Educational Attainment, job growth, NH, NH Economy

Tags: , , , , ,

I gave a presentation last month during which I argued that the locus of economic activity in New Hampshire is shifting to the Seacoast.  That is a provocative statement destined to offend the population centers of Manchester and Nashua and quite likely the individuals elected to represent them. Provocation isn’t my intent, it rarely is, but is often the result nevertheless.  This shift will take years to become more apparent but the evidence for its occurrence appears across a range of important economic and demographic metrics.  Over the past decade, private sector job growth in the combined Portsmouth and Dover/Rochester NECTAs** has outpaced growth in either the Manchester of Nashua NECTAs.  The Seacoast is home to only about 15% of private sector employment, but that percentage is growing.  The shift is not really about the job growth numbers because the Seacoast will always have smaller employment numbers than will the population centers of Manchester and Nashua.  It is about how so much more of the innovation and transformation that is occurring among businesses and industries in the state’s economy is occurring in the Seacoast region.

NH Regional job growth

Alone, the increase in private employment in the Seacoast relative to the Manchester and Nashua regions would not be that significant.  Rather, it is the increasing share of innovation and growth in key industries that the Seacoast is capturing that indicates the locus of key economic activity is shifting.  As the chart below shows, the Seacoast region has marginally increased its share of New Hampshire’s private sector employment since 2004, but it has, in relatively short time, substantially increased its share of finance and insurance industry employment, information industry employment, as well as both health care and manufacturing employment.  Annual town-level data stops in 2012 but with the coming addition of technology dependent, international companies like Safran, the manufacturing trend appears to be continuing.   The one key industry where the Seacoast has not gained share is in professional and business services.   This is a large, important, and growing sector of the New Hampshire economy.  In most states, key professional and business services firms often locate in the state’s largest city.  Major NH Law firms, engineering firms, advertising agencies, and many of the other industries that comprise this sector still seem to prefer to be centrally located and have their main offices in the state’s largest city, Manchester.  Having a main office anywhere other than  the largest city seems to signal, to some, that a business is “regional,” that it does not serve the entire state or the larger New England region. The Seacoast is also capturing a smaller share of retail employment, which is surprising given its location along two state borders.  It is not that retail is declining in the region but rather that it has grown faster elsewhere in the state.

Seacoast share of industries

Manchester and Nashua are still home to more companies in key industries than is the Seacoast and that will be true for some time, maybe always.  Still, there was a time when the Greater Nashua and Manchester areas were the technology and manufacturing center of New Hampshire and almost all important developments in manufacturing and technology industries occurred there.  These regions remain the technology leaders by numbers, but more key developments and new companies in technology and manufacturing are  occurring in the Seacoast.  The development of the Pease Tradeport into a premier location for industries of all types, along with the presence of a major research university (UNH), have played important roles in the shift.  But what is really sustaining the trend is the ability of the region to attract the talent (skilled individuals with higher levels of educational attainment) that companies in emerging, growing and higher value-added industries desperately need.   As I say far too often, brains are the most valuable resource in the 21st century.  Skilled, well-educated people have the most economic opportunities and they are the most mobile members of society.  Where they choose to locate, robust economic growth is likely to follow.  Examining Census data indicates that skilled individuals with higher levels of educational attainment have increasingly chosen to live in the Seacoast, and that has provided a key source of competitive advantage to the region.  The chart below shows how the population of individuals with a bachelor’s degree or higher has changed in some NH cities over the past two decades.  The chart shows that on a percentage basis, Portsmouth and Dover, by far, had the greatest increase of individuals over the age of 25 with a bachelor’s degree among their populations.  Somersworth, although beginning with a lower concentration of individuals with a bachelor’s degree, had the next largest percentage increase in subsequent decades.  Among the largest cities in the Seacoast, only Rochester has not seen a substantial increase in its population with a bachelor’s degree or higher.

Changes in Ed Attainment

If the Seacoast continues to increase its concentration of “talent,” then the locus of economic activity in the state will continue to shift toward the region.  Communities in the region continue to attract skilled individuals with higher levels of educational attainment because, to varying degrees, most have been able to provide a mix of services and social, cultural, and civic amenities, at a price more affordable than communities in other states.  But if being the “cheapest” place to live were the key, the Seacoast would not be thriving.  Rather, it is the combination of services and amenities at  relatively more affordable price (providing a good value) that has been attractive.  Many communities and regions are looking to thrive.   Like all regions in New Hampshire the Seacoast has heard, and for the most part heeded, the call for fiscal restraint (although you can never spend too little for some or too much for others), but most of its communities have looked for ways to continue to provide or increase the quality of their services and the amenities (natural, built, civic, social and cultural) they offer.  It is more difficult for urban areas to attract and retain the skilled individuals with higher levels of educational attainment that are increasingly the key to a vibrant economy because urban cities have to find ways to provide and encourage a level of services and amenities to compensate individuals for living in cities that have the problems associated with urban environments.

Most of the focus of economic development strategies is on creating policies to ensure a “good business climate.”  I think that is important and I also think NH has a pretty good business climate.  With so much concern over population and labor force growth and demographic changes in NH, more emphasis needs to be placed on creating a good “talent climate” as well as a good business climate. I don’t know that the Seacoast of NH has sought to do that but the demographic and economic data suggest they have done so regardless.   The result has been a competitive economic advantage. On a smaller and slightly different scale you can say the same thing about the Hanover/Lebanon area which serves as a nice control group to assure the importance of amenities don’t just mean having an ocean nearby.


** NECTA = New England City and Town Area, a grouping of towns into a connected labor market area, akin to a metropolitan or micropolitan statistical area.

The Incredible Shrinking Labor Force

Posted January 10, 2014 by Brian Gottlob
Categories: employment, Gender, Labor Force

Tags: , , ,

The employment growth report released today by the U.S. Bureau of Labor Statistics was disappointing for sure (74,000 job growth when 200,000 was the consensus estimate) but December employment numbers are more prone to seasonal adjustment errors because of the large amount of hiring that occurs prior to the holidays and this year presented even more issues because of the shortened time between Thanksgiving and Christmas (Thanksgiving was on the 28th, its latest possible date).  December’s employment growth may still be disappointing but my bet is that December’s numbers will be revised up in future months.  Help wanted ads have been increasing for the past six months and the labor supply/demand ratio has been falling.  Unless there is an even bigger “skills gap” than many think, that implies stronger job growth than was reported in December.

The best thing about the report was that it helps focus more attention on the nation’s incredible shrinking labor force, a problem that significantly lowers the potential economic growth of our nation’s economy.  Too many media reports on the nation’s and NH’s economy focus almost entirely on the unemployment rate.  That is especially true in New Hampshire where, because of our demographics (a lower percentage of harder to employ populations are in our state’s labor force), we always have a lower unemployment rate than the U.S.   No matter how weak job growth is in New Hampshire, many will cite our lower than the U.S. unemployment rate as a sign of economic strength.  Some reporters (hat tip to John Nolan of the Rochester Times) have avoided confusing job growth with the unemployment rate but too many in our state confuse the two.

The problem of smaller or slower growing labor force is an important and vexing one for New Hampshire and the entire U.S. A smaller or slower growing labor force implies slower economic growth because the output of the economy grows when more people are producing, when more capital (equipment and machinery) allows the same number of people to produce more, or when knowledge/technology/skill levels improve and allow greater productivity per worker. So unless productivity is increasing to compensate, a shrinking or slow growth labor force means slower economic growth.

There are several reasons a labor force can shrink or grow more slowly. Some related to economic conditions, some related to demographics, and some (such as the current situation) seem to have an unexplained element. Nationally, population trends have meant slower labor force growth as lower birth rates over the past few decades and as baby boomers reach ages where labor force participation starts to decline. NH benefited from strong population growth in the 70’s and especially 80’s and 90’s. That provided a strong boost to our economy, especially since much of that pop. growth was the result of in-migration from other states by skilled, well-educated individuals (a good characterization of our in-migrants from other states is a two wage earner, married couple family, probably both college educated with children). That migration added tremendous talent to our labor force and made NH an attractive location for many business looking to employ skilled workers.

The labor force grows or shrinks by population growth in the working age population, or by changes in labor force participation (those of working age who choose to be in the labor market or not). NH and the U.S. have seen slower population growth in the working age pop., but more disturbingly, both have seen a decline in the labor force participation rate.  Yes NH still has a relatively higher participation rate but the trend decline is similar to the U.S.  The graph below shows the decline in participation among individuals aged 25-64 (to minimize schooling and retirement decisions as possible causes).

nh us labor force particpation 25-64

If your working age population isn’t growing, having high labor force participation rates is critical for economic growth.   NH has had very high participation rates compared to the U.S. because of our favorable demographics (few people who traditionally have lower levels of participation – minorities, those without a high school diploma etc., and because our population overall has higher levels of educational attainment that is associated with labor force participation).  Women in NH especially tend to have higher participation because of higher levels of education and lower fertility rates (child-bearing lowers labor force participation).  I have written many times on gender and employment (search on gender in this blog) and the “feminization of the workforce” is a theme (non-pejoratively as the father of daughters) I believe is continuing.   As the chart below shows, virtually all of the decline in the labor force participation rate in NH is a result of a reduction in the rate among males.

male female labor force participation

Labor force participation always drops during recessions as workers get discouraged and drop out.  What is especially troubling today is that labor force participation continues to be weaker even as the economy has improved. Some has to do with demographics as more of the working age population ages into groups with lower participation rates although participation among those with higher levels of educational attainment seems to have held-up best. The best explanation of why labor force participation has continued to be lower than in the past is that the skills required by the economy have been changing, making many workers less qualified than before and creating more discouraged workers. I think that is part of the issue but I don’t think the “skills gap” could have so abruptly hit the labor market to cause participation rates to fall so much over the last half-decade. The skills gap has been a more slowly growing phenomenon.  Among older men without a post-secondary degree, participation has been declining for decades.  The skills mismatch between the supply of labor among males and the demand has been ongoing for decades.  Did it peak so suddenly in the past decade to create a permanent decline in the male workforce?  I don’t think so, additional factors are contributing.  I remember in the 70’s when the first real oil crises hit (related to Middle East wars) and a lot of job losses resulted, especially in mill towns like the one I festered in as a youth.  Someone whom I thought was wrong about almost everything said to me at that time “a man should never be ashamed of any job he takes to feed his family.”   I didn’t think much about that back then, but today it seems especially appropriate, even as it appears to be increasingly a relic of an outdated ethic.  Economic conditions today aren’t the result of people not wanting to work and a labor market where many individuals are working at jobs that don’t fully utilize their skills is not desirable.  Changes in and the performance of the economy are  obviously largely responsible for declining labor force participation.   Still, with so many troubling indicators for males  – especially younger males (educational performance and attainment, household formations etc.)  emerging over the past decade or more , I can’t help wonder how much of the decline is the result of a lost ethic among my gender.