Posted tagged ‘NH’

Electricity Prices Highlight the Benefits of Markets and Choice

March 28, 2013

Four of the six New England states (CT,ME, MA and NH) had lower average retail prices for residential electricity customers in January of 2013 than they did in January of 2012 (chart below).

Chang in Avg Retail Price of Electricity

Most of that is a result of the increasing sales into the region’s electricity market  of electricity generated by natural gas which is priced lower than the electricity generated using other sources.  The decline in the average price in NH is smaller than in some other states but it could have been, and could still be,  larger if retail competition in the residential electricity market takes hold.   The chart below shows the average cost of retail electricity for residential customers in the continental United States in January of 2013.  New Hampshire and all of New England have among the highest average rates but based on the contract information from the largest competitive suppliers of residential electricity in New Hampshire, the average price would be significantly lower (at least until November of 2013) for those who choose the lowest rates available from competitive suppliers (other higher rates are available that let customers choose to purchase a higher percentage of electricity generated from ‘green” sources).

Avg Residential Price of Electrictyby State

I was going to make this a much longer post and include a discussion of why the warnings by some about an “over-reliance” on natural gas in the region are overstated but not inaccurate (the natural gas pipeline limitations to the region are real but more likely to be remedied than not with increased natural gas usage in the region) but I will save that for another day.  The reputation and belief in free(er) markets and competition have taken a beating over the past several years so  for now I am just going to enjoy highlighting  of  one of their recent successes.

Gasoline Taxes, Prices, and Price Differentials

March 27, 2013

Policymakers often assume that sales and excise taxes are the primary reason for variations in the price of goods and they too often assume that consumers consider differences in tax rates across jurisdictions when making purchases rather than differences in the total price (tax plus non-tax price) of a good.  A good example was the $.10 drop in NH’s cigarette tax in 2010.   Some thought the decrease would be a beacon to NH for consumers.  But the decline did nothing to lower the price of cigarettes in NH because manufacturers increased their price by an equivalent amount immediately after the tax decrease (effectively capturing the revenue that would have gone to the State of NH).  I did a fair amount of gloating in an early post as the revenue numbers reflected my predictions. Consumers saw no price break and no major changes occurred in other states so no increases in competitive advantage for retailers occurred in NH (retailers saw no benefit) and the longer-term trend of declining smoking rates (along with a things like higher gasoline prices and fewer visitors to the state) were the primary determinants of sales trends, and thus lower revenues.

The demand for gasoline, like cigarettes, is relatively inelastic so it takes a surprisingly large price increase to change consumption very much but differences in prices among  locations may shift the location of some gasoline sales where consumers can conveniently choose where to make their purchases.  I can buy gasoline as easily in Maine as in NH and with a little more effort I can also buy in MA.  I often can get gasoline as or even a bit cheaper in MA than in the town where I live,  but I can’t get gasoline cheaper in Maine.  I can also get gasoline  cheaper if I drive a few miles to towns just north and south of me, or even to a gasoline station on the other side of town.   These price differences are often $.10 per gallon and occur among retailers of similar types – i.e. gasoline stations with a convenience store, the same brand convenience store selling the same brand of gasoline.   Nevertheless, when I look at the average price of gasoline between neighboring states (with some exceptions like California where environmental regulations have large retail price impacts), the differences in price appear  to be strongly related to differences in state tax rates (r=.82).  Comparing statewide average prices and tax rates for gasoline masks much of the variation in pricing that occurs within states and even within communities.  That is one reason why I think policymakers focus so much on tax rates as the primary reason for price differences.

State Gasoline Prices

Despite all of the attention to gasoline prices and proposals to raise or lower gasoline taxes over the past decade there has been surprisingly little research on the retail price impacts (or “pass-through” effects) of changes in gasoline taxes.  That may be because changes in gasoline taxes are relatively small (usually a few cents) compared to the much larger price changes that occur as a result of  supply/demand issues and variations in the world-wide price of oil.  The chart below shows how gasoline prices in NH have changed since 2004 and it also shows the theoretical price if the state had no excise tax on gasoline.  The red line shows the theoretical prices because, like cigarettes, retail prices may or may not be reduced by an equivalent amount if the gasoline tax were lowered.

Monthly NH Gasoline Prices

The theory of tax incidence suggests that sales and excise taxes should be fully passed on to consumers in competitive markets with constant marginal costs.  Less than full “pass-though” is expected in markets with increasing marginal costs, while the pass-through rate may be less than, or greater than, one-hundred percent in markets that are less competitive.  In addition, tax increases in one state may lead to higher prices across the border as stations there face greater demand.  A study examining a temporary reduction and reinstatement of a 5% gasoline tax in Illinois (sorry I can’t find the reference)  found that that when the 5% tax was eliminated, prices declined by 3% and when the tax was reinstated prices rose by 4%.

Politicos are looking to score big points for their positions on gasoline taxes.  There was a time when whatever marginal changes lawmakers made to gasoline taxes may have meant a lot to changes in prices at the pump.  Right now, and in the future, changes in world-wide oil markets are likely to overwhelm  any impacts from changes in state taxes and  together with the uncertainty over the degree of pass-through, make any predictions about the economic impacts of gasoline tax hikes nearly impossible.

Funding Roads and Bridges to Perdition

March 25, 2013

Gasoline taxes, road tolls and highway infrastructure spending are issues at the forefront of a lot of heated debates in state legislatures across the country.  I am going to write about the issue a couple of times this week.   Some lawmakers want to raise sales or other taxes to pay for infrastructure and others want to increase gasoline taxes and other “user fees” to pay for it.   The highway infrastructure spending and revenue issue can illustrate classic principles of sound fiscal and economic policy so it is too bad that the debates have generally taken the “low road” by framing the issue almost entirely as either one of “who wants to raise taxes and who doesn’t,” or “who wants to makes roads and bridges safe and who doesn’t”.

User fees are a good thing and it is sound fiscal policy to have the users of roads pay for them via gasoline taxes, road tolls, and other fees that reflect an individual’s usage of roads and bridges.  When general revenues are used to pay for roads and bridges people who don’t necessarily use them wind-up paying for a portion of highways and subsidize the usage of roads of those who travel them a lot.  When you subsidize something you can bet you are going to get more of it than you would have gotten without the subsidy and in this case that means more travel on roads which, of course, means there will be more need for roads and spending on roads and that means more subsidy and that approach is surely a road to perdition.

It was nice to see New Hampshire rank high in a recent report (issue brief) by the Tax Foundation on the percentage of  highway spending that is funded by user fees like gasoline taxes, tolls and other fees.  Unfortunately, in making good points about user fees, the Foundation draws the wrong conclusion about the data it uses to make them.  That happens a lot when you use bivariate analysis to draw conclusions in a multivariate world.  Instead, using multivariate (regression) analysis on the data, it becomes clear that it is less the use of good principles of fiscal policy that results in states paying for a higher percentage of the costs of highways with user fees, than it is a function of the volume of federal government grants they receive.  So a cursory look at the Tax Foundation’s report can give NH a sense of superiority in fiscal policy over many states (while I generally think that is true about NH it is not so much in this case),  and especially over Vermont because that state funds just under 20% of its highway spending with user fees compared to NH’s 42%.  The real reason those percentages are what they are is that Vermont receives about 64% more federal highway funds per capita than does NH ($220 to $134 in 2010). The chart below shows the simple relationship between the percentage of highway spending in a state that is funded by gas taxes and user fees and the amount of federal highway funding per capita in each state.

User fees and Fed funds

States like NH that fund a higher percentage of highway expenditures with user fees do generally receives lower amounts of highway funds from the feds (the data point slope downward to the right).  There are even more intervening variables, like the amount of federal highways (by mile) and as a percentage of all highways that are in a state but still, by far, the amount of federal highway funding per capita is the best predictor of the volume of highway spending per capita in each state. The amount of motor vehicle-related user fees per capita were a distant second but still significantly related to highway spending.

Fed Highway per capita

Almost everyone agrees that NH’s (and every other state’s) roads and bridges are in need but I don’t think the debate is ever going to be about the wisdom of user fees versus general revenues in paying for highway infrastructure.  It is too bad because if it were we just might reduce the need for more spending in the future.

A Hot Topic for a Cold Day

March 18, 2013

Climate change skeptics have to appreciate that there is no better time to talk about the topic and about global warming than during a period of below average temperatures.  I don’t expect anyone to believe anything I say unless I can empirically demonstrate my point so I appreciate those who bring solid empirical evidence to a debate while leaving ideology and polemics out.

In the competition for our time and attention the issue of climate change competes with a lot issues that seem to more directly and immediately impact us.  At least that was the case for me until I heard a presentation on the impacts of climate change on the Piscataqua River Basin/Great Bay region of NH and Maine.  As a guest of a local Rotary Club I heard a presentation by Prof. Cameron Wake of the Institute for Earth, Oceans, and Space at the University of NH.   You can get a copy of the report here.   It is one thing to generically consider an issue like climate change, it is another to consider it in the context of evidence of how it directly impacts those things and those people whom you care deeply about.  I love the Piscataqua and Great Bay and Little Bay region.  I walk with my best friend almost daily there – I took these pictures yesterday.

IMG_20130317_100056IMG_20130317_093300

So when I hear solid empirical evidence of threats to it I listen.  It makes me wish I listened sooner and it also makes me wish similar reports could be written for every region where someone cares about the natural amenities around them that will be affected by climate change.   I regularly work for companies that burn fossil fuels to produce electricity and none of them have been robber-barons unconcerned about the potential impact of carbon on climate change.  They too all have places like the Piscataqua River Basin that they love.

Durham temp proj

I hate anecdotal evidence but it is hard for me not to consider the reduction in cold temperatures and snow during winter months (despite tomorrow’s and this winter’s events) from when I was a youth growing-up along the Canadian border (and successfully defending it against the insufferably polite hordes of the great white north).  The number of extreme rain events and the three or four 100  year floods (just in the past 15 years)  since I arrived in NH (the 1980’s)was not, for me at least,  definitive evidence of climate change until I saw the data in the larger research context presented by the Piscataqua River Basin report. The more dramatic impacts of climate change won’t occur until after I am gone but the forecasts of the change in my region contained in the report and presentation by Professor Wake make clear to me the importance of action now.  If you get a chance, look at the report or better yet, invite Prof. Wake to make a presentation.  The data and information is great but his ability to present it is even better.

extreme precip forecast

Small Business is Not Booming

March 12, 2013

The National Federation of Independent Businesses just released its monthly report on the condition of  small businesses nationally.  The report is based on a national survey and state-level results are not available.  However you feel about NFIB or their advocacy positions their monthly report is a valuable source of  information about the issues and factors affecting small businesses.

Robust economic growth does not occur unless small businesses are confident, healthy, and hiring.  That seems especially true in NH and is one reason NH’s job growth has been slower than the national average.  I especially pay attention to the headline portion of the NFIB’s monthly survey,  it’s “Small Business Optimism Index”,  because it seems to be a pretty good indicator of near-term job growth in the U.S. and NH.  The simple correlation between the NFIB Small Business Optimism Index (lagged 3 months because it takes some time for optimism/confidence to affect hiring plans) and U.S. Job Growth  is about .68, while the correlation between the NFIB Index and NH employment growth is about .74.   Thus the relationship is slightly stronger between the Index and job growth in NH than it is for the U.S. as a whole.  The NFIB Index inched-up in February, but overall it remains relatively low, suggesting that small businesses aren’t yet ready to provide the boost to hiring that typically occurs in a strong recovery from recession.

NFIB Index and Job Growth


A more troubling indicator of the health of small businesses (and thus hiring plans) comes from the Experian/Moody’s Analytics Small Business Credit Index.  This quarterly assessment of the financial health of small businesses suggests the balance sheets of small businesses (in the aggregate) deteriorated in the fourth quarter of 2012.   According to the quarterly report:

“Delinquent balances rose, pushing the share of delinquent dollars higher to 9.7 percent from the prior quarter’s 9.4 percent. A slowdown in personal income growth led to sluggish retail sales, hurting small-business revenues. Though small firms have worked to trim their labor costs in recent months, sales have fallen more quickly, forcing many small companies to borrow funds to cover their payroll expenses…..The next six to nine months likely will be lean ones for small businesses as rising taxes strain household budgets  and nervous firms of all sizes postpone hiring, thereby stunting the jobs recovery. Consumer sentiment is likely to remain subdued, and spending will be underwhelming, which will keep pressure on small-business balance sheets.”

Experian Moodys  Credit Conditions


Even A Broken Clock is Accurate Twice a Day

March 8, 2013

I am frequently in error but rarely in doubt, so when I am right I have to make sure someone notices.  Good news was reported today  on job growth nationally, as an estimated 236,000 jobs were added across the country in February.   I hate to sound jaded but in each of the prior two years job growth looked to be accelerating early in the year only to experience a significant mid-year  slump.  For now, however,  it is a positive sign.  I have been especially and uncharacteristically gloomy in my characterization of NH’s economy but there was some little reported good news on that front released last week.  The annual benchmark employment revisions showed that NH has 9,600 more jobs than originally estimated.  I won’t get into why the revisions are necessary and can result in some significant changes in the numbers  but in my very first post in this blog back in October I highlighted the disconnect between the volume of  help-wanted advertising in NH and estimates of job growth in the state.

“In the first ever Trend Lines blog post I begin by asking a basic question:  Could the most recent job growth picture in NH be distorted by numbers that will later be revised?”

I also suggested that growth trends in reported wages and salaries  in the state were also inconsistent with estimated job growth trends. In that post and in subsequent  posts (here and here) and others as well, I talked about a potential “skills gap” as a contributor to the disconnect between help-wanted ads and NH’s reported job growth.  I think a “skills gap” is a contributing factor  but as I argued in my first and subsequent  posts –  my money is on job growth being revised upward.  It is nice to be right but it really doesn’t change the overall theme of NH’s economy- that it continues to under perform relative to states it typically outperforms.  That was also predictable:

“…that the jobs data is wrong and will be revised upward early next year, is real,  but that doesn’t mean the revisions will show NH is again outperforming its neighbors or the nation.  It just means we will look less bad over the past year or so than we do right now.”

Five months later I think that still  sums-up my feelings about the revisions, its good to know we have more jobs but we are still in a growth mode that is too slow.  With the revised job numbers for NH the relationship between help-wanted advertising and reported job growth looks more appropriate.

NH Revised Emp

The revised job numbers also are more consistent with PolEcon’s NH Leading Index which had been signalling stronger employment growth in NH than was first reported.  The revised job numbers are more consistent with the signals provided by the Leading Index.   That may not mean much to anyone but to me it means I won’t have to spend a lot of time re-calibrating the Index and that means a more enjoyable weekend.  Enjoy yours.

Leading index and revised emp

Betting on Gambling Assumptions

March 5, 2013

The gambling debate in NH is as hot as it has ever been as the NH Senate just passed a casino gambling bill.  Since I have no dog in the fight (or more appropriate to the debate – no pony in the race) I’ll use this blog to add my $.02.   I think the issue will be decided largely on the basis of something other than the impact casino gambling would  have on state revenues, but to the extent that fiscal impacts are a part of  policymaker’s decision process I’d like to see them have access to the best information and tools with which to make their decision.   Public policy analysis is not physics, there aren’t formulas with constants that govern  behaviors today the same way they did one million years ago.   Policy research is mostly social science that relies on a combination of disciplines like economics, sociology, and demography, and others.  The goal of policy analysis isn’t to prove anything or have something published in an academic journal (a fact usually lost on academics)  it is to improve the information in the debate and to marginally improve the decision-making process.  Policy research is best when it not only provides information, but also when it increases policy maker’s understanding of the issue and how even small changes in policy proposals might affect the ultimate impact of a proposal.   A lot of lobbyists want to provide the one “answer” to what will be the impact of this or that proposal or what will be its fiscal costs or benefits.  A lot of lawmakers want a single “point estimate” of impacts as well, when in fact there is always a range of likely impacts (some more likely than others) and usually they depend on a set of assumptions.   I’ve done a lot of policy research and I never assume anyone will agree with any of the assumptions I include in my policy models so I always design them for policy makers to insert their own assumptions in order to calculate the impacts of policy proposals.  That both increases the confidence policy makers have in their decision-making by helping them understand the sensitivities of estimates to different assumptions and the key determinants or levers that produce different impacts, and it reduces concerns that my analyses are using unrealistic assumption or “cooking” the numbers.  But what it really does is provide a ‘tool” for policy makers to use rather than giving them my “answer” to any policy question.  I usually do have my preferred answer but it doesn’t do any good unless lawmakers can see that it isn’t just “my preferred answer” bu the result of some pretty sound empirical analysis, even when it can be interpreted differently.  Invariably I offer to make my models available to policy makers but to date at least, only a few have every taken my up on it.

With that long preface I’d like to suggest that all sides of the gambling debate make their models and assumptions available and allow policy makers to get a better understanding of the sensitivities of their estimates to different assumptions.  My friend Dennis Delay at the NH Center for Public Policy Studies  is about the best there is at shooting straight and trying to develop the best estimates possible but while he does the analysis I don’t think he does all of the report writing so I would like to see more attention in their analysis of gambling to demonstrating likely impacts under a range of assumptions because it seems that not everyone agrees with theirs.  I haven’t seen any detailed analyses by gambling proponents and think they need to provide their assumptions and models for estimating revenues and impacts as well if they want lawmakers to adopt their proposals (they may have done this I just haven’t seen any analysis).

To demonstrate how important assumptions are in estimating revenues I developed a small model of gambling revenue in NH (not including any social costs).  The model results presented below assume one casino in Southern NH with 5,000 slot machines (or video lottery terminals) but any number of slots can be entered as a variable.  The base for state revenues (on which a state tax would be applied) is estimated using  per slot machine revenue data from Connecticut Casinos for the most recent year (2012).  This seems like the most similar market but again, a different per slot figure can be entered into the model to yield different results.  In addition, different tax rates and different impacts from Massachusetts casinos can be entered into the model.  I’m not trying to estimate revenues here but I am trying to highlight just how important model assumptions can be in determining fiscal impacts and until all sides show how their estimates are affected by their assumptions I think it is hard for lawmakers to make reasoned decisions based on fiscal impacts.  As the chart below shows, estimated state revenues vary greatly when even a few assumptions change.  The “Y” or left, vertical  axis shows estimated state revenues, and the “X”  or bottom, horizontal axis shows increasing tax rates from left to right.  Each colored line on the graph shows estimated state revenue at each tax rate and each  colored line represents a different assumption about the impact on revenues depending on how much casinos in Massachusetts affect casino revenues in NH.

Sensitivity of Revenue Estimates

Finally, I would like someone to articulate and provide some data on how  casinos in NH would perform in a competitive market depending on the type of experience they provide.  That seems to me to be a question best answered by the industry.  I think it is important in understanding the impacts of an increasingly competitive gambling market and the data I have looked at suggest that, at least in Nevada (see below), casinos have derived an increasing share of their revenues from rooms, meals, beverages, retail and shows.  Entertainment seems to play a larger role in the business models of casinos in that state and I wonder if that will be true in NH or in Massachusetts and what are the implications if it isn’t in either, both, or if it is in just one state.

Sources of Casino Revenue

Educational Attainment, Economic Prosperity and Fiscal Reality

March 4, 2013

I write and speak a lot about the importance of demographics to community and regional prosperity.  Over the past several years I have written and spoken about my belief that communities wanting to increase the number and quality of employment opportunities available in their town increasingly need to recognize the importance of being an attractive place for skilled individuals with higher levels of educational attainment.  Employers in emerging and growing industries  locate in areas where the pool of talent (skilled, well-educated individuals) is “deep” or growing.   A community can still see employment growth even if it doesn’t have a lot of skilled, well-educated individuals if it is located in a region that does have enough of them but the impact on and benefits to the community will be very different.

It is hard to empirically test the importance of skill levels and educational attainment to job growth in individual communities but anyone involved with the location and expansion decisions of employers knows how important the availability of a skilled and educated labor force is.  Because the occupational needs of employers in different industries varies greatly, I, and others, often use the percentage of the population age 25+ with at least a bachelor’s degree as a surrogate for trends in the education and skill-level of the workforce in a community or region. It’s a good way to labelled an elitist, at least by those who don’t know anything about you.  I don’t think only college graduates can get good jobs but it is clear to me that trends in the educational attainment of the population of cities and towns is a pretty good indicator of how the economic fortunes of a community are changing. I’ve tested the relationship statistically and found that there is a  relationship between the change in the percentage of individuals age 25+ with at least a BA degree in a community and employment growth over the past decade.  There are a lot of factors that influence employment growth but over past decade communities that have had larger increases in the percentage of individuals with high levels of educational attainment generally have had better job growth (or at least less negative growth).  The relationship narrowly missed statistical significance when tested on NH’s 40 most populated communities.  Since the recession in the early 2000’s, there has been virtually no private sector job growth in NH (primarily because the last “‘great recession” wiped-out gains from the middle of the decade).  The chart below crudely divides NH’s larger communities into quartiles according to the change between 2000 and 2010 in the percentage of their population age 25+ that has at least a BA degree and the mean change in private sector employment between 2003 and 2011.  One caveat, the figures for 2010 used to calculate this is based on the three-year average of American Community Survey values and smaller communities have larger margins of error in the survey results.  It is just one of the challenges in documenting the relationship between demographics and economic performance at the community level.  Nevertheless, I think  the data point to a relationship were towns that are seeing increasing levels of educational attainment among their population are performing better economically than than those that are seeing less of an increase.

job growth and ed attainment change

It also says a lot about how the character of a community might be changing.  I live in city that has seen a significant increase in the percentage of its population with a BA degree or higher over the past two decades.  That change has contributed to changing expectations of the community (the type of services and amenities it offers).  That type of change creates a clash between the old and new that has and continues to characterize many communities.  In many ways I believe local tax cap debates are more about demographic and socioeconomic changes than they are about economics and fiscal policies.  But I digress.

Skilled individuals with higher levels of educational attainment have the most economic opportunities and they are the most mobile.  I think keeping and attracting skilled individuals with higher levels of educational attainment is an increasingly important economic development strategy for communities.  Looking at changes in educational attainment between 2000 and 2010 among NH’s largest communities shows some interesting patterns.  Not surprisingly, some of the communities that have done the most to restrain expenditures have seen the smallest increases in educational attainment levels (some towns like Durham had such high levels – 77%  – they have no way to increase much).

ed attainment change by town

Spending liberally is never a good thing but providing the services and amenities desired by skilled and educated individuals and families at a price (in terms of local taxes) lower than other communities is a good way to accumulate the talented workforce that can increase real prosperity in a community.  Just adding skilled and educated individuals isn’t enough for employment growth, particularly if a community doesn’t want to be a center of employment or is otherwise inhospitable to employment growth.   I don’t think a low tax price alone is enough to attract talent and I don’t think providing amenities and services without regard to price is enough either, but too often never the twain shall meet in striking a balance between prices and  services and amenities and longer-term community development objectives.  I don’t know many local budgets that can’t be cut but unfortunately the cuts usually come at the expense of those services and amenities most likely to help a community attract or retain individuals with the most economic opportunities and choices of where to locate.  When I say or write these things I risk being labeled a big spender or liberal.  In reality I am just documenting trends that seem pretty clear to me.  Nevertheless, my advice to others is never bring data to an ideological fight if you want to escape unscathed.  In an age of austerity, spending decisions need to consider both the current  fiscal reality as well as the longer-term implications for the economic prospects  of  a community.

Where Never is Heard a Discouraging Word

February 27, 2013

Without an accurate assessment of where you are you can’t chart a course to get to where you want to be.   In the context of efforts to strengthen regional and state economies, however,  plotting your coordinates seems especially difficult.   For decades New Hampshire (including me) has become accustomed to hearing that its economy is “doing better than most other states”  and that we can expect to grow faster than a majority of states and all other states in the Northeast.  I have blogged here several times about how that is not currently the case but because about five people read this blog there isn’t much fallout.  But  when someone like me suggests, in a public forum,  that NH is lagging and that superior growth is not currently the case for the state, you can expect some incredulity and push back.

State 12 Month Job Growth

When you speak in a community and present lots of data that suggests it is lagging even more, then you can expect the push back to more likely come with a closed fist.  And when that community is close to where you live, well  it’s probably best to get an unlisted phone number.  I’m no prophet but if I were I  think it would  probably be impossible to be one in your own land.  I like to be the bearer of good news but when the data doesn’t suggest good news is warranted I don’t change the data or the news about it that I bring.  Long ago I learned that being right too early will feel a lot like being wrong.  I don’t know who was more offended by my presentation yesterday at a local chamber of commerce, people who feel I know nothing about their community, the people who think I know nothing about New Hampshire, the people who think I don’t understand the U.S. economy, or the people who think I know nothing about any of these.   An informal tally to-date suggests about an even split.

I am not a twitter user or follower, I am only marginally able to follow my own thoughts and activities throughout the day, but if I were and if I were able to expand the size of a tweet, this is how it would summarize my remarks at the chamber forum:

Economic growth is increasingly associated with concentrations of skilled, well-educated individuals and any state’s, region’s, or community’s longer-term prosperity is likely to be correlated with its ability to attract and retain these individuals.  The ability to keep and attract this demographic is as much a requisite for job growth as it is a result so any region’s development strategy should attend to its capacity to appeal to this  demographic and look to leverage the associated economic benefits .  Understanding the direction of these trends in your community or region, likely tells a lot about recent and future economic performance.

If you happen to discover oil or shale gas under your state or community that tweet applies a lot less.  In addition, small communities can see strong growth from just one or two businesses, but with some exceptions and over the longer-term,  I think the summary holds true.   I am a first generation college graduate and my beginning, and likely my ending, doesn’t warrant even a whiff of elitism of any sort.  But making an association between educational attainment and economic growth apparently implies a disparaging of those who are not college graduates, just as the notion that NH’s economy is growing more slowly than some of the states that we are accustomed to regularly outperforming apparently implies an indictment of “the NH way” compared to to other states.

One or two years of weaker economic growth is not a signal of apocalypse, but its not a bad idea to wonder if it is and to consider ways to avoid it.   For me, the apocalyptic story  for NH would be that, over the longer-term, we become a slow employment growth state that is also a higher cost-of-living state.

State Cost of Living

High costs and slow employment growth have characterized too many states in the Northeast as well as California and they have all suffered as a result.  But at least in California you still have nice weather.

Tilting at Windmills?

February 11, 2013

“Do you see over yonder, friend Sancho, thirty or forty hulking giants? I intend to do battle with them and slay them. With their spoils we shall begin to be rich for this is a righteous war and the removal of so foul a brood from off the face of the earth is a service God will bless.”     

Don Quixote

I hope I am not, but I probably am, the only person that sees the irony in the fact that the latest wind farm battle in New Hampshire involves a Spanish developer of wind farms (Iberdrola Renewables).   The proposed wind farm near Newfound Lake has many of the residents in that area concerned about the visual and noise impacts of the project.  Electricity generation from wind has grown significantly throughout the country over the past several years and along with this growth has come a concomitant increase in opposition to the projects.

Wind generators accounted for a significant portion of capacity additions since 2007 (see chart below), and were the largest source for generating capacity additions in 2008 and 2009. If all planned wind generators in 2012 come on-line, as reported by industry participants, wind capacity additions could top 12,000 MW for this year. This would account for 45% of total additions and exceed capacity additions from any other fuel source, including natural gas, which was the leading fuel source for electric generating capacity additions in 2010 and 2011.

additionsbytype

The wind energy production tax credit (PTC), along with state-level policies, has boosted the growth of the U.S. wind industry over the past decade and the anticipated expiration of the PTC at the end of 2012 created a rush to complete projects in 2012.  This tax credit was first implemented in 1992, when the United States had less than 1.5 gigawatts (GW) of installed wind capacity. By the end of 2011, wind capacity stood at more than 45 GW, about 4% of U.S. power generating capacity, and provided 3% of total U.S. electricity generation in 2011.

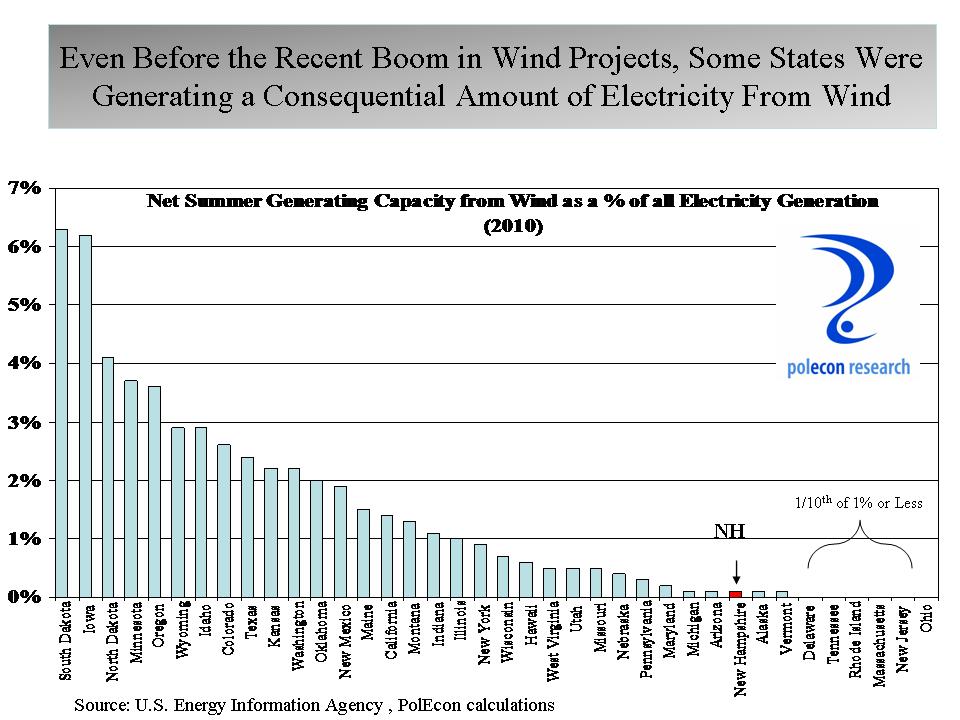
The most recent state level data available on electricity generated from wind (2010) show that less than 1% of NH’s electricity was produced by wind but with recent projects in the state that figure is outdated.

Wind Generation by state

I don’t know what the future of wind power is in New Hampshire.  I have no professional or business stake in the issue. Like everywhere, aesthetic issues and local opposition will play a prominent role in determining its growth but there are other issues that must be considered if policymakers are to make reasoned decisions about its efficacy in meeting the state’s power needs.  The two most often cited concerns about wind as a source of electricity (besides aesthetic and local opposition) seem to be that turbines are so inefficient that they actually increase carbon dioxide emissions, and that they are so unreliable that they require constant backup from conventional coal and gas-fired generators.  Concerns about increased carbon from wind seem misplaced to me.   As electricity demand increases, say on a weekday morning when people are waking up and getting ready to go to work,  power plants increase output to meet it. Plants with the lowest marginal cost – that is, those that can produce additional electricity most cheaply – are selected first by the market. Here wind beats gas and coal, as no fuel is needed to generate electricity.  So in theory at least,  adding wind power to the energy mix should displace coal and gas, and hence cut carbon.  On the important matter of reliability, the obvious worry is that because the wind does not always blow, the system will sometimes not be able to supply electricity when needed.  This seems like common sense.   But the reliability of wind power does not depend on the variability of wind, it depends on how well changes in wind power output can be anticipated. Forecasts of wind farm output are increasingly accurate, and drops in output can be predicted and compensated for using conventional power stations.

I have driven by wind turbines in several states and am in awe of their size visual impacts.  I don’t know how I would feel about living near them,  but I also can’t ignore that the world (especially in the UK) is increasingly using wind power as a way to limit fossil fuel consumption and carbon emissions.