Archive for the ‘college’ category

Mismeasuring the Burden of Student Loan Debt

October 14, 2015

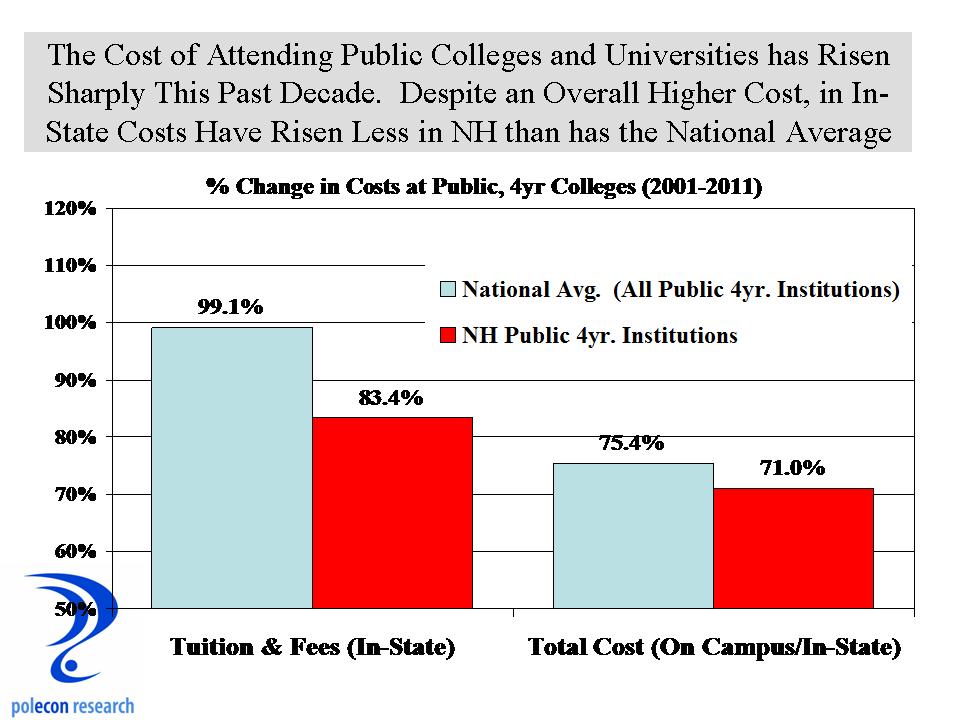
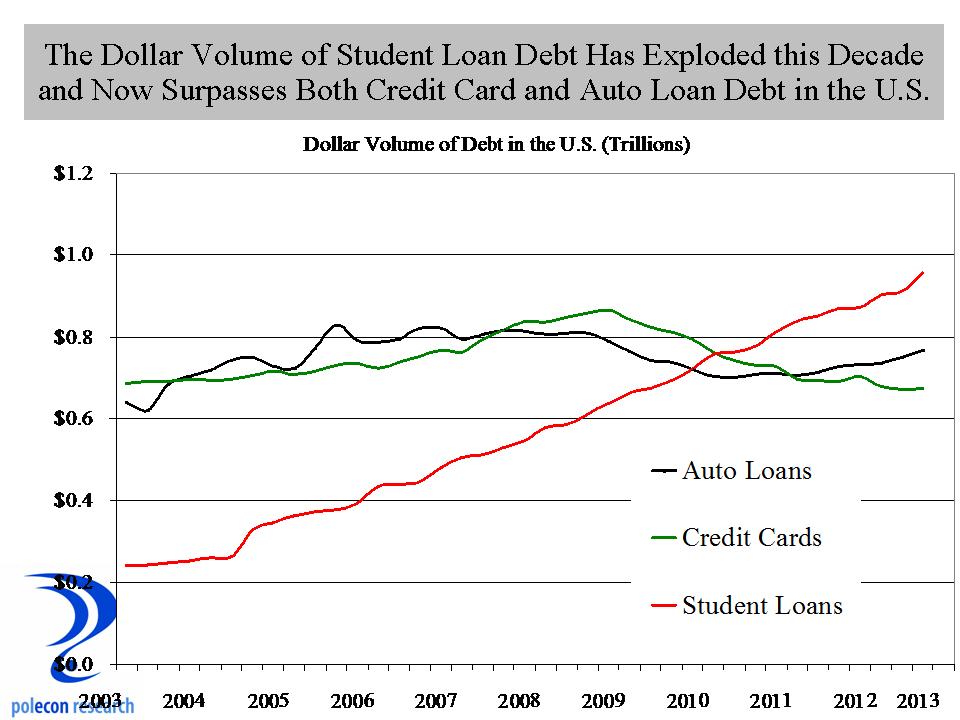
Rising higher education costs along with the volume of outstanding student loans, now in excess of $1.3 trillion nationally and greater than the volume of credit card or motor vehicle loan debt, are prompting  concerns about the impact that student loan debt is having on economic growth. Student loan debt grew at the fastest rates on record during the 2000s, doubling from $600 billion to $1.3 trillion over the past decade. Popular reports annually rank the debt loads of students graduating from colleges and universities in each of the 50 states. New Hampshire, is notable for being at the top of the list as having students graduate with the highest levels of debt in the nation.

debt of grad 2013

But the average debt levels of recent college graduates in any state says little about the impact that student loan debt has on a state’s economy. First, the schools from which students graduate aren’t necessarily the states in which students choose to reside (and repay their debts) after graduation, and second,  reports of the average debt levels of recent graduates provide no information about the outstanding balance of student loan debt (and thus overall student loan debt burden) held by residents of each state. The latter is necessary to understand the impact that student loan debt is having on a state’s economy.  I had not seen data on the balance of student loan debt on a state-by-state basis until a journalist (Ryan Lessard of the Hippo Press here in New Hampshire) passed along data from the U.S. Department of Education that was recently released by the White House. The data includes information on federal student loan debt only, and does not include private student loans or other loans used to pay for college – such as home equity loans taken out by parents, but is still extremely useful in understanding the differential impact of student loan debt in each state. The data present a different view of the student loan debt issue than do the data released annually on the debt of recent college graduates. In this post I add some economic and demographic data to the student loan debt data from the Dept. of Education to examine different measures of the relative burden that student loan debt places on individuals, and thus the economy of each state.

As of January of 2015 there were 212,000 individuals residing in New Hampshire with outstanding federal student loan debts totaling $5.1 billion dollars according to the U.S. Department of Education. The $5.1 billion compares to my estimate of $4.5 to $5.6 billion in credit card debt and $37.8 billion in home mortgage debt in the state.  In contrast to reports showing that the most recent graduates of colleges in NH have the highest student debt levels, the average outstanding loan balance among all of NH’s borrowers (regardless of where or when they graduated), at $24,048, was near the bottom of all states.

outstanding balnace by state

As I documented in a recent study of student debt, New England and the Northeast have the highest college costs in the nation, with graduating student’s debt levels similarly high. So why would NH’s average outstanding student debt balances be among the lowest in the nation? If NH residents with student debt had been paying off those debts for a longer period of time (that is borrowers were longer removed from college i.e. older on average) then their debt levels would be relatively lower even if their original debt levels were higher on average. In addition, if recent grads in NH, and their higher debt levels, leave the state, while somewhat older individuals move into the state, the state would be trading individuals with higher debt levels for those with more modest student debt levels. This seems like a plausible explanation based on some of the analysis of NH’s demographic trends I’ve written about in this blog and elsewhere. In addition, some of the discrepancy results from the new data on total student loan balances by state that includes all debt from students at two and four year colleges, as well as graduates and those with debt but who did not graduate. Thus the data released by the White House is a much more comprehensive measure of student loan debt at the state level. In addition, because it aggregates student loan debt of individuals who reside in each state, it is a more appropriate measure of the burden of student debt on any state’s economy.

Student loan debt is a problem, it has retarded household formation in NH and the U.S. and contributed to a slower than anticipated recovery in the housing market.  It has other negative impacts on younger individuals and families as well, but how large of a burden is student debt on any state’s economy and what is the best metric to assess it? It is not an easy question to answer.  The White House (Dept. of Education) data helps tremendously but analyzing it raises almost as many questions as it answers. The $5.1 billion in federal student loan debt held by borrowers living in NH represents about 7.1 percent of the state’s 2014 gross state product. Using this measure , NH ranks in the middle of all states on student loan debt burden, higher than indicated by the average student loan debt in the state. Because NH has a high percentage of students who have attended (and graduated) from college, even with below average student debt levels among all borrowers, the aggregate debt as a percentage of the state’s economy is higher than in states with lower average levels of debt among borrowers.  States with a high percentage of college attendees and graduates in their populations are likely to have a higher student loan debt to GSP ratio regardless of the average outstanding loan balance of borrowers. But is 7.1 percent a problem for the state’s economy?

debt as a pct of gspI think the student loan debt burden is probably better understood from its impact on individuals.   Only about 20 Percent of the adult population (age 18+) in New Hampshire have student loan debt and the debt has its greatest impact on a subset of the adult population. The typical repayment period of student loan debt is 10 years so, in theory, the population between graduation (or leaving school) and the age of about 35 should be most affected by student loan debt and assessing the impact of student loan debt should focus on impacts among this demographic group. For this analysis I use the characteristics of each state’s population ages 24-34 to assess the relative impacts of student debt on each state. The chart below uses the average outstanding student loan debt in each state and the average annual earnings of residents age 24-34 in each state to calculate how much of the annual earnings of 24-34 year working individuals with at least an associate’s degree go to student loan repayment in each state. Using the average outstanding loan balance in each state and assuming a combined federal subsidized and unsubsidized loan  interest rate of 4.5 percent, on a monthly basis, almost all states have average student loan burdens that require monthly payments of less than $300. The one exception is DC, not presented on the graph, where the $40,000+ average loan balance and $413 monthly payment is attributable to the high percentage of law school and other professional and advanced degree student who reside in the city.

monthly paymentA monthly student loan payment of $300 is not an inconsequential amount but less than most new car loan payments. Still, as a percentage of annual earnings, student debt payments clearly could influence the ability of younger people to purchase a home or make other significant financial commitments.  Combining monthly payments (annualized)  with the average annual earnings of college graduates ages 24-34 living in each state provides a measure of student loan debt service as a percentage of the earnings of graduates in each state.  Again, the chart shows that New Hampshire, along with several other states with both high college costs and high debt, rank relatively lower on repayment as a percentage of annual income.

burdens as a pct of earnings

The examples of several states highlight the importance of different variables in assessing the impact of student debt on any state’s economy.  The average debt of recent graduates from colleges in Vermont is in the middle among all states, yet the average loan balance of all borrowers in the state is higher than the debt levels of recent grads.  As a percentage of the earnings of working college grads ages 24-34, however, student loan debt in Vermont is the highest among all states. This suggests that recent grads (with their moderate level of debt) may be leaving Vermont while the state attracts or retains individuals with higher levels of student debt. It also suggests that the high percentage of the earnings of 24-34 year olds in the state that is absorbed by student loan debt service is, in part, a function of relatively modest average earnings  in the state.

avg debt and pct of earnings scatterplot

Another illustrative example is Georgia, a state with a relatively low average debt among recent graduates from its colleges, but with the highest level of debt among all borrowers of any state. From my limited experience in Atlanta, it is seems the city hasn’t been as overrun with northerners since Sherman’s march to the sea. This time the northerners have come armed with college degrees and promissory notes.  A state with below average student debt among recent graduates from its colleges but with above average student debt among all residents can’t address it’s high student loan debt burden by increasing state support for colleges or by providing more student aid.  Georgia appears to be gaining individuals with higher levels of educational attainment (“talent”) at a cost of higher student debt levels and greater debt burden among its residents. That is not a bad tradeoff as the state gets a more skilled workforce at a low cost to state government. Georgia reinforces a point that I repeatedly make, the importance of being attractive to skilled individuals with higher levels of educational attainment. NH makes this point as well, it has the highest average debt levels of recent graduates but relatively low average student debt for all borrowers in the state. We know NH losses a lot of its recent graduates to other states as I have documented in this blog and elsewhere, but attracts a lot of college graduates from other states, especially in the 25-40 age range.  These individuals, if they have student loan debt, have likely paid-off a good portion of it.  NH too has upgraded the skill of its labor force at a relatively low public cost by importing or attracting talent from other states.

New Hampshire, Vermont and Georgia are just three of many examples of how the debt levels of recent college graduates in a state must be interpreted with caution and in particular, when debating state-level policies directed at rising student debt levels. This brief analysis suggests different ways to assess the burden that student loan debt places on the residents of any state as well as on a state’s economy and shows that those burdens cannot be simply assessed by the most common assessment, looking at the average debt of recent college graduates. Reports on the average student loan debt of recent graduates by state can be an especially misleading indicator of the burden student loan debt places on any state’s economy.  I am not arguing here that student loan debt is not a problem, but like most public policy issues it is subject to errors of popular sentiment and conventional wisdom that can distort decision-making by policymakers. My purpose in this post is to explore some alternative measures (other than the average debt of recent graduates) of the impact that student loan debt has on each state’s economy. I welcome suggestions for better measures or criticisms of the ones examined or the methodology in this post.

“…..No Fury Like the Middle and Upper Classes Scorned”

November 1, 2013

College students rage against  a lot of things (including their parents as I have learned) but tend not to channel that energy into exercising  their right of franchise.   I think that helps explain why, after decades of rapidly rising college costs and levels of student debt, the tipping point on the issue appears to have finally been reached.   As I noted in a recent study on student debt, one of the features today that distinguishes debt to pay for higher education from prior periods when the issue bubbled to the surface is how much more of the debt appears to be being borne by parents as well as students.  Parent debt is not included in the popularly reported student loan debt by college or by state, but as the chart below shows, along with unsubsidized federal loans to students, federal parent “PLUS Loans”   have been the second fastest growing category of student debt.

Growth in Student Loans by Type

PLUS Loans are still a much smaller category of debt for higher education than are loans to students but there is no data available on the non-federal loans parents have accumulated (such things as home equity loans) to pay for their children’s education so overall parent debt has likely increased even more .  It is much easier to avoid the public debate about debt for higher education when it affects just students than it is to avoid when  it affects parents as well ( whom lawmakers are much more likely to respond to as constituents).  Another troubling aspect of the chart above is the increase in federal unsubsidized student debt.  Because the interest on this debt is not paid for by the federal government while a student is in college (unlike subsidized debt), it is more costly, and thus the higher percentage of unsubsidized debt today than a decade ago suggests that student debt levels actually understate the impact on students of the increase in student debt since 2001.

Examining data from the Federal Reserve Board’s “Survey of Consumer Finances” highlights how debt for higher education has increased over 20 years as a percentage of household’s non-mortgage debt, with the biggest increases coming since the mid 2000s.

H Installment Debt by Purpose

The chart above reflects both parent and student debt.  More of household installment debt going to pay for education implies less borrowing (and spending) for other purposes and helps explain (along with generally weaker economic conditions during much of the 2000s) why consumer expenditures on other goods have been relatively weak.  The economic implications of student debt are typically seen as constraining recent graduates spending, household formation, home buying, entrepreneurship, etc., but the reality is that student debt is likely constraining more than just recent graduates.  I think some evidence of this is seen in the changes in installment debt of households by income (chart below) .

Installment debt by income

As the chart  shows, the largest increases in  the percentage of installment debt that goes for education are among middle and higher income groups.  These are income groups with the most disposable income and anything that constrains them from “disposing” of their income (like repaying debt for higher education) on goods and services that boost economic activity will have detrimental impacts on the economy.  Lower income groups have seen significant increases in installment debt for education as well, much of it attributable to increased enrollment rates over the past few decades which have been highest among students from lower-income households.  With more students from families with modest incomes attending college, the share of installment debt for education among these income groups can be expected to rise.  Higher college costs also play a role but increases in financial aid for lower-income students have helped offset some but certainly not all of those cost increases.   In no way do I want to minimize the impact of college costs and debt on lower-income students and households but that has been a fairly consistent problem that does not distinguish the current situation from the past the way changes in debt among higher income groups appears to have changed.

The large increase in the percentage of installment debt that goes to education among middle and higher income groups reflects economic conditions (savings for education dropped the most among these income groups over the past decade) but also financial aid policies and practices of governments and colleges that appear to especially squeeze middle-income households.

The rapidly rising debt for education held by parents and households, not just students, I think explains a lot about the new urgency to address college costs and student debt.  The fact that middle and higher income groups seem more affected by these pressures than in the past may say even more about why the issue has risen on the public agenda.  Beyond the political, when the households that typically have the most disposable income appear to be especially affected by higher education debt, we should not discount the role debt for higher education may be playing in constraining economic activity in the U.S.

Competition Raises Rather Than Lowers College Costs

October 9, 2013

I’ve written about student loan debt and college costs in the past.  A report I recently completed on the issue was released earlier this week, you can read it here .  It is long and detailed so even if your aren’t that interested in the topic it is an effective substitute for a strong drink or a mild sedative as a sleep aid.

The report didn’t get a lot of media coverage and in any case it is difficult for media coverage to capture more than a few highlights of a long study that deals with complicated issues (although Kevin Landrigan at the Nashua Telegraph did his usual good job, as did Kathleen Ronayne at the Concord Monitor).  One small portion of the study that I think is interesting and important examines the issue of competition in higher education as a contributor to higher tuition levels.  Colleges in New England and the Northeast have higher tuition prices on average than colleges with similar characteristics (public, private, selectivity, state support, etc.) located elsewhere in the country.  No doubt the region has some of the finest higher education in the country but not every institution in the region is world-class with an ability to charge a premium for educating students.  I thought state-level differences in cost-of-living would account for some of New England’s and the Northeast’s higher tuition prices but multivariate (regression) models using data from about 700 four-year colleges and universities across the country failed to demonstrate that cost-of-living differences were significantly related to differences in tuition prices among universities with similar characteristics but in different regions of the country.

Tuition FactorsOne characteristic of higher education in New England and the Northeast that distinguishes them from other regions of the country is how many colleges and universities are located here.   It is possible that increased competition for students and for faculty could increase college costs in New England and elsewhere.   To date, few colleges and universities have been willing to compete on price.    Colleges generally compete by offering more and better faculty, facilities, student services, and amenities. Colleges want to be the best they can be and they compete for students, for faculty, and with businesses for talent (PhD’s in fields in demand). This is especially true in a region like New England where there is a high concentration of higher education institutions and where there is a large base of technology, business, and professional employment that is more likely to employ individuals with advanced degrees and to compete with colleges for available “talent”.

To test the degree to which competition among colleges might influence regional college costs and prices, I had to develop a meaningful measure of competition among colleges. The study operationally defined the level of competition among colleges in each region as the percentage of regional employment that is employed in higher education.  Specifically, I calculated a “location quotient” for higher education employment in each state and averaged the location quotients for each state in a region to arrive at regional location quotients for nine census divisions (regions).  This measure roughly approximates the degree of choice students in each region have regarding college enrollment.  The figure below highlights regional differences in the concentration of higher education employment.  I won’t get into a discussion of location quotients (LQ) but a LQ of greater than 1 for a service industry indicates it is serving more than local markets and is also “exporting” its services.  We know colleges in New England attract student  nationally and internationally.  The darker regions of the country are where there is a greater concentration of higher education employment (and thus the potential for competition among them).

Higher Ed Emp Concentrations

Testing the impact of the LQ measure of regional competition on tuition and fee levels shows the variable to be significantly related to tuition levels at both public and private colleges, with regional location quotients showing a larger impact on tuition and fees at private colleges than at public colleges (implying that competition for students at private colleges has a greater impact on prices than it does at public colleges) .  The elasticity of tuition and fees with respect to our measure of competition was small (.10) at private colleges, and even smaller (.076) at public colleges. However, as the chart below shows, the magnitude of the difference between higher education employment in New England and other regions is great (indicating much higher levels of competition among colleges in the New England region), so this small elasticity still implies that competition has a relatively large impact on tuition and fees at colleges in New England.

Higher Ed Location QuotientsAs an example, New England’s location quotient of 2.35 is about 140 percent larger than is the location quotient (or concentration of higher education employment) in the South Atlantic region. The elasticity of tuition and fees at private colleges with respect to this measure of competition suggests that for every 10 percent increase in higher education competition in a region, tuition and fees will be one percent (1%) higher. Thus the 140 percent difference in higher education competition in New England compared to the South Atlantic region implies that all else equal, we can expect tuition and fees at private colleges in New England to be 14 percent higher than in the South Atlantic region.  For public colleges, with a smaller elasticity of tuition and fees with respect to competition, these results imply that tuition and fees would be about 10 percent higher in New England as a result of higher levels of competition among colleges in the region.

I think these findings have important implications for tuition prices, student debt, and higher education in New Hampshire and New England and their economies.  The biggest reason student debt levels are so high in New Hampshire is the fact that the primary strategy used by families for reducing the cost of college and for limiting student debt is attending a lower cost, in-state, public institution.  Over the past decade more New Hampshire families have attempted that and with little success because of the high cost of attendance at New Hampshire’s public colleges and the low levels of grant aid awarded by them.  State aid plays an important role in tuition prices at public colleges (just as endowments do at private colleges) and has a big impact on NH’s prices but even accounting for differences in state aid, competition for students and faculty appears to be contributing to higher tuition prices among  public (and private) colleges in the region.

Like all of us colleges want to be the best they can be and they compete with other colleges on national and regional rankings to prove it.  A sad byproduct of that is that most rankings count per student spending heavily in their assessments so that any college that can offer as good or better educational services while restraining expenses will suffer in national rankings.  It is important for public institutions to remain a key strategy for families in limiting the cost of college and student debt.  It is probably more important now than national rankings and competing for a shrinking population of college age students.

Competition is a wonderful thing and it is addicting (I know –  it is my drug of choice).  I am a believer in markets and I believe that the market for higher education is changing and will result in more price competition among private and hopefully public institutions. The competition won’t be on price exactly,  it will be based on “value” not just price (it won’t do anyone any good to say I got the “cheapest” education unless the result of that education is greater opportunity for success in the labor market and in life).  Competition among public colleges and public colleges with private colleges could accelerate market-based changes  in higher education by focusing on value, not on facilities, amenities, high-profile faculty or programs, or whatever basis colleges typically compete on.  Given the fiscal realities of states, colleges will not be able to compete with private institutions by spending more to be the best.  When you can’t effectively compete on one field you are wise to move the competition to one more favorable to your chances of success.  Public colleges can do that and parents and families in New Hampshire and New England looking to limit college costs and debt would be winners if they did.

Is Your State Overrated?

May 24, 2013

My penance (and your burden) for being an absent blogger over the past week or so is a longer post with extra graphics today.

A lot of people, including me, are accustomed to assessing the overall skill level of a state’s or a region’s workforce (and thus its potential to capture growing industries that rely on more highly educated workers) based largely on the percentage of the workforce with a college degree.  It is simple, intuitive,  and more than a  little lazy.  It is also becoming a  less useful indicator of the supply of labor that is in demand by businesses.   Populations with higher levels of educational attainment confer a lot of benefits on a state or region but today, having a high percentage of a state’s or region’s population with at least a BA degree probably says as much about the state’s political and cultural sensibilities (as well is its “demand” for services rather than its “need” for services but that is another post)  than it does about its economic performance and potential.

The sense of self-satisfaction we in New England and in New Hampshire enjoy about  having a population with among the highest levels of educational attainment in the country is palpable, but the reality is that more states are increasing their levels of educational attainment and New England and the Northeast stand-out far less than in the past.  Moreover, in an economy that is increasingly rewarding particular skills and degrees more  than  just high educational attainment, it is not as clear that much of the region still has an edge  on the one resource that  it has that is always in demand – talent.

Much of New England and the Northeast has a high percentage of its adult population with a four-year college degree or higher (see chart below).

% With BA or Higher

Just looking at levels of educational attainment tells only part of the story.  I can’t blog for too long without talking about the “skills-gap”  so here goes.  Much of the demand for college-trained labor is in fields that require scientific, technical, engineering,  or mathematical (STEM) skills and degrees.  The percentage of a state’s population with a BA or higher degree tells a lot about the availability of STEM skills but for a number of states it tells a lot less.  I calculated the percentage of a state’s population with a STEM degree (based on first college degree earned) and included it above as the dark blue portion of the bar graph.  The official listing of STEM fields is maintained, surprisingly, by the Dept. of Homeland Security ( I categorized 171 college degrees into STEM and non-STEM degrees and I think my listing is close but not a perfect match).  If you compare  the percentage of the population with a four-year or higher STEM degree (chart below) with the percentage of the population with a BA degree or higher (chart above) it shows a large change in the relative rankings of a number of states, and a some in New England in particular.

% with STEM degrees

The final chart makes just that comparison, it shows the change in ranking  between a state’s position on the percentage of its adult working population with at least a BA degree and the percentage of its population with a STEM degree.  The chart highlights states that may be over and underrated on the skill level (at least skills in demand) of their workforce.   Vermont stands out as having the biggest drop in rankings between the percentage of its population with at least a BA degree and its ranking on the percentage of the population with a STEM degree.  Maine also fares poorly.  But New Hampshire, Rhode Island, and Connecticut also drop in rankings when measuring “talent in-demand” among the workforce.  Only Massachusetts does not  drop in ranking  ( it is ranked number one on both measures so there is no way it could show anything but a drop in relative rankings).   On the other hand, states that are often derided by Northeastern “elites”, such as Texas, Arizona, Florida and Alabama  have a smaller percentage of college-trained labor but more of them (on a percentage basis) are trained in the STEM fields most in demand.  Still, they  don’t have as high a percentage of their adult populations with a STEM degree as do some New England and some other states, but with population and migration trends, and as more individuals with those skills and more companies that want access to them agglomerate in those states, how long before some take the lead in “talent”?   I don’t think Massachusetts has as much to worry about as do other states in  New England because of their unique higher-education assets.  The question for the rest of us is, can we continue to “beggar our neighbor” and benefit from the Bay State’s ability to churn-out and attract individuals with the degrees and skills in demand?

over and under rated states

As New Jersey, New York, and Connecticut show, having a lot of “talent” in your workforce doesn’t guarantee strong economic growth.  The business, political, environmental, and even cultural and social climates also play an important role in promoting prosperity.  I look at states with a relatively higher  percentage of their college trained workforces  in STEM fields as “up-and-comers.”   Most don’t have the history of high educational attainment in their populations that New England does, so their overall ranking on educational attainment tends to be lower.  Some, like Texas and Arizona also have had a large influx of individuals with traditionally lower levels of educational attainment.  Nevertheless, they are accumulating and growing a larger portion of the nation’s “talent” in STEM fields and over the long-haul, that is the biggest threat to New England’s most valuable and most in-demand resource, and thus the biggest threat to its prosperity.

There’s No Place Like Home (Your Home State)

April 29, 2013

I was surprised by data on the enrollment migration of high school graduates who enter  four-year colleges immediately or shortly after graduation from high school.   As the chart below shows, in most states, a very high percentage of students enrolling in four-year colleges enroll in a school in their home state.

Student Migration

This would not be  unexpected if it were data from 1920 but a lot has changed in the world that should exert a fairly strong influence on the enrollment decisions of high school graduates.  First, anything that reduces the time, cost, or difficulty in travel should contribute to an increase in the willingness of students to travel further to attend college.  The real cost of travel (measured as dollar per airline mile) has fallen dramatically over the past several decades.  In addition, the increased ability to communicate over longer distances and at ever lower prices should also reduce disincentives to enrollment over distances.  Perhaps even more importantly, the information available to students and their parents about schools (including video tours, rankings, and all types of detailed data), should also reduce the barrier of distance from home  to enrollment in a college.   In addition, colleges have more information about students and an increasing ability to target potential students irrespective of their distance from campus.  States with a low percentage of students enrolling in a college in their homes state (NH, VT, CT, MD, DE) all have many college choices in nearby states so many of the barriers that might influence enrollment distance don’t really apply.

We in NH fret a lot about the percentage of students who choose to enroll in an out-of-state college, but almost 90 percent of NH grads enrolling in a four-year institution enroll in a college in New England and on balance we are a slight “net-importer” of college enrollees.   There are tremendous economic and public policy implications related to the supply of young college graduates but we need to be careful that in analyzing the issues we use appropriate metrics.  I am not convinced that in NH’s case, the percentage of students enrolling in-state is a good one.

I need to look at a time series of this data to get a better handle on some of the contributing factors to these data.  For now the only conclusion I can draw is that college-age children simply care too much about their families to want to venture far from home – at least that is want I have wanted to believe for the past several years.

The Coming Matriarchy in the U.S.

February 12, 2013

I received a great comment/question  about my post “Why Can’t a Man Graduate More Like a Women” asking about the potential impact of Title IX on the rise in the percentage of female college graduates relative to male college graduates.  I didn’t have a good answer or much empirical evidence then but as is my custom I responded as if I did.

Title IX is most often identified with efforts to equalize opportunities to participate in intercollegiate sports for women but its real purpose was to prevent discrimination in education based on sex.  Title IX is a portion of the Education Amendments of 1972 and is also known as the Equal Opportunity in Education Act, it said:

No person in the United States shall, on the basis of sex, be excluded from participation in, be denied the benefits of, or be subjected to discrimination under any education program or activity receiving federal financial assistance…

Rules for its implementation were finalized in 1975 and since it was implemented the number of young women attending college on a full or part-time basis has increased by 138% compared to 47% for young men.

Male Female Enrollment Growth

Since the percentage of young women and young men hasn’t changed much since 1975, the differential growth rate is attributable to increasing enrollment rates for women.   I can’t say  how much of this is attributable to Title IX, a lot of things began to change for young women in the 1970s and female enrollments jumped between 1970 and 1975 as well (see chart below).

Male_Female Pct of Enrollment

Women now comprise about 57 percent of all undergraduate students in this country.  The growth trend seems to have stabilized somewhat in recent years – recessions tend to limit employment opportunities for young men more than for young women and this can prompt greater college enrollment among young men.

Male_female Unemployment Rates

A lot of progress has been made by women in this country since 1975 but it is hard not to see the association between the growth in female college enrollment and implementation of Title IX.  I am sure some readers will note Title IX’s shortcomings and more may object on principle to anything that seeks to equalize opportunities among our citizens.  But ideology often causes temporary or permanent blindness.  I’ve noted my interest in gender issues as the father of daughters and I blog frequently about gender and economics (select  the “gender” category to see some) but the issue has profound implications for the future of this country;  economic, political, as well as social.  Women are increasingly contributing to the quality of  “human capital” in this country.  There are now more women working in New Hampshire than men.  It is a great development that would be even greater absent the disturbing trends among young men.

From a political perspective (isn’t everything political these days?) the feminization of the workforce as I have called it (not pejoratively) along with the relationship between educational attainment (college graduates) and voting for Democratic candidates should prompt leaders of the Republican Party in this country to consider their relatively lack of appeal to women, especially younger women because as I see it, and as my daughters no doubt hope, it won’t be long before women will rule this country.

The Surest Way to Limit the Cost of College is to Graduate on Time

February 5, 2013

Since my last post on the potential for a student debt crisis I’ve been asked several questions about what is happening in New Hampshire.  I can’t adequately answer those questions here but since it is being reported that the University System of NH is holding-off setting tuition rates until the next state budget is clearer, I thought I would take a quick look at one college cost trend in NH along with what I think is one important metric when considering the cost of college.

It is not an epiphany that the cost of college is rising faster than the cost of most goods and services and it is generally recognized that the cost of college at NH’s public higher education institutions is higher than the national average.  What is surprising is that over the past decade, costs at NH’s public 4 year  institutions have risen less than the national average.  I am not saying that they haven’t risen well above a comfortable rate, just that given the constraints of state support, tuition and fees, as well as total costs for in-state undergraduate students  at NH’s public colleges have risen more slowly than the national average.

Rise in Cost of Public Colleges

It sure didn’t feel that way over the past several years as I have had the pleasure of sending two children to different public universities identified as having among the highest costs of any public universities in the nation (UVM and UNH).  But a lower annual cost doesn’t mean as much if it takes more years for a student to graduate.  Fortunately a higher percentage of students graduate within 150% of “normal time”  at NH’s (and VT’s) public 4 year colleges than they do nationally (see chart below).  So far my students are 2 for 2 in graduating on-time and the next one is in the batters box in North Carolina, what are the chance that we can bat 1000?

Graduates within 6 years

The Looming Crisis in Student Debt

February 1, 2013

Student loan debt has grown much faster than other types of debt.  As the chart below shows, student loan debt has been exploding  and now exceeds both credit card and auto loan debt in the country.

Student debt volume

According to a recent study by Fair Issac Inc. (FICO), newer vintage loans have a much higher risk of default.  Higher debt loads for graduates and non-graduates have combined with protracted weakness in the labor market (especially for recent graduates) to produce a dramatic increase in the volume of  delinquent student loans.  Although the volume of student loan debt has never been close to the volume of mortgage debt in this country (mortgage debt peaked at about $9.3 trillion in 2008 while student loan debt is just now reaching $1 trillion), there is still the potential for rising defaults to have significant impacts on many financial institutions, if not the system as a whole.  The percentage of student loans that are seriously delinquent is currently twice as high as the percentage of mortgage loans that are seriously delinquent.  Despite student loans being a much smaller overall volume of debt than mortgages, the dollar volume of seriously delinquent student debt is over $30 billion and climbing compared to $8o billion of seriously delinquent mortgage debt on an aggregate balance that is nine times the volume of student loan debt.

seriously delinquent student debt

Why Can’t a Man Graduate More Like a Woman?

January 31, 2013

Brains are the most valuable resource in the 21st century.  Unless your state or region sits on top of a recently discovered oil or natural gas formation, skilled, well-educated individuals are the key source of competitive economic advantage throughout the U.S..   NH’s stellar growth in a slow growth region during the 1980’s and 1990’s and early part of the 2000’s was primarily driven by the increased concentration of “talent” in the Granite State.  A great state to live and work, with access to a regional labor market with a major metropolitan area that is home to world-class companies and institutions, and facilitated by NH public policies that increased the returns to education (by allowing individuals to keep more of the fruits of the education and labor) are largely responsible.  But in NH, as in the nation, half of the population appears  not to be contributing as much as they could be to a concentration of  talent that can provide us with a competitive advantage.  Females are now both entering and graduating from higher education institutions at rates that significantly exceed those of males.  I don’t know what is wrong with young males in this country, but as the father of young females, I didn’t need to look at a lot of data to know that young males have been a disappointment for some time now.

In NH, an increase in individuals with the highest levels of educational attainment  has largely been the result of an increase in the number of females in our state with at least a BA degree.  Increasing in numbers, females with at least a BA degree in NH now comprise more than 50% of NH’s labor force aged 25-64 with at least a BA degree.

Growth in Females with BA

I am pleased that the number of women with higher levels of educational attainment in NH is increasing, but I would be just as pleased if the number of males was increasing similarly, so that the growth in “talent” in NH didn’t depend so much on just continuing the positive trends among women.  Unfortunately, it doesn’t look like that is going to happen soon.  As the chart below shows, the trends in the educational attainment of NH’s younger labor force (age 25-34) shows that the number of males with at least a BA degree has been stagnating, while the number of females has risen substantially.

Age 25 to 34 With BA

I’ve got no particular insights into reasons for these trends and I have no direct experience with the decision and thought processes of  young males,  for most of the past several years its been my job to hate them, but  I could probably overcome some of that if they started contributing more to the concentration of skill and talent among us.


%d bloggers like this: